


Societies face numerous public goods problems and their solution requires cooperation. Examples cover a wide range of policy areas such as global warming (Barrett, Reference Barrett2003), economic crises and poverty (Kaul et al., Reference Kaul, Grunberg, Stern, Kaul, Grunberg and Stern1999), international security (Sandler and Hartley, Reference Sandler and Hartley1999), regime change (Hollyer et al., Reference Hollyer, Rosendorff and Vreeland2015), public health (Smith et al., Reference Smith, Beaglehole, Woodward and Drager2003), and knowledge (Stiglitz, Reference Stiglitz, Kaul, Grunberg and Stern1999). What explains the varying success of societies in realizing cooperation in the face of collective action problems? A large set of literatures in political science and many other academic disciplines have addressed this question both theoretically and empirically (Hume, Reference Hume2003; Olson, Reference Olson1965; Axelrod, Reference Axelrod1984; Ward, Reference Ward1990; Keohane and Ostrom, Reference Keohane and Ostrom1995). The cumulative empirical insights of lab and lab-in-the-field experiments investigating why groups succeed or fail in providing public goods have been central to this body of research. These studies strongly suggest that reciprocity, or the willingness to cooperate if one expects others to do so, constitutes a particularly influential determinant of actors’ behavior in public goods games when examining students (Fischbacher and Gächter, Reference Fischbacher and Gächter2010; Engelmann and Strobel, Reference Engelmann and Strobel2010; Charness and Haruvy, Reference Charness and Haruvy2002; Ostrom, Reference Ostrom2000) and other selected demographic subgroups (Fehr and Fischbacher, Reference Fehr and Fischbacher2002; Gächter et al., Reference Gächter, Herrmann and Thöni2004; Henrich et al., Reference Henrich, Boyd, Bowles, Camerer, Fehr, Gintis and McElreath2001).
This work has also inspired a growing literature in political science that highlights the importance of conditional cooperation for crafting political solutions to collective action problems. Examples include climate change (Bechtel et al., Reference Bechtel, Genovese and Scheve2017; Tingley and Tomz, Reference Tingley and Tomz2014; Bechtel and Scheve, Reference Bechtel and Scheve2013), tax policy (Frey and Torgler, Reference Torgler2007), political participation (Bolsen et al., Reference Bolsen, Ferraro and Miranda2014), and ethnic conflict (Habyarimana et al., Reference Habyarimana, Humphreys, Posner and Weinstein2007). These studies have in common that conditional cooperation appears to play an important role for our understanding of when societies succeed in solving collective action problems. Recent micro-level research has even begun to identify different types of conditionally cooperative individuals to explain variation in public goods provision over time (Fischbacher et al., Reference Fischbacher, Gächter and Fehr2001; Fischbacher and Gächter, Reference Fischbacher and Gächter2010) and in ethnically diverse societies (Habyarimana et al., Reference Habyarimana, Humphreys, Posner and Weinstein2007). This is because the exact functional form that individuals use to map from other contributions to their own contribution in public goods games may vary greatly and this variation in strategy types can have profound consequences for both the possibility of cooperation and the role of institutions in promoting the provision of public goods (Ostrom, Reference Ostrom2000).
Although much has been learned from this work, a widely shared concern about these results has been that they are largely based on student populations. Do more diverse and representative samples of subjects behave differently in social dilemmas? This question mirrors similar concerns that have been articulated in the case of online labor markets for political science experiments (Huff and Tingley, Reference Huff and Tingley2015; Berinsky et al., Reference Berinsky, Huber and Lenz2012) or regarding the samples used in education research that may not be representative of the population that researchers are actually interested in (Kern et al., Reference Kern, Stuart, Hill and Green2016).
While examining students or other selected subgroups of the adult population will yield generalizable results under the assumption of homogeneous treatment effects (Druckman and Kam, Reference Druckman and Kam2011), the plausibility of this assumption needs to be assessed empirically. Scholarship has begun to address this question primarily by moving labs to the field and examining behavior in ultimatum and trust games in more diverse, nonstudent samples (Gächter et al., Reference Gächter, Herrmann and Thöni2004; Bellemare and Kröger, Reference Bellemare and Kröger2007; Holm and Danielson, Reference Holm and Danielson2005; Tsai, Reference Tsai2007; Habyarimana et al., Reference Habyarimana, Humphreys, Posner and Weinstein2007). Yet, the subject pools are still, with a few exceptions (Fehr et al., Reference Fehr, Fischbacher, von Rosenbladt, Schupp and Wagner2002; Thöni et al., Reference Thöni, Tyran and Wengström2012), based on selected samples that are not nationally representative. More importantly, the results from these studies suggest that our ability to generalize from students to other sub-groups of the population may be limited. For example, Japanese fishermen (Stoop et al., Reference Stoop, Noussair and van Soest2012), adult trainee truckers (Anderson et al., Reference Anderson, Burks, Carpenter, Götte, Maurer, Nosenzo, Potter, Rocha and Rustichini2013), as well as adults from Oxford (Belot et al., Reference Belot, Duch and Miller2015) exhibit more cooperative behavior than students when making decisions in a laboratory environment. In fact, Belot et al. (Reference Belot, Duch and Miller2015) find that pro-social behavior differs most strongly when comparing students and nonstudent populations. Therefore, we still lack knowledge about public goods contributions and conditional cooperation among the general population in industrialized democracies. Filling this gap in the literature requires the use of nationally representative samples.
This paper provides the first evidence on public goods contributions in representative samples for four industrialized democracies and implements a novel between-subjects design for estimating the causal effect of expected cooperation. We fielded a large-scale survey (N = 8,500) in France, Germany, the United Kingdom, and the United States that included a two-player, simultaneous, anonymous public goods game. Our design uses both correlational variation within subjects and experimental variation between subjects to explore the effects of expected cooperation on individuals’ contributions to a public good. The causal evidence we present is based on a novel randomized experiment in the game instructions to respondents and an instrument that elicited the individual’s conditional contribution schedules (Rauhut and Winter, Reference Rauhut and Winter2010; Fischbacher et al., Reference Fischbacher, Gächter and Fehr2001; Selten, Reference Selten and Sauermann1967). The experiment randomized the example with which the instructions illustrated how the ultimate pay-off depends on both players’ actions. Thus, our version of an encouragement design experimentally manipulated whether respondents believed they were acting in a more or less cooperative environment. It provides between-subjects causal evidence that expectations about the cooperative behavior of others influence public goods contributions.
We find that, while socio-demographics are at most weakly correlated with individuals’ cooperative behavior, expectations about contributions by the other player are strong predictors of cooperation. Based on our randomized experiment, we provide the first between-subjects estimate of the causal effect of expected cooperation on public goods contributions in representative samples. We find that a 1 €/£/$ increase in the contribution an individual expects from the other respondent causes 1.4 €/£/$ higher own contributions on average. While this effect size suggests that individuals over-reciprocate, we find that a 95% confidence interval for this estimate contains 1. This result significantly strengthens the empirical literature on conditional cooperation: The effect of expected cooperation on contribution behavior is substantively large, clearly evident in a representative set of subjects, and can be given a causal interpretation.
In addition to studying the average effects of conditional cooperation, we investigate who employs reciprocal strategies and how these reciprocity types condition the causal effect of expected cooperation. We classify our 8,500 respondents into different groups of conditional cooperators (Fischbacher et al., Reference Fischbacher, Gächter and Fehr2001; Thöni et al., Reference Thöni, Tyran and Wengström2012), distinguishing between Positive Reciprocity (44%), Positive Nonconditional (13%), Freerider (11%), Inverse U-shaped Reciprocity (5%), and Other (27%). Although the distribution of these types is quite similar across our four countries, we find that they are not evenly spread throughout the populations. Specifically, we find that positive reciprocity types, i.e., individuals that contribute more if others contribute more, are significantly more widespread among female, younger, wealthier, and more educated individuals. Further, we find that even among positive reciprocity types, younger, wealthier, and highly educated individuals respond more strongly to their expectations of the contributions of others to the public good. Finally, we re-estimate the causal effect of cooperative expectations for different reciprocity types using the experimental design described above. We find that the effects of expectations about the contributions of others are strongest among positive reciprocity types and generally insignificant for most of the other strategy types.
Taken together, these results provide new and compelling evidence of the important causal role that reciprocity plays in the provision of public goods. Further, our analysis suggests that the ability of researchers to generalize from student samples to other subgroups depends on the research question and the target population of interest. Our results indicate that the overall level and distribution of contributions in public goods games are similar in representative and student samples. However, we also find important differences in the extent and type of conditional cooperation across different socio-demographic groups. Individuals that employ conditionally cooperative strategies are disproportionately younger, wealthier, and more educated. We also show that the causal effect of expected cooperation is greater among individuals employing conditionally cooperative strategies. These socio-demographic characteristics vary either slowly over time or are largely time-invariant. Since previous research has suggested that social preferences exhibit a high degree of stability over the long run (Carlsson et al., Reference Carlsson, Johansson-Stenmann and Nam2014), this heterogeneity could be substantively consequential for understanding cooperation across groups and helps to shed light on when researchers may find employing more representative albeit more costly samples useful. We discuss the implications of these findings for our understanding of cooperation in social dilemmas, the role of policy interventions and institutions for equilibrium selection in collective action problems, and subsequent research on reciprocity.
SURVEY, SAMPLE, AND EXPERIMENTAL DESIGN
Our survey was conducted on representative samples of the adult population in France (N = 2,000), Germany (N = 2,000), the United Kingdom (N = 2,000), and the United States (N = 2,500). The surveys were carried out online by YouGov in summer 2012. YouGov employs matched sampling to approximate a random sample of the adult population (Rivers, Reference Rivers2011). The appendix provides details about the survey design including marginal distributions of socio-demographics in the sample and the populations (see Table A1). These descriptives reveal that the socio-demographic margins of the samples in the four countries are very similar to that of the target populations. However, since matching is approximate, survey weights were computed based on official information about the distribution of socio-demographic characteristics to eliminate the remaining imbalances. The results we report below are based on weighted data but remain virtually unchanged when reestimated without weights.
The survey had two parts. The first part was an anonymous, two-player public goods game that was embedded in a randomized experiment. This component of the survey provides us with exogenous between-subjects variation in individuals’ levels of expected cooperation. The experiment did not involve deception. The second part elicited respondents’ contribution schedules using the strategy method (Selten, Reference Selten and Sauermann1967) that asks individuals to indicate how much they are willing to contribute given the other player’s contribution.
Public goods game and other contribution experiment
Our survey informed all respondents that they could win one of two Amazon gift cards and that the amount of the gift card would depend (i) on their decision about whether to give some amount of the gift card to the other winner and (ii) the analogous decision made by that winning respondent. The survey left the probability of winning a gift card unspecified.Footnote 1 Any amount given to the other respondent would be subtracted from the individual’s base winnings of 100 €/£/$ and doubled before it was distributed to the other winner. Thus, the public good in this case equals the amount of money that the group takes from the experimenter. Formally, the payoff function for an individual i is: Π i = 100 − c i + 2c j , where c i denotes one’s own contribution and c j is the contribution by the other individual. Standard economic theory predicts that individuals should contribute nothing, which implies that the payout to the two winners is the minimum aggregate payoff of 200 €/£/$. However, the highest possible aggregate payoff is 400 €/£/$. The exact instructions that followed the description of the raffles were the following:
The ultimate value of the voucher depends on your decision on the following: If you win a voucher, you can decide to increase the value of the second voucher that another person has won. You can give any amount between 0 and 100 €/£/$ by which the value of your voucher will be decreased. Each €/£/$ that you decide to give to the other individual will be doubled. This means that if you decide to give, say, [10, 30, 60, 90]€/£/$, the other person will receive (20, 60, 120, 180) €/£/$ and you will receive (90, 70, 40, 10)€/£/$. Likewise, if the other person decides to give, say, [10, 30, 60, 90]€/£/$, you will receive (20, 60, 120, 180)€/£/$ and they will receive (90, 70, 40, 10)€/£/$.
We randomized the value in square brackets and computed the corresponding values stated in parentheses. As an example, one possible realization of the randomized part of the instructions was: “This means that if you decide to give, say, $10, the other person will receive $20 and you will receive $90. Likewise, if the other person decides to give, say, $60, you will receive $120 and they will receive $40.” Thereby, we exogenously varied whether respondents were acting in a more or less cooperative environment. The design of our other contribution experiment therefore resembles a mild version of an encouragement design that typically invites subjects randomly to participate in a treatment condition if a randomized control trial does not seem feasible because of ethical or practical reasons (West et al., Reference West, Duan, Pequegnat, Gaist, Jarlais, Holtgrave, Szapocznik, Fishbein, Rapkin, Clatts and Mullen2008).Footnote 2 In our application, informing subjects that the other winner would contribute a specific amount would be dishonest (Morton and Williams, Reference Morton and Williams2010; Dickson, Reference Dickson2011). Our version of an encouragement design that merely provides examples included in the instructions to explain the payoff mechanism enables us to avoid deception.
We subsequently asked respondents how much they would like to contribute and how much they expect the other winner to contribute (the order in which we asked these questions was randomized). After completion of the field work, the winners were drawn and their contribution decisions determined the payoffs. When comparing our results with those reported in lab-experimental studies with selected subsets of the population, it may be relevant to consider the level of incentives. However, a review of more than 70 experiments concludes that differences in incentivization do not affect subjects’ contributions on average (Camerer and Hogarth, Reference Camerer and Hogarth1999). Moreover, Gillis and Hettler (Reference Gillis and Hettler2007) show that even hypothetical incentives tend to replicate behavior in public goods games that are incentivized.
Measuring different types of conditional cooperation
The second part of the survey asked respondents about their conditional contribution schedules. To determine individuals’ types of conditionally cooperative strategies, immediately after our survey respondents played the payoff-relevant public goods game, we asked them to indicate how their own contribution potentially depends on the other individual’s contribution (Rauhut and Winter, Reference Rauhut and Winter2010; Fischbacher et al., Reference Fischbacher, Gächter and Fehr2001; Selten, Reference Selten and Sauermann1967). The exact question wording was the following:
Now suppose you knew how much the other winner of the voucher was going to contribute. Please indicate how much you would like to give if the other winner of the voucher gives the following amount? Remember that any amount that you decide to give to the other winner is doubled.
The respondent then chose a value they would give if they knew the other winner contributed 0, 25, 50, 75, 100 €/£/$.
Figure A1 shows the 8,500 individual contribution mappings with darker lines indicating higher frequency. This part of the survey was not explicitly incentivized. To probe whether this part of the survey generated differences in individuals’ level of conditional cooperation, we used an individual’s expectation about the other contribution and his/her strategy (which maps from other to own contribution) to generate the contribution we would expect him/her to make based on his/her answers in the strategy method part of the survey, which asked respondents to indicate how much they would contribute given the other player’s contribution. The appendix provides more details about this additional analysis and the results. We find a very strong positive correlation between individual’s contribution choices in the payoff-relevant part of the survey and the strategy method part. This suggests that the answers in these two parts of the survey are consistent. The results are reported in Table A6 (see also footnote 7).
To explore the distribution of strategy types we code respondents depending on the functional form that relates their own contribution and the contribution by the other individual (the appendix provides detailed coding rules). Our approach employs a computational algorithm in the spirit of Kurzban and Houser (Reference Kurzban and Houser2005) and uses a slightly more fine-grained classification than previous work (Fischbacher et al., Reference Fischbacher, Gächter and Fehr2001; Thöni et al., Reference Thöni, Tyran and Wengström2012) to distinguish five types: Freerider, Positive Nonconditional, Positive Reciprocity, Inverse U-shaped Reciprocity, and Other. We add the category of “Positive Nonconditional” individuals because we empirically observe a nonnegligible share of respondents (about 10% or 800 individuals) that make constant, positive contributions. Those individuals do not plausibly exhibit an erratic pattern that one would want to classify as “other.” Given that this type of behavior also seems theoretically important, we add it as an additional category.Footnote 3
Respondents are coded as Freeriders if they always contribute less than 5 €/£/$. We code an individual as Positive Nonconditional if she/he gives a constant positive contribution that does not vary across the different known values of the other winner’s contribution (graph is a horizontal line placed above 0). The horizontal line need not be perfectly flat but cannot vary across all values by more than 5 $/£/€. Positive reciprocity types are individuals whose contributions increase monotonically and the total increase is greater than 5 $/£/€. We also identify inverse U-shaped reciprocity types (sometimes called “triangle contributors,” see Fischbacher and Gächter (Reference Fischbacher and Gächter2010)) whose contribution function is convex and the difference between the maximum and minimum contribution is greater than 5 $/£/€. Types that do not fit any of the definitions above are coded as Other. We also reestimated all results using 10 $/£/€ as the threshold. Our findings remain virtually identical.
Figure 1 shows the distributions of strategy types by country. Across all four countries we find largely similar distributions of individuals’ strategy types. About 10% of the populations are Freeriders and roughly the same share can be classified as Positive Nonconditional. Between 40% and 50% of the societies consist of positive reciprocators. Finally, about one third of our representative sample uses some other functional form to map from their expectations about other contributions to their own contribution level.
Distributions of Strategy Types by Country.

How does the distribution of strategy types, which is based on a large, representative sample, compare with those reported in lab-experimental studies with students as subjects? We find that the share of positive reciprocators largely equals that reported in lab-experimental studies (Fischbacher et al., Reference Fischbacher, Gächter and Fehr2001). However, we observe a smaller share of freeriders (10%) than previous work examining students as subjects. For example, Fischbacher et al. (Reference Fischbacher, Gächter and Fehr2001) classify 13 out of 44 students (30%) as purely selfish. Also, in our large, representative sample the share of “hump-shaped” contribution schedules is smaller (about 5%) than in their student sample (14% or 6 out of 44).
RESULTS
Own contribution behavior and expected contributions
Figure 2 shows the distribution of individual contributions in the public goods game for the pooled data (N = 8,500). Only about 12% of the individuals in France, Germany, the United Kingdom, and the United States make zero contributions. The vast majority contributes substantively to the public good. The modal contribution is 50 €/£/$. Overall, contributions cluster at 0, 10, 20, 25, 50, and 100 €/£/$ and the average contribution is 29.4 €/£/$. The high percentage of respondents that contribute to the public good resonates with the main claim of the lab-experimental literature that cooperative behavior in public goods games is substantially more prevalent than predicted by standard economic theory. Moreover, the average contribution implies a 29.4% of endowment contribution, which is broadly similar to average values reported in laboratory studies for one-shot static public goods games like ours.Footnote 4
Distribution of Own Contributions to the Public Good in Representative Samples.
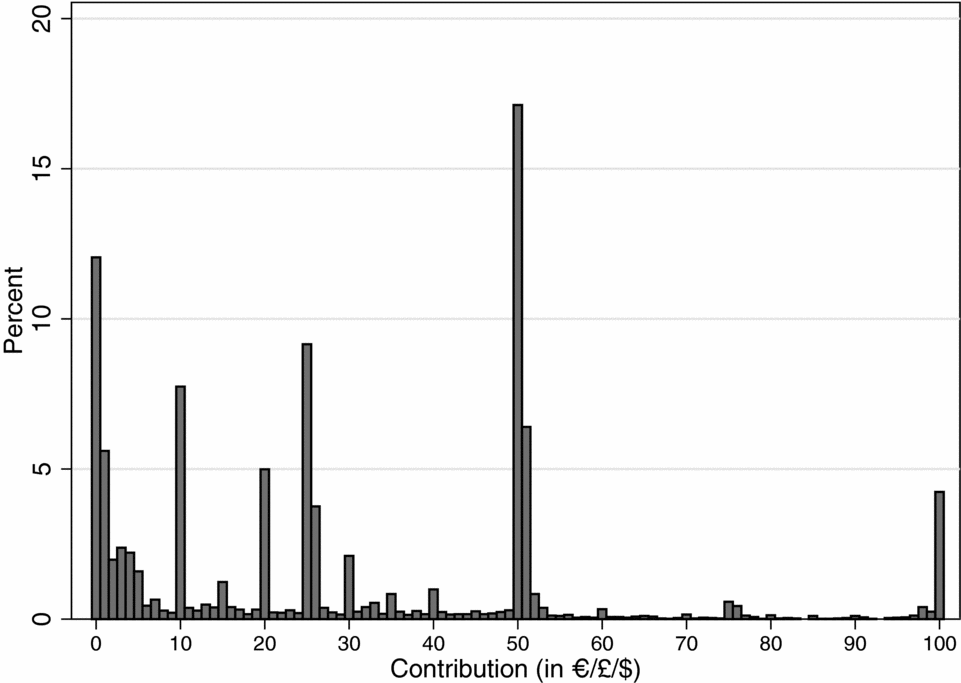
Figure 2 reveals substantial variation in the distribution of public goods contributions in a representative population. What explains this variation and what is the relative importance of socio-demographic characteristics as opposed to norms of conditional cooperation? Since we examine cooperative behavior in representative samples with over 8,000 respondents who offer a lot of variation in socio-demographics attributes, we have the rare opportunity to explore if public goods contributions cluster along socio-demographic cleavages or whether they mostly reflect the presence or absence of reciprocal expectations. Thereby, our study also provides evidence on the generalizability of lab-experimental findings with selected subgroups of populations. To the extent that socio-demographic differences do not exist, studying selected subgroups reduces research costs without compromising on the generalizability of the findings.
We first explore the socio-demographic distribution of cooperation. To this end, we constructed the variable Own Contribution equal to each respondent’s stated contribution to the linear public goods game. Figure 3 reports the ordinary least squares coefficient estimates—with 95% confidence intervals based on heteroskedasticity-robust standard errors—for the regression of Own Contribution on indicator variables for sex, age, income, and education. The results are striking. In general, socio-demographic characteristics are uncorrelated with observed contribution behavior. The estimates reported in Figure 3 are small and statistically insignificant for age, income, and education. The one exception to this pattern is that on average, women tend to contribute about 2 €/£/$ less than men. This stands in contrast to most lab-experimental studies with students and other selected subgroups of the population, which report that female subjects tend to contribute more than male individuals.Footnote 5 This discrepancy could indicate that female students in lab-experimental studies behave differently than women in the overall population, although other explanations, for example, that women respond more strongly to implicit or explicit cues provided by the experimental setting (Croson and Gneezy, Reference Croson and Gneezy2009) remain possible. We also found no significant differences in our pooled analyses by marital status, employment status, and ideology.Footnote 6
Correlates of Cooperative Behavior in France, Germany, the United Kingdom, and the United States (Pooled Data).

Overall, there exists little evidence in our data to suggest that some socio-demographic groups cooperate more in our public goods game than others. This evidence helps in assessing the plausibility of explanations for variation in public goods contributions. For example, it is inconsistent with the idea that high income individuals feel better able to afford contributions and thus find it easier to cooperate among themselves. These results are also inconsistent with explanations based on the idea that higher educated individuals have the ability to realize the advantages of everyone contributing and thus cooperate more easily.
Our primary interest is in determining the importance of conditional cooperation in explaining contribution behavior in our large-scale, representative sample. We converted our continuous measure of the expected contribution of the other respondent, Expected Contribution, into three indicator variables based on the 25th and the 75th percentile of the observed distribution and added them to the regression model. Figure 3 also reports these estimates. Compared to those with a low expected contribution (between 0 and below 3 €/£/$), respondents that expect a medium contribution (3 to below 50 €/£/$) decide to contribute about 24 €/£/$ more on average. Respondents that expect the other winner to make a high contribution (50 or more €/£/$) contribute about 50 €/£/$ more on average. We find that, when compared to coefficients on the socio-demographic variables, an individual’s expectation about how much the other individual will contribute is, by far, the strongest predictor. This finding remains unchanged if we re-estimate the model using a continuous measure of expectations, Expected Contribution, where we obtain a highly significant and positive coefficient (0.73, p < 0.001).
In an additional analysis reported in Table A2 (Model 2), we add a large set of covariates including a variable that captures individuals’ level of altruism using a quasi-behavioral measure of altruistic inclination. This measure is based on the following survey instrument: We informed respondents that we will raffle another 100 €/£/$ among all respondents that completed the survey and that the winner can decide to donate parts of the voucher to a charity. We then asked respondents whether they would like to donate in case they won a voucher. If respondents indicated that they wanted to donate, we offered a large list of charities from which individuals could choose and asked them about the amount they would like to give. We coded respondents as exhibiting a relatively high level of altruism if, within the group of those willing to donate, they donated a nonzero amount (the median donation was zero). Consistent with previous laboratory results, we find that more altruistic individuals contribute significantly more in the public goods game, but we also find that the point estimates for the expected cooperation indicators remain largely unchanged even when accounting for altruism and other potential confounds.
We also reestimated the model separately for those randomly selected 50% of respondents that were first asked to indicate their own contribution and for the remaining 50% of respondents that were first asked to indicate their expectations about how much the other winner contributes. The results for these two subgroups are virtually identical (see Models 3 and 4 in Table A2). Overall, the findings from our representative sample are consistent with the view that reciprocity is an important norm that guides individual contribution behavior.
The causal effect of expected cooperation
The partial correlation between expectations about the cooperative behavior of others and an individual’s own contribution may or may not reflect a causal relationship. Individuals with particular unobserved characteristics could tend to be both more likely to think others will contribute generously and therefore, they would contribute more themselves making the reciprocity account of the observed correlation spurious. To estimate the causal effect of expected contribution behavior in representative samples, we exploit the randomized experiment embedded in the instructions for the public goods game. We regress an individual’s own contribution decision on the treatment indicator Other Contribution Treatment: High that equals 1 if the respondent received instructions in which the other winner’s contribution was 30, 60, or 90 €/£/$ and is zero otherwise. The results are identical when we create indicator variables for all treatment conditions (see Table A5). Model 1 in Table 1 shows the reduced form results. We find that individuals in the high other contribution treatment contribute 2.4 €/£/$ more than respondents in the low other contribution treatment. This estimate is almost identical when we add a full set of socio-demographic covariates, country fixed effects, and controls for the own contribution treatment frame.
The Causal Effect of Expected Contribution on Own Contribution: Reduced Form and Instrumental Variable Results

This table reports coefficients and robust standard errors in parentheses (***p < 0.01, **p < 0.05, *p < 0.10). Columns 1 and 2 report reduced form ordinary least squares (OLS) regression results of Own Contribution on the Other Contribution Treatment: High which is equal to 1 if the randomized example of the other lottery winner’s contribution is equal to 30, 60, or 90 and equal to zero if it is 10. Columns 3 and 4 report the first stage regression of Expected Contribution on Other Contribution Treatment: High. Columns 5 and 6 report the instrumental variable estimates of Own Contribution on Expected Contribution using Other Contribution Treatment: High to instrument for Expected Contribution.
To estimate the causal effect of expectations about the other winner’s contribution on own contributions, we use Other Contribution Treatment: High as an instrument for Expected Contribution. This instrumental variable (IV) estimation assumes that (a) the randomly assigned treatment Other Contribution Treatment: High encourages respondents to have higher expectations about the other winner’s contribution and (b) that there is no other direct effect of this treatment on own contributions. Models 3 and 4 in Table 1 report results from a regression of Expected Contribution on Other Contribution Treatment: High that support the first assumption. We find that individuals in the high other contribution treatment expect about 1.7 €/£/$ higher contributions from the other winner than respondents in the control group. Although the second assumption (the exclusion restriction) cannot be tested, it appears plausible since the treatment is a randomly assigned specific suggestion about the other winner’s contribution.
Models 5 and 6 in Table 1 report the instrumental variable estimates of the causal effect of Expected Contribution on Own Contribution. A 1 €/£/$ increase in the contribution that an individual expects from the other winner increases own contributions by about 1.4 €/£/$. This estimate does not mean that individuals systematically over-reciprocate because when we construct a 95% confidence interval for this estimate, we find that the estimate is not significantly greater than 1 (the interval is (0.65, 2.11)). The effect size is close to what previous lab-experimental work has reported (Fischbacher and Gächter, Reference Fischbacher and Gächter2010) and even closer to results based on a heterogeneous sample of adults in Denmark (Thöni et al., Reference Thöni, Tyran and Wengström2012).Footnote 7 A natural interpretation of these findings is that cooperative expectations play an important causal role in explaining behavior in social dilemma situations, while socio-demographic characteristics of individuals are not particularly important. At the same time, however, we do not know whether some reciprocity types are more or less widespread among specific socio-demographic groups.
The socio-demographic distribution of reciprocity types
To explore the socio-demographic variation in the use of reciprocal strategies, Figure 4 shows the estimated change in the probability of observing a given strategy type for a given demographic change holding all other variables at their means (Table A7 reports the multinomial logit estimates used for these simulations). We find that female, younger, wealthier, and highly educated respondents are all systematically more likely to use positive reciprocity strategies. For example, the probability of Positive Reciprocity is 11 percentage points higher among high education respondents compared to the lower educated reference group. Overall, these results suggest that a group’s socio-demographic composition matters for which strategy types are more prevalent. Variation in the socio-demographic composition of strategy types leaves open the possibility that some demographic groups may find it easier to cooperate than others. More specifically, groups for which positive reciprocity strategies are more prevalent may be more likely to respond to policy and institutional interventions that seek to raise expectations about the cooperative behavior others.
The Socio-demographics of Strategy Types in France, Germany, the United Kingdom, and the United States (Pooled Data).

To explore these socio-demographic differences further, we investigate whether among the plurality of individuals who employ positive reciprocal strategies, there is variation in the responsiveness of cooperative behavior to changes in expectations. Although positive reciprocity generally facilitates cooperative behavior, the long-term evolution of cooperation depends on the exact elasticity of conditional cooperation, i.e., the extent to which an individual’s own contribution to a public good increases in response to a unit increase in expected contributions by others. The higher the elasticity of conditional cooperation, the better the prospects for lasting cooperation (Fischbacher and Gächter, Reference Fischbacher and Gächter2010).Footnote 8
To estimate the socio-demographic distribution of contribution elasticity, we first estimated an auxiliary regression for each respondent in which we regressed her/his contribution on a variable that indicated the amount given by the other person (0, 25, 50, 75, and 100 €/£/$).Footnote 9 We then model an individual’s contribution elasticity as a function of a full set of income, age, gender, and education indicator variables. Model 1 in Table 2 shows the results. We find significant differences in the distribution of contribution elasticity across socio-demographic groups. On average, female individuals have lower elasticities than male respondents. We also find, in line with our results on the socio-demographic distribution of strategy types, that older individuals exhibit significantly less strongly reciprocal contribution schedules. Finally, those with higher levels of income and the more educated have significantly larger contribution elasticities. These findings remain virtually identical when adding additional covariates and when re-estimating the results using a tobit model. Overall, even when focusing on those parts of society that generally employ conditionally cooperative strategies, we find that some socio-demographic groups—male, younger, richer, and more educated individuals—appear to be significantly more conditionally cooperative than others.
The Socio-demographic Correlates of Contribution Elasticity

This table reports coefficients and robust standard errors (in parentheses) from several regressions of contribution elasticity on socio-demographic variables (***p < 0.01, **p < 0.05, *p < 0.10). Columns 1 and 2 report ordinary least squares (OLS) regressions. Column 3 reports tobit estimates.
The causal effect of expectations by strategy type
We now explore whether strategy type conditions the cooperation-enhancing effect of expectations about the contribution behavior of others in theoretically meaningful ways. Specifically, we expect that the causal effect of expected cooperation should be most evident for Positive Reciprocity types. In contrast, the level of cooperation an individual expects should not matter for those employing a freerider strategy. To evaluate these predictions we reestimate the instrumental variable models presented in Table 1 by strategy type. The results reported in Table 3 support our conjecture. The causal effect of expected contribution is strongest among positive reciprocity types with a highly significant IV estimate of 1.3. In contrast, the estimates for Freerider, Inverse U-shaped Reciprocity, and Other are all statistically insignificant. For the remaining category of Positive Nonconditional types, the IV coefficient is smaller (0.89) and only marginally significant.Footnote 10
The Causal Effects of Cooperative Environment on Own Contributions by Strategy Type: Instrumental Variable Results

This table reports instrumental variable estimates of Expected Contribution on Own Contribution using Other Contribution Treatment: High to instrument for Expected Contribution. Robust standard errors are shown in parentheses (***p < 0.01, **p < 0.05, *p < 0.10).
DISCUSSION
Societies in which individuals succeed in solving cooperation problems that allow for profitable exchanges have better prospects to grow and develop. The available lab-experimental studies investigating why groups succeed or fail in solving social dilemmas emphasize that individuals cooperate more than predicted by standard economic theory and that the willingness to cooperate is sensitive to expectations about the willingness of others to cooperate—conditional cooperation is an important feature of human behavior (Fehr and Fischbacher, Reference Fehr and Fischbacher2002; Fehr and Schmidt, Reference Fehr and Schmidt2006; Ostrom, Reference Ostrom2000). These conclusions and many others in this literature are largely based on the behavior of students and other selected populations in a laboratory setting. Although a great deal has been learned from this research, an obvious concern—one shared by many of the contributors to this literature—is that representative populations might behave differently. A number of previous empirical studies have begun to address this issue by studying behavior in social dilemmas in diverse and even relatively large groups of subjects (see, for example, Baldassari and Grossman, Reference Baldassari and Grossman2013; Habyarimana et al., Reference Habyarimana, Humphreys, Posner and Weinstein2009). With just a few exceptions, however, these existing studies are still based on selected and not nationally representative samples.
Extending our knowledge of how individuals behave in social dilemmas to representative samples has the potential to answer several fundamental questions. For example, are some demographic groups more likely to cooperate and if so why? Is the correlation between public goods contribution and expected cooperation by others causal? And do students and the general population differ in how much they react to the behavior of others? We need answers to these and other related questions to determine a baseline level of cooperative behavior among humans and how difficult it will be for different communities to solve social dilemmas. The answers also matter for understanding the potential effectiveness of different policy or institutional interventions to increase cooperation.
In this study, we start to contribute to this agenda by focusing on behavior in a public goods problem and specifically on the role of cooperative environments in explaining cooperation. Our study, based on representative samples in France, Germany, the United Kingdom, and the United States, provides strong evidence that many important insights about behavior in public goods games observed among students and other selected populations are also evident in representative samples. We find that average contributions as a proportion of initial endowment are quite similar to those reported in studies with student subjects. Most importantly, we find that expectations about the contributions of others are strongly correlated with own contributions—reciprocity is central for understanding public goods contributions. Moreover, we implement a new between-subjects design for establishing that this relationship is causal. Our causal estimate based on representative samples further underscores the importance of reciprocity as promoting cooperation in industrialized countries.
We also provide several results that are either in tension with findings in studies on students and other nonrepresentative samples or have not been previously explored. When coding the distribution of conditionally cooperative strategies that individuals employ we find generally similar patterns across our four countries with Positive Reciprocity types constituting a plurality of respondents (generally between 40% and 50%) and with Freeriders making up about 10% of the distribution. Most importantly, we document that the causal effect of expectations about the contributions of others is only clearly evident among respondents coded as positive reciprocity types. These types are unequally distributed in the population with younger, richer, and more educated individuals more likely to employ positive reciprocal strategies, and thus be more likely to respond to treatments that manipulate expectations about others cooperative behavior. This second set of results suggests the potential usefulness of complementing studies of students and other convenience samples with representative samples when studying conditionally cooperative strategies.
A noteworthy implication of our results is that specific socio-demographic groups within societies and the regions or countries in which they concentrate may enjoy an advantage in solving public goods problems. These individuals react positively to institutions that stabilize expectations about the cooperative behavior of others. Thus, political institutions will be most effective among socio-demographic groups in which positive reciprocity is more widespread. If, for example, individuals do not play conditionally cooperative strategies, institutions that increase expectations about other individuals’ contributions will have at best small effects. In contrast, such institutions will have positive effects in populations that indeed use positively reciprocal strategies. Consequently, policymakers and scientists engaging in the design of institutions to facilitate solving cooperation problems, for example, to reduce pollution, tax fraud, or global warming, can improve the effectiveness of policy interventions by taking into account which types of strategies individuals in the target population employ and how these are distributed.
Finally, our study of conditional cooperation in representative samples also promises to shed some light on the long-term evolution of societies in the presence of multiple equilibria with ex ante uncertainty about whether a society will realize a more or less cooperative equilibrium in the long-run (Axelrod, Reference Axelrod1984). While we have focused on four industrialized countries, subsequent research could begin to map out the distribution of social norms such as conditional cooperation in less developed countries as this may not only improve our ability to understand the dividing lines in political choices on public goods problems but could also explain more fundamental equilibrium selection phenomena that account for differences in countries’ economic, social, and political long-term trajectories.
SUPPLEMENTARY MATERIALS
For supplementary material for this article, please visit Cambridge Journals Online: https://doi.org/10.1017/XPS.2017.16.



