Introduction
For-profit (FP) nursing homes are said to be driven by profit maximizing and, thereby, expend fewer resources on resident care than not-for-profit (NFP) homes resulting in poorer quality (Harrington, Reference Harrington2001; Harrington et al., Reference Harrington2001; Spector et al., Reference Spector, Selden and Cohen1998). Hillmer et al. (Reference Hillmer, Wodchis, Gill, Anderson and Rochon2005: 162) concluded from their review of studies on quality of care in US FP and NFP nursing homes that ‘despite increased awareness and numerous high-profile government reports and publications, residents in FP nursing homes were more likely to be the recipients of poor quality compared with similar residents in NFP facilities’. In the US, theory has been primarily concerned with explaining the behavior of FP nursing homes because most nursing homes in the US, about two-thirds, are FP (Norton, Reference Norton, Culyer and Newhouse2000). Public policy has also been proposed to eliminate US FP nursing homes due to their purported poorer quality (Harrington et al., Reference Harrington, Cassel, Estes, Woolhandler and Himmelstein1991). Would quality substantially improve by making all US nursing homes NFP? Although analysts have questioned explaining differential quality exclusively by ownership type (Davis, Reference Davis1991; Tsai and Kinosian, Reference Tsai and Kinosian2003), explaining nursing home performance by profit status remains an attractive and dominant interest in the field.
Though concluding that US FP facilities provided poorer quality, Hillmer et al. (Reference Hillmer, Wodchis, Gill, Anderson and Rochon2005: 159) recognized that other factors warrant study when stating that:
Simple association between quality and facility ownership does not provide sufficient information about the nature of the relationship between ownership and quality. What about NFP facilities enables them to provide higher quality? Are differences between NFP and FP facilities attributable to differences in cost structures? The issue of the mix of prices paid by residents within a nursing home also has important potential implications on the quality differences between nursing homes … For example, FP homes may offer lower quality compared with NFP homes because they serve clientele [e.g., Medicaid residents] with less ability to pay higher prices. Perhaps there would be no observable difference in quality if FP homes had a similar price mix compared with NFP homes.
Using panel data, we investigated in more detail than previously how US FP and NFP nursing facilities may be affected similarly by: (1) the percent of Medicaid residents in a facility (also ‘percent Medicaid’ or ‘Medicaid census’), (2) the Medicaid payment rate, and (3) a facility's occupancy percent (also, ‘occupancy’).
We used two measures of nursing home performance: (1) the percent of residents with physical restraints, and (2) the registered nurse (RN) staffing ratio, i.e. RN hours per resident day. Each measure represents an important dimension of resident care relevant to predictions from the resource dependence framework outlined below. By focusing on these two characteristics, we provide a detailed comparison between FP and NFP facilities.
Physical restraints indicate performance related to a resident outcome. Percent of residents with physical restraints may be the most widely studied single outcome in nursing home research and is an outcome that may be less contingent on resident clinical status than facility practice tied to resources allocated to resident care (e.g., Castle, Reference Castle2000; Castle et al., Reference Castle, Fogel and Mor1997; Castle and Mor, 1998; Phillip et al., Reference Phillips, Hawes, Mor, Fries, Morris and Nennstiel1996). Restraint use has also been the subject of US governmental quality improvement initiatives to facilitate innovations in nursing homes to reduce reliance on restraints (Castle et al., Reference Castle, Fogel and Mor1997; Castle and Mor, Reference Castle and Mor1998).
RN staffing level is a input or structural characteristic indicating resources expended on resident care. Other studies have also used RN staffing as a dependent variable in the analysis of nursing home performance (e.g., Grabowski, Reference Grabowski2001; Harrington and Swan, Reference Harrington and Swan2003). Higher RN staffing levels in nursing homes have been shown to reduce adverse resident outcomes, such as urinary tract infections, pressure ulcers, catheter use, and weight loss (Anderson et al., Reference Anderson, Hsieh and Su1998; Horn et al., Reference Horn, Buerhaus, Bergstrom and Smout2005; Kramer and Fish, Reference Kramer and Fish2001; Weech-Maldonado et al., Reference Weech-Maldonado, Meret-Hanke, Neff and Mor2004).Footnote 1 Higher RN staffing levels in nursing homes may be associated with better outcomes on average because, with increased RN levels, RNs are better able to apply their knowledge to the planning, assessment, and supervision of care (Anderson et al., Reference Anderson, Hsieh and Su1998; Horn et al., Reference Horn, Buerhaus, Bergstrom and Smout2005; Kramer and Fish, Reference Kramer and Fish2001; Weech-Maldonado et al., Reference Weech-Maldonado, Meret-Hanke, Neff and Mor2004). In any case, FP nursing homes have been shown to have lower RN staffing levels (Harrington and Swan, Reference Harrington and Swan2003; Health Care Financing Administration [HCFA], 2000a). RN staff is more costly than licensed practical nurses (LPNs) and nursing assistants (NAs) (Decker et al., Reference Decker, Dollard and Kraditor2001), leading analysts to imply that because of the profit motive, FP facilities substitute lower priced staff (LPNs and NAs) for RNs with negative consequences on resident care (Harrington, Reference Harrington2001; Harrington et al., Reference Harrington, Woolhandler, Mullan, Carrillo and Himmelstein2001).
Theoretical framework
Resource dependence theory emphasizes that organizational behavior is related to the external environment that controls the resources an organization requires to survive (Pfeffer and Salanick, Reference Pfeffer and Salanick1978). Pfeffer and Salanick defined dependence as the extent to which an input or output important to an organization's operation is controlled by relatively few parties. Organizations take actions to reduce dependence where possible and, where dependence cannot be reduced, make accommodations to the dependence. A resource dependence model has been used to examine the propensity of nursing facilities to make innovations in services and care practices (Banaszak-Holl et al., Reference Banaszak-Holl, Zinn and Mor1996; Zinn et al., Reference Zinn, Weech and Brannon1998) and is applicable to inquiry on restraint use and RN staffing decisions.
Prevailing theory emphasizes the resource dependence of FP nursing homes. Only FP facilities are assumed to respond to market characteristics in a manner affecting performance in resident care (Norton, Reference Norton, Culyer and Newhouse2000; Scanlon, Reference Scanlon1980; Grabowski and Hirth, Reference Grabowski and Hirth2003). Nevertheless, Medicaid census and occupancy in a facility, along with Medicaid payment rates, may affect the resource dependence of FPs and NFPs. A state Medicaid program is, for instance, one party that may control a facility's resource inputs. A high percentage of Medicaid residents represents heightened reliance on Medicaid payments, which are low relative to other payers. High Medicaid dependence may limit resources available to take actions to alter the facility's position in the environment to remove the Medicaid dependence. The Medicaid payment rate and the occupancy percent, for reasons detailed later, can also affect dependence on revenue sources. Further, interactions between percent Medicaid, Medicaid payments, and occupancy may affect a facility's resource dependence. For example, the constraints of high reliance on Medicaid may be lessened to some extent in a state with a relatively high Medicaid payment rate.
Innovations to improve performance are implemented over time. In the case of a facility dependent on Medicaid, whether FP or NFP, there may be less disposable (or, ‘discretionary’) income compared to other facilities, and management may be less likely to, or unable to, take the risk of dedicating scarce resources to implement innovations to reduce restraint use or to provide more RN care. A nursing facility's resources at one point in time, in other words, likely affect the extent of investments planned to influence future performance. So we used lagged measures of Medicaid and occupancy attributes at an earlier time period to predict performance at two subsequent time periods. For ease of presentation, in the hypotheses T1 refers to the time period preceding the future two periods of T2 and T3.
Main effects
Percent of Medicaid residents. Medicaid payment rates are commonly established by US states with formulas that result in lower reimbursement rates relative to other payers (Meyer, Reference Meyer2001; US General Accounting Office [GAO], 2003). And though rates may increase from year to year, that does not mean increases cover costs (US GAO, 2003: 13). Medicaid rates also are tied to the fiscal status of states where fiscal crisis introduces uncertainty for nursing homes about future Medicaid rates (cf., Centers for Medicaid and Medicare Services [CMS], 2003; Smith et al., Reference Smith, Ramesh, Gifford, Ellis and Wachino2003). Dependence on Medicaid results in limited disposable income and uncertainty about future revenue levels which limit investments to improve future resident care.Footnote 2 Thus, the first hypothesis is that:
H1: The percent of Medicaid residents at T1 is positively associated with the percent of residents with physical restraints and negatively associated with the RN hours per resident day at T2 and T3 among FP and NFP nursing homes.
Medicaid payment. Although Medicaid payments on average may not cover costs, states vary in Medicaid payment rates. Lower Medicaid payment, it is proposed, lowers the ability of investments in future resident care. Hence, the second hypothesis is that:
H2: The Medicaid payment rate at T1 is negatively associated with the percent of residents with physical restraints and positively associated with the RN hours per resident day at T2 and T3 among FP and NFP nursing homes.
Occupancy percent. At low occupancy there are fewer residents to account for fixed costs, so a greater proportion of patient revenue (payment for resident care) has to cover operating fixed costs (Holmes, Reference Holmes1996; Meiners, Reference Meiners1982). Lower occupancy implies greater dependence on a facility's revenue sources. The lower the occupancy rate then the less likely facility management will invest in resident care. So the third hypothesis states that:
H3: The occupancy percent at T1 is negatively associated with the percent of residents with physical restraints and positively associated with the RN hours per resident day at T2 and T3 among FP and NFP nursing homes.
Interaction effects
Interactions between percent Medicaid, Medicaid payment, and occupancy increase the plausibility of the theory that these variables relate to performance by affecting the discretion available in resource investments. This study focuses on two-way interactions.
Interaction between percent Medicaid and Medicaid rate at T1. At high percent Medicaid, Medicaid accounts for more of the revenue per resident day. Thus, the rate of growth in disposable income resulting from a higher Medicaid payment increases as the percent Medicaid increases. That is, a Medicaid payment increase gives a greater boost (relative to the baseline) to overall disposable income among facilities heavily dependent on Medicaid revenue. So the next hypothesis states that:
H4: A unit increase in Medicaid payment has a greater effect on decreasing restraint use and increasing the RN staffing ratio at T2 and T3 at a higher rather than lower percent of Medicaid residents.
At a fixed Medicaid payment, an increase in percent Medicaid has a greater effect on reducing disposable income when the Medicaid payment is lower rather than higher. Thus, we have the hypothesis that:
H5: A unit increase in the percent of Medicaid residents has a greater effect on increasing restraint use and decreasing the RN staffing ratio at T2 and T3 when the Medicaid payment is lower rather than higher.
Interaction between percent Medicaid and occupancy at T1. More funds for fixed-costs are taken out of per diem resident revenues at low occupancy. So the rate of decrease in discretionary income as the percent of Medicaid residents increases is greater at lower rather than higher occupancy. Therefore, we have the hypothesis that:
H6: A unit increase in the percent of Medicaid residents has a greater effect on increasing restraint use and decreasing the RN staffing ratio at T2 and T3 when the occupancy percent is lower rather than higher.
For a facility with a stable percent Medicaid, the rate of decrease in discretionary funds with a drop in occupancy depends on its percent Medicaid. At high percent Medicaid other revenue sources are not available to dampen the effect of a drop in occupancy. This relationship leads to the hypothesis that:
H7: A unit decrease in occupancy percent has a greater effect on increasing restraint use and decreasing the RN staffing ratio at T2 and T3 when the percent of Medicaid residents is higher rather than lower.
Interaction between Medicaid payment rate and occupancy at T1. Low occupancy results in less revenue for resident care just as an increase in percent Medicaid reduces revenue. At low Medicaid payments, the incremental decrease in disposable income when occupancy drops is greater than at a higher payment. We have the hypothesis that:
H8: A unit decrease in occupancy percent has a greater effect on increasing restraint use and decreasing the RN staffing ratio at T2 and T3 at a lower rather than higher Medicaid payment rate.
At a fixed occupancy percent, an increase in Medicaid payment has a greater effect on increasing disposable income at lower rather than higher occupancy. At lower occupancy, a rate increase frees up proportionally more patient revenue that was allocated to fixed costs. That is, a payment increase provides a greater boost (relative to the baseline) to overall disposable income at lower occupancy. This leads to the final hypothesis that:
H9: A unit increase in the Medicaid payment rate has a greater effect on decreasing restraint use and increasing the RN staffing ratio at T2 and T3 when the occupancy percent is lower rather than higher.
Data and methods
The main data sources were the Online Survey Certification and Reporting (OSCAR) system database maintained by the US Centers for Medicare and Medicaid Services (CMS) and the US Area Resource File (ARF) developed by the Bureau of Health Professions (2005). Facility and resident characteristics in OSCAR data are collected during Medicare/Medicaid certification surveys conducted at nursing homes periodically (usually between 12 to 15 months apart) to inspect compliance with standards for participation in the Medicare and Medicaid programs (CMS, 2004). Deficiency citations for noncompliance with standards are also recorded in the OSCAR data. Others have used OSCAR data to study nursing home performance (e.g., Castle, Reference Castle2000; Grabowski, Reference Grabowski2001; Grabowski and Hirth, Reference Grabowski and Hirth2003). The ARF was used for county-level demographic variables.
Panel data and variables
Nursing facilities with three consecutive surveys within the years 1999–2003 were selected from available OSCAR data, yielding data on 16,625 facilities. This time period fits the availability of Medicaid payment rates from 1999 through 2002 in Grabowski et al. (Reference Grabowski and Angelelli2004). The data from the first survey within this date range (the survey at T1) were used for the lagged variables as discussed below for the subsequent two surveys (at T2 and T3).
Restraint use. The recording of physical restraint use in OSCAR data is based upon the definition in the Long-Term Care Minimum Data Set (MDS) resident assessment instrument (CMS, 1998).Footnote 3 The dependent variable was the percent of residents with restraints at the time of the surveys at T2 and T3.
RN staffing. Staffing data in OSCAR are the number of full-time equivalents (FTEs) with an FTE equal to 35 hours per week (HCFA, 2000b). The FTEs were converted into hours per resident (patient) day (((RN FTEs*35 hours)/7 days)/number of residents). The dependent variable was the RN staffing ratio at the time of the surveys at T2 and T3.
Sample and edits. The study was on private facilities, so government-owned facilities (n = 1,128) were excluded. Hospital-based facilities (n = 1,504) were excluded because revenue allocation is different when part of a hospital. Cases with total reported beds greater than total certified beds (n = 2,262) had to be omitted because total residents recorded in OSCAR data are only residents in Medicare or Medicaid certified beds, excluding from the count residents in uncertified beds (CMS, 1998; US GAO, 2002b: 26); inclusion would have resulted in erroneous occupancy percents, percent Medicaid, percent restraint use, and RN staffing ratios.Footnote 4 Other edits applied are typically used to address data quality issues in OSCAR data, particularly the quality of staffing data (HCFA, 2000b; US GAO, 2002b). Other cases were excluded for the following reasons: (1) reported residents were greater than number of beds (n = 87); (2) there were less than ten beds (n = 3); (3) the occupancy percent ((total residents/total beds) × 100) was less than 40 (n = 206) to further address likely problematic recording of beds or residents; (4) there were more than 60% residents with restraints at any time (n = 151) to preclude bias of extreme values; (5) there were zero RNs but 60 or more beds (n = 101);Footnote 5 (6) there were four or more RN hours per resident day (n = 113), outlier cases of questionable validity (cf., HCFA, 2000b); (7) the profit status changed between any of the three surveys (n = 423) because models on profit status were constructed and studying changes in profit status was not the study focus; and (8) in the District of Columbia (DC), Alaska, and Hawaii (n = 41) – DC and Alaska because of extreme values for Medicaid payment, and Hawaii because a usable Medicaid rate was not accessible. After edits, data on 10,606 facilities were available for the analysis, yielding 21,212 observations in the panel data.
Risk-adjustment for case-mix. Risk-adjustment for resident characteristics at T2 and T3 included resident dependence on activities of daily living (ADL) and the percent of residents bedfast, with psychiatric diagnoses, and with dementia. Service complexity was represented in variables for the percent of residents receiving intravenous (IV) therapy, suctioning, and ostomy care (see CMS, 1998 for service definitions).
The ADL index was based upon three activities: eating, toileting, and transferring. For each activity, the number of residents within three levels of dependence recorded in OSCAR data was multiplied by 1, 2, or 3 with 3 representing the greatest need of assistance (Harrington et al., Reference Harrington2001). Summing the results across the three activities and dividing by the total number of residents yielded an index ranging from 3 (least dependence) to 9 (greatest dependence).
Facility structural characteristics. Variables were included to control for bed size, profit status (for-profit or not-for-profit), and chain ownership (chain-owned or non-chain).
Lagged variables for percent Medicaid, Medicaid payment, occupancy, and percent Medicare were the values on these variables at the time of the certification survey at T1. The lagged variables for the observations at both T2 and at T3 were the values at T1.
The lagged Medicaid payment variable used the average state per diem rates for freestanding facilities in the years 1999 through 2002 reported by Grabowski et al. (Reference Grabowski and Angelelli2004), standardized to 2002 dollars using the nursing facility input price index developed by Global Insight and used by CMS (Global Insight, 2005).
Including the percent of Medicare residents adjusts for case- and payer-mix across facilities, which may relate to restraint use and RN staffing as well as for any Medicare-related subsidizing of Medicaid costs, recognizing that the correlation between percent Medicaid and percent Medicare may reduce the effects of percent Medicaid in the models.
Market attributes. To control for area price differences and buying value in Medicaid payments, the historical annual area wage indices (based upon hospital data) available from CMS were linked to each case in the study database by year and the facility's Metropolitan/Non-Metropolitan Statistical Area code (CMS, 2006).
A greater number of nursing facilities in a market area may affect nursing performance (Norton, Reference Norton, Culyer and Newhouse2000). An index for market competition at the county level was calculated as the inverse of the number of nursing facilities in the county, constructed from the full OSCAR database (n = 16,625). Potential values of the index ranged from 0 to l, with a lower value indicating greater competition and a value of 1 a monopoly.
Analysts indicate that FP behavior may also be affected by the percent of NFPs in the market, a greater percent increasing competition on quality because NFP ownership is a signal of quality to consumers without any other information by which to judge quality (Grabowski and Hirth, Reference Grabowski and Hirth2003; Hirth, Reference Hirth1999). Another variable was constructed from the full OSCAR database to control for the percent of NFP facilities in the county.
Three other county-level demographics using the ARF were included as controls for other area attributes which may affect market competition: (1) the county-level percent of the population 65 years old and older, (2) the land area in square miles, and (3) the population density (population per square mile).
Facility performance position in the state. Performance in the certification inspection at T1 was included as a control variable. Facility performance may depend on other factors aside from Medicaid, occupancy, and any factors associated with profit status. For example, management competency in the use of resources obviously may affect performance whether FP or NFP. Results of a state inspection represents an evaluation of a facility's overall performance which likely reflects, in part, the combined effects of management abilities, competitive position, and past investments in resident care. That is, inspection results at T1 account for factors that may influence future performance separately from the influence of the financial properties of Medicaid and occupancy at T1 on disposable income and resource dependence.
Although state practices in certification surveys vary (Office of Inspector General, 2003), a variable can be constructed indicating the relative performance of a facility within a state. Deficiencies received during certification surveys are scored by surveyors from ‘B’ to ‘L’ depending on the scope (from isolated to widespread) and severity (from no harm to immediate jeopardy) of the deficiency (CMS, 2004). B deficiencies are the most minor citations – isolated events with no harm to residents. An L deficiency is the most serious deficiency, indicating immediate harm to most, if not all, residents in the facility. Deficiencies in between B and L represent different degrees of scope and severity. Some US states have adapted weighted deficiency schemes in nursing home report cards (e.g., Florida, 2007; Massachusetts, 2007).
Deficiencies at T1 were weighted (coded) from 1 to 11, 1 being the score for a B and 11 being the score for an L. A facility with a C deficiency and a D deficiency would have a weighted sum of deficiencies equal to 5 (2 + 3). The control variable, ‘ratio of weighted deficiencies’, is a facility's weighted sum of deficiencies at T1 divided by the state average weighted sum of deficiencies per facility. State averages were derived from analysis on all facilities in the full OSCAR database (n = 16,625).
Time of survey. Finally, a variable measuring the days between a base date (1 January 1999) and the date of a survey was included to control for any effects of time period.
Statistical analyses
Model estimation. Models on the panel data were estimated by generalized estimating equations (GEE) using SAS (SAS Institute, 2003). Models for restraint use were estimated for a negative binomial distribution with a log link function.Footnote 6 A negative binomial distribution is well-suited for dependent variables with overdispersion and a sizeable percent of zeros. Models for RN staffing were estimated for a normal distribution with an identity link function. The unstructured parameter for the correlations between repeated measures was used. GEE models or corrects for the correlation (within-subject dependence) across panels associated with unobserved parameters using iteratively reweighted least squares, at each iteration using the residuals to update the modeling of the correlation until there is convergence (i.e., until coefficients do not materially change between iterations) (Hedeker and Gibbons, Reference Hedeker and Gibbons2006; Liang and Zeger, Reference Liang and Zeger1986; Zeger and Liang, Reference Zeger and Liang1986). The result is estimation of a model in which prediction of response is related only to the covariates of interest (Hedeker and Gibbons, Reference Hedeker and Gibbons2006; Liang and Zeger, Reference Liang and Zeger1986; Zeger and Liang, Reference Zeger and Liang1986). Empirical (robust) standard errors are used in the GEE models. Reported also is the generalized score statistic in the contrast testing each variable's unique contribution to the model, i.e., a contrast between the model including the variable and a model with the variable omitted (coefficient = 0) (Boos, Reference Boos1992; SAS Institute, 2004). The marginal R2(Rm2) for GEE is also reported (Ballinger, Reference Ballinger2004; Zheng, Reference Zheng2000).
An assumption underlying the study framework is that facility performance is not due primarily to differences between FPs and NFPs related to a profit motive of FPs. Rather, responses of FPs and NFPs to market conditions, including the resource dependence related to Medicaid, affect performance in a similar manner. Models were estimated first on all facilities with a stepwise procedure to investigate this assumption. The first step included the binary variable for profit status but excluded the payer-related (Medicare and Medicaid) variables, occupancy, and area market attributes. The second step included the payer-related variables and occupancy percent. The third step included area market attributes. The weighted deficiency ratio was then included to estimate models with all the covariates for all facilities and, separately, for FP and NFP facilities.
Interaction effects. Interactions between percent Medicaid residents, Medicaid payment, and occupancy were studied using two-way cross-product terms. Separate models where estimated with each cross-product term the only interaction term modeled. The theoretical question is how the coefficient of one variable differs at different values of another variable. The sign and/or significance of a variable's coefficient may even differ across different values of another variable (Ai and Norton, Reference Ai and Norton2003). Interaction effects in the FP and NFP models were analyzed by centering the variables and recalculating the models with the centered variables. For example, to determine the effect of different values of occupancy on percent Medicaid residents, percent Medicaid was mean-centered and occupancy was centered around the value tested (e.g., subtracting 60 from each observation's occupancy value to obtain the coefficient of percent Medicaid at 60% occupancy) (Jaccard, Reference Jaccard2001; Jaccard and Turrisi, Reference Jaccard and Turrisi2003).
Analysis and results
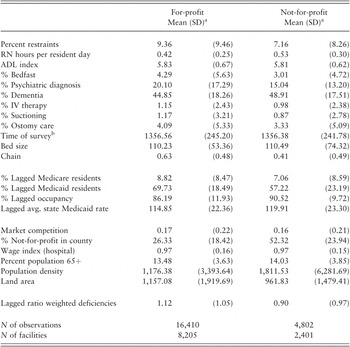
As shown in Table 1, FP facilities compared to NFPs have a lower average Medicaid payment, a greater percent of Medicaid as well as Medicare residents, and a lower occupancy percent (differences between FPs and NFPs significant at p<0.001). The lower percent Medicaid at NFPs does not appear to be an artifact of a greater Medicare utilization. The lower percent Medicare among NFPs suggests, when adding percent Medicaid and Medicare together, that NFPs have a greater percent of private–pay residents, around 35% compared to about 21% among FPs.

Notes a SD=standard deviation.
b Number of days from base date of 1 January 1999.
Main effects in models for all facilities
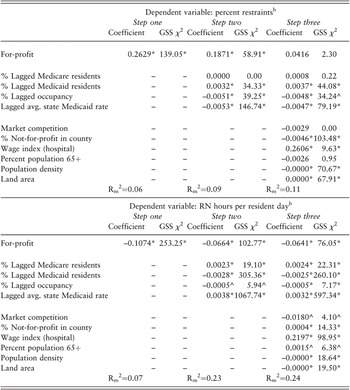
As shown in Table 2, the effect of FP status was substantially reduced when the Medicare, Medicaid, and occupancy variables were added to the models. The percent change in the coefficient for FP status in the prediction of restraint use with the addition of the payer-related and occupancy variables was –29%. The percent change in the generalized score statistic (GSS) χ2 was –58%.

Notesa Panel data with 21,212 observations on 10,606 facilities.
b The variables ADL index, % bedfast, % psychiatric diagnosis, % dementia, % IV therapy, % suctioning, % ostomy care, bed size, chain, and time of survey were included in all models although coefficients on these variables are omitted in the table. ^p < 0.05; *p < 0.01.
The percent change in the FP coefficient in the RN model when the payer-related and occupancy variables were added was –38% with a percent change in the GSS χ2 of –59%. The percent change in the Rm2 was 229%. The introduction of financially related variables substantially increased the prediction of RN staffing over the prediction by FP status alone.
With the addition of area market attributes, FP status was not statistically significant in the restraint model (Table 2). In the RN model, the effect of FP status was reduced further with the introduction of the market attributes, though the reduction was not as great as that associated with the payer-related and occupancy variables (Table 2).
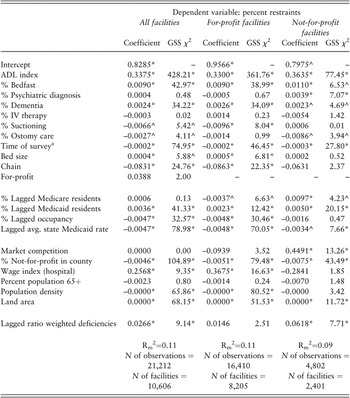
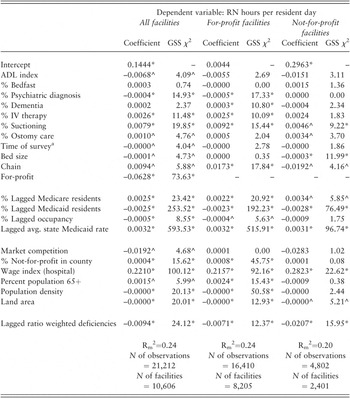
Among area market attributes, in the restraint model the percent of NFPs in a county had the strongest association with restraint use as indicated by the GSS χ2, whereas in the RN model the area wage index had the highest GSS χ2 (Table 2). A question is whether effects of these market attributes are isolated to FP behavior. Table 3a shows that FP and NFP facilities were more likely to have a decrease in restraint use when the percent of NFP facilities in the area increased.Footnote 7 NFP facilities also had higher restraint use when there were fewer nursing homes in the area (Table 3a). Table 3b shows that a higher wage index was related to a higher RN level among both FPs and NFPs. NFPs and FPs appear to respond similarly to many market constraints, which is a premise underlining the hypotheses regarding effects of percent Medicaid, Medicaid payment, and occupancy percent.

Notesa Number of days from base date of 1 January 1999.
^p < 0.05; *p < 0.01

Notes a Number of days from base date of 1 January 1999.
^p < 0.05; *p < 0.01
Main effects in for-profit and not-for-profit models
Findings in Tables 3a and 3b are consistent with Hypothesis 1. Restraint use increased and the RN staffing ratio decreased with increasing percent of Medicaid residents in both the FP and NFP models. Results also support Hypothesis 2. Restraint use was greater and the RN staffing ratio lower among FPs and NFPs when the Medicaid per diem payment at T1 decreased. Hypothesis 3 is not completely supported. Occupancy was only significant in FP models. The contribution of occupancy in the RN model appeared minimal and the effect was in the opposite direction predicted as it was for NFPs.
Interaction effects
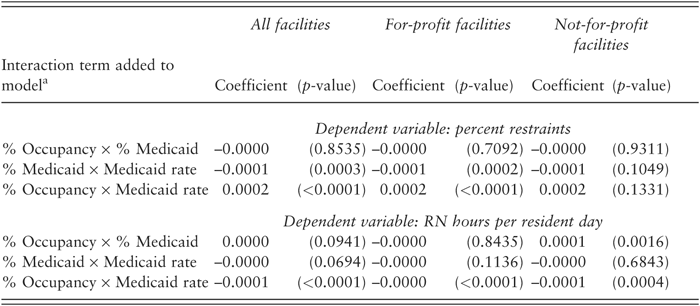
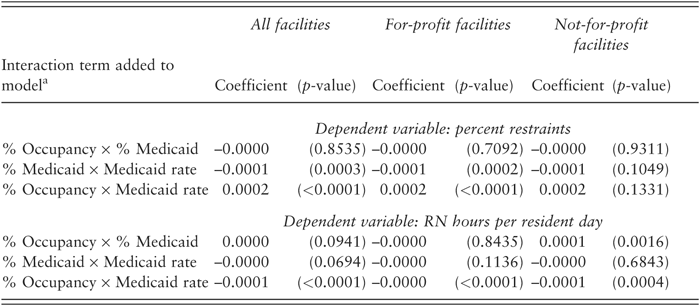
The interaction between Medicaid payment and occupancy had more statistically significant effects across the models than the other interactions (Table 4), including a significant effect in the NFP RN model, although the main effect of occupancy (Table 3b) was not significant. Table 5 contains results on the differences in coefficients on one variable in an interaction term at different values on the other variable in the term.
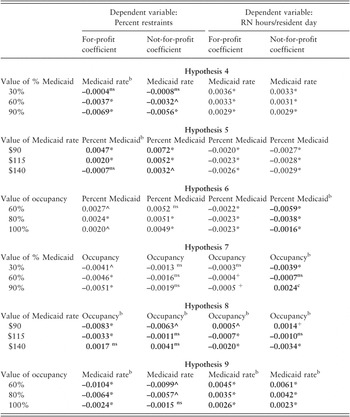
Medicaid payment and percent Medicaid. Findings in the restraint model support Hypotheses 4 and 5 (Table 5). An increase in Medicaid payment decreased restraint use the greatest at a high percent of Medicaid residents (90%). In the restraint model, as well, an increase in percent Medicaid increased restraint use the greatest at the lower Medicaid payment ($90) in both the FP and NFP models.

Notes: Bolded coefficients are findings consistent with the resource dependence framework underlying the hypothesis a All other independent variables in Tables 3a and 3b were included in the model for each interaction term.
b Interaction term significant at p < 0.05 (Table 3).
c p = 0.0100. ns = not statistically significant at p < 0.10.
+p<0.10; ^p < 0.05; *p < 0.01.
Percent Medicaid and occupancy. Only findings in the NFP RN model fit Hypothesis 6 (Table 5) where the decrease in RN staffing associated with an increase in percent of Medicaid residents was the greatest at the lower occupancy percent (60%).
Findings in the NFP RN model are consistent with Hypothesis 7, as well, in that only at a high percent Medicaid (90%) was a decrease in occupancy associated with a decrease in RN staffing (Table 5). At the lowest Medicaid census, a decrease in occupancy was actually associated with greater RN staffing.
Medicaid payment and occupancy. Findings in the restrain model are consistent with Hypothesis 8. A decrease in occupancy increased restraint use the greatest at the lowest Medicaid payment ($90) (Table 5). In the NFP model, in fact, the increase in restraints associated with decreasing occupancy is only significant at the lowest Medicaid payment.
Findings in the RN model are consistent with the resource dependence framework underlying Hypothesis 8. A decrease in occupancy is associated with a decrease in the RN staffing level at the lowest Medicaid payment ($90) (Table 5). The effect an occupancy drop had on decreasing the RN staffing ratio was, indeed, weaker at the highest Medicaid payment ($140) in that an occupancy drop at the highest payment was actually associated with an increase in the RN staffing ratio.
Findings support Hypothesis 9 (Table 5). An increase in Medicaid payment decreased restraint use the greatest at the lowest occupancy (60%), even in the NFP model where the interaction term was not significant (Table 4), which may relate to the finding that Medicaid payment was not significant at the highest occupancy (100%) (Table 5). In the RN model, a unit increase in Medicaid payment had the strongest effect on increasing RN staffing ratios at 60% occupancy in the FP and NFP models.
Discussion
Profit status may differentiate some operational properties among nursing facilities but the effects of percent Medicaid residents, Medicaid payment, and occupancy on performance quality were similar for FP and NFP facilities. Findings did not support all hypotheses completely, but the findings were consistent overall with the theory that these operational attributes affect performance by shaping the discretion in investing in the maintenance or improvement of resident care among both US FP and NFP nursing homes. Other researchers have found Medicaid payment and census related to resident outcomes and RN staffing in US nursing homes, but their analyses have not been stratified in detail by profit status (e.g., Castle, Reference Castle2000; Cohen and Spector, Reference Cohen and Spector1996; Grabowski, Reference Grabowski2001; Grabowski and Angelelli, Reference Grabowski and Angelelli2004; Harrington and Swan, Reference Harrington and Swan2003).
A contribution of this study is the stratified analysis comparing the effects of Medicaid payment along with percent Medicaid and occupancy among FPs and NFPs. Another contribution is the detailed inquiry into interactions between Medicaid utilization and occupancy, inquiry not conducted previously. Edits were required to omit cases with unusable data on freestanding facilities, which is a limitation in the quality of US national data on nursing homes. Nonetheless, interaction effects found may explain some of the variation in performance among both FP and NFP US nursing homes.
Occupancy alone was not a significant predictor of performance in NFP models and had a minimal effect in the FP RN model. Interaction effects suggest the effect of occupancy on subsequent performance depends on properties of Medicaid utilization. Facilities with lower percent Medicaid or greater Medicaid payment rates may be better able to weather the effects of decreases in occupancy, whatever the reasons for the decreases, to maintain or increase investments in resident care.
Findings in the RN models even offer a novel opportunity to understand the relationship of occupancy and Medicaid utilization to RN staffing levels. At high Medicaid payment, a decrease in occupancy was associated with higher RN levels. It is likely with more monies available with the greater payment rate, that maintaining the expenses of RNs already on staff was more feasible over the long run, although caring for fewer residents, which translated into higher RN hours per resident.Footnote 8 The same dynamics may apply to the effect of percent Medicaid on occupancy in the NFP model. At a low percent of Medicaid residents (30%) with other patient revenue sources available, there was less financial pressure to reduce RN staffing FTEs at lower occupancy. Conversely, with very high Medicaid dependence (90% Medicaid residents), fiscal pressure to reduce RN staffing FTEs was likely greater with a drop in occupancy.
The interaction between Medicaid payment and occupancy was the interaction most consistently significant across the models. The damage of lower occupancy on performance over time appears dependent on the generosity of the Medicaid payment rate.
Findings show US FP freestanding nursing facilities compared to NFP facilities have greater dependence on Medicaid, lower occupancy, and, as Table 1 reveals, are located in states with lower Medicaid payments, which may account for some of their greater unadjusted restraint use and lower RN staffing. Why may US FP facilities have these characteristics relative to NFPs?
Most residents in nursing homes are financed by Medicaid (Table 1) suggesting the market for private paying residents is smaller. Without other information to judge quality, NFP status, as theorists argue (Grabowski and Hirth, Reference Grabowski and Hirth2003; Hirth, Reference Hirth1999), is a sign of quality for private paying elders seeking nursing home care. Hence, NFPs attract more private–pay residents, which leaves FPs serving the Medicaid market and, with it, providing poorer quality. This poorer quality ends up being noted frequently in the popular press (e.g., Consumer Report, 2006; Reuters Health, 2001) as caused by the profit motives of FPs reinforcing NFP status as the best proxy for judging quality among the populace.
The effect of the FP variable in models unadjusted for payer and occupancy covariates was substantially reduced when percent Medicare, percent Medicaid, Medicaid rate, and occupancy were added (Table 2). The payer-related and occupancy variables accounted for most of the variation in the RN staffing level (Table 2). Findings also supported the premise that FP and NFP nursing homes have similar responses to market constraints.
In the RN model on all facilities FP status had a significant effect after introducing all covariates, although FP status was not significant in the restraint model. So profit motive may underline some of the poorer performance among FPs, even though not the major predictor of performance. O'Neil et al. (Reference O'Neill, Harrington, Kitchener and Saliba2003) found in their study on California nursing facilities that FP facilities in the upper quartile of profit margins, the highest margins, had poorer performance in resident care than other FP facilities. Not all FPs apparently had the same profit motive. Because FP facilities were more dependent on Medicaid revenues, the minority of FP facilities making extensive profits may have been unable to alter their revenue stream, not in the manner NFPs could, to invest more in resident care. But this issue did not apply to most FPs, since most apparently did not have excessive profits. Conceivably, a minority of FPs – those with the highest net incomes – may account for profit status being significant in the RN model. O'Neil et al. (Reference O'Neill, Harrington, Kitchener and Saliba2003) also found that some NFPs had high net income, but with less dependence on Medicaid, their net income seemingly did not come from lower investments in resident care. If these NFP facilities had been more dependent on Medicaid revenues, would the results have been different?
Harrington et al. (Reference Harrington, Woolhandler, Mullan, Carrillo and Himmelstein2001: 1455), noting the vulnerability of nursing home patients, conclude from their finding of poorer quality in US FP facilities that ‘it is unwise to entrust such vulnerable patients to profit-seeking firms’, implying that quality would improve markedly by a policy eliminating FP establishments (cf., Harrington et al., Reference Harrington, Cassel, Estes, Woolhandler and Himmelstein1991: 3023, where a national US long-term care program is proposed in which ‘(f)or-profit providers would be compensated for past investments and phased out’). With their ability to augment revenue with funds from endowments and charitable fundraising, the role of NFPs seems secure (cf., Edwards, Reference Edwards2002). Results here, however, show NFPs are subject to some of the same operational dynamics as FP nursing homes that relate to the extent of disposable income for resident care (also see Konetzka et al., Reference Konetzka, Norton, Sloane, Kilpatrick and Stearns2006). With the elimination of FPs all the constraints of Medicaid utilization and differential occupancy, presently absorbed primarily by FPs, would then rest under the auspice of NFPs. Even assuming no profit motive, with NFPs the only nursing homes established to meet demand, particularly Medicaid demand, then the quality of resident care under the auspices of NFP ownership might be worse than presently possible in the smaller market share of current US NFPs – at least, according to the findings, that performance quality among facilities in this study related to restraint use and RN staffing.
We studied two important dimensions of resident care, restraint use and RN staffing, and provided an analysis of main and interaction effects stratified by FPs and NFPs. Additional research may study other dimensions of resident care to discern their sensitivity to effects of Medicaid and occupancy. Results indicate that any profit maximizing by FPs is likely not the only, nor the major, factor determining resources invested in resident care. Understanding the complexity of factors affecting resources expended on resident care may further our understanding of the production of quality care in nursing homes whether in the US or elsewhere. Findings suggest that further attention to operational factors such as occupancy and payment-related attributes (such as percent Medicaid and Medicaid payment in the US) – and to the understudied interaction between such factors – seems one appropriate focus in future research on nursing home performance in resident care.
Acknowledgements
The views presented in this paper are those of the author and do not necessarily reflect those of the government agency or its officials. The author thanks Robin Remsburg, Jennifer Madans, and Irma Arispe, as well as the reviewers of Health Economics, Policy and Law, for their comments on earlier versions of the manuscript.