Many qualities of smear soft cheeses (flavour, naturalness, or maturity) are judged by their colour by consumers, and therefore colour appears to be a main marketing characteristic. Moreover, unexpected colour could compel a consumer to leave a cheese on the store shelf. French producers of Protected Designation of Origin (PDO) bacterial surface-ripened cheeses (Epoisses, Livarot, Munster, or Reblochon) have described the range of an acceptable colour. It varies from a light orange (Reblochon) to an orange-brown (Epoisses, Livarot, and Munster).
The cheese colour is due to the development of a surface microflora (Eliskases-Lechner & Ginzinger, Reference Eliskases-Lechner and Ginzinger1995a, Reference Eliskases-Lechner and Ginzingerb), generally composed of yeasts and surface-bacteria, especially Brevibacterium linens. It is generally admitted that this orange range is due to the synthesis of pigments by surface–ripened bacteria of the smear (Guyomarc'h et al. Reference Guyomarc'h, Binet and Dufossé2000) but only Brevi. linens has really been studied. Indeed, it has been shown that the red colouring of Brevi. linens group is due to the enzymatic synthesis of three aromatic carotenoid pigments (Krubasik & Sandmann, Reference Krubasik and Sandmann2000) but little is known about the influence of curds or other microorganisms of the smear on colouring capacity (Reps, Reference Reps and Fox1993; Galaup et al. Reference Galaup, Flamin, Carlet and Dufossé2005). Moreover, Galaup et al. (Reference Galaup, Flamin, Carlet and Dufossé2005) have shown that in defined synthetic media, two groups of bacteria are able to produce pigments. The first is the Brevi. linens group, well known to produce orange pigments, and used by the cheese industry for its colouring and its aromatic production capacities. The second is composed of various taxonomic groups (Kocuria rhizophila, Arthrobacter arilaitensis or Arth. nicotianeae, Microbacterium gubbenense, or Corynebacterium casei) which produce a yellow colour. The presence of these bacteria had already been established. However, Galaup et al. (Reference Galaup, Gautier, Piriou, de Villefranche, Valla and Dufossé2007) have shown that there is limited knowledge about how the second group is able to produce the yellow pigments and how they really impact cheese colour. To pursue investigations along these lines, Dufossé et al. (Reference Dufossé, Galaup, Carlet, Flamin and Valla2005) have proved the suitability of CIE L*a*b* spectrocolourimetry (1) to describe the colour of the rind of various PDO cheeses, (2) to observe the relative heterogeneity for “on shelf cheeses” colour in a specific range of PDO colour, (3) to assess the colour development on the surface of cheese versus ripening time, and (4) to screen pigmented bacteria strains isolated from red-smear cheese rinds (biodiversity criteria).
The colouring phenomenon is all the more complex because some interactions between the microorganisms in the smear may occur. Indeed, Bockelmann et al. (Reference Bockelmann, Fuehr, Martin and Heller1997) have shown that the colouring capacity of the Arthrobacter strain depended on the amino acid and caseinate composition of milk media. Studying the brown discolouration of ewe cheese surfaces, Carreira et al. (Reference Carreira, Paloma and Loureiro1998) have shown that an extracellular brown pigment was produced by some strains of Yarrowia lipolytica from tyrosine when the surface pH was higher than 7·0 and a red-brown pigment was released by some Debaryomyces hansenii strains from resorcinol. Brown pigment production by yeasts has also been implicated in the browning of Camembert cheeses (Carreira et al. Reference Carreira, Dillinger, Eliskases-Lechner, Loureiro, Ginzinger and Rohm2002). External factors such as pH, light, and NaCl contents can also have an effect on colouring capacity of some bacteria (Guyomarc'h et al. Reference Guyomarc'h, Binet and Dufossé2000; Leclercq-Perlat et al. Reference Leclercq-Perlat, Corrieu and Spinnler2004b; Masoud & Jakobsen, Reference Masoud and Jakobsen2003; 2005). Leclercq-Perlat et al. (Reference Leclercq-Perlat, Corrieu and Spinnler2004a) have shown that colouring capacity of Brevi. linens depended on the yeast used to deacidify the curd and they have suggested that indirect interactions between the given yeast and the bacterium were due to changes in composition of the cheese-based medium during deacidification by the yeast. Recently, Galaup et al. (Reference Galaup, Flamin, Carlet and Dufossé2005) have shown that physical and chemical parameters (temperature, lightness, dissolved oxygen, pH) and culture medium composition play a role in bacterial development and pigment production. In the case of Brevi. aurantiacum ATCC9175, it is known that pigmentation production does not depend on the synthetic medium (Dufossé et al. Reference Dufossé, Mabon and Binet2001; Guyomarc'h et al. Reference Guyomarc'h, Binet and Dufossé2000). It is not known if all this is true in the case of a cheese-based medium.
Given this context, we asked if the colouring capacity of a given bacterial strain depends on a given smear cheese curd. The long term objective is to know if it is possible to formulate a defined ripening starter to obtain a given colour with curds produced from different technologies. Therefore, we monitored the development of bacterium colour on the surface of a cheese medium made of four characteristically different French PDO smear cheeses after deacidification by a yeast strain (Debaryomyces hansenii). The colour of the bacterial biofilms was analyzed with the L*a*b* system after 28 d incubation under controlled ambient conditions.
Material and Methods
Biological material and preparations of cultures
Debaryomyces hansenii (strain 304, LGMPA collection, Grignon, France), Arthrobacter sp. (strain C99, LGMPA, noted AS), Brevi. linens (strain C208, LGMPA, noted BL) and Brevi. aurantiacum (ATCC 9175; noted BA) were used.
The operations involved in yeast and bacterium preparation as well as their numeration were carried out under sterile conditions following previous studies (Leclercq-Perlat et al. Reference Leclercq-Perlat, Corrieu and Spinnler2004a).
Cheese medium preparation
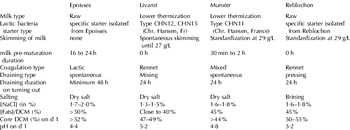
Munster-type, Reblochon-type, Livarot-type and Epoisses-type cheese curds at the end of the drying phase were used to prepare the model medium. Munster-type cheese curds were obtained from an industrial factory, Coopérative Agricole Laitière (BP2; 54450 Blâmont, France). Reblochon-type curds were obtained from the Syndicat Interprofessionnel du Reblochon (74230 Thones, France), and Livarot and Epoisses curds were obtained, respectively, from the Syndicat de défense du Livarot (14140 Livarot, France) and the Syndicat de Défense de l'Epoisses (21460 Epoisses, France). The PDO deacidified media were abbreviated to EDM, LDM, MDM and RDM for Epoisses, Livarot, Munster and Reblochon deacidified medium, respectively. After the molding, the curds were neither salted nor seeded with ripening flora. On d1 of their production, they were frozen at −80°C to prevent enzymatic reactions, and kept frozen for less than 6 months. The main cheese-making differences of these four PDO curds are given in Table 1.
Main technological characteristics used during the cheese-making of four French PDO cheeses. DCM, Dry cheese matter (in g/100 g wet cheese)

According to Leclercq-Perlat et al. (Reference Leclercq-Perlat, Corrieu and Spinnler2004a), each model cheese medium was prepared in two steps: (1) a biological deacidification with Deb. hansenii was used to ensure the same minimum pH, equal to 5·8, necessary for the growth of the three given bacteria. After incubation of the cheese medium, it was pasteurized to kill all yeast cells (80°C; 10 min.), and (2) one strain of bacterium was seeded on each deacidified cheese medium surface. All stages of this preparation were carried out according to Leclercq-Perlat et al. (Reference Leclercq-Perlat, Corrieu and Spinnler2004a).
Three independent trials were carried out under these conditions. For each trial, three control Petri-like dishes were not seeded with bacterium and were used as a reference sample for colour and sterility (hereafter referred to as the reference). Three Petri-like dishes seeded with each bacterium were sampled for analytical purposes on d14 and d28.
Analysis of bacterial biofilms
The bacterial biofilms were divided into four equal parts and analyzed for viable bacterial cell concentrations, pH and colour (L*C*hab spectrocolourimetry) measurements as previously described by Leclercq-Perlat et al. (Reference Leclercq-Perlat, Corrieu and Spinnler2004a).
Statistical analyses
The repeatability of the measurements was tested by a two factor (medium, strain) analysis of variance (ANOVA) performed with the Statistica 6.0 software (Statistica, Statsoft, 94 Maisons-Alfort, France).
When comparing the viable cell counts, pH, and colour parameters, the significance of the given factor was estimated by calculating the F-value and the probability (P) that the means were equal according to a α risk of 1%.
Results
Deb. hansenii deacidification kinetics
For Livarot, Munster, and Reblochon, the lag phase before growth ended at 24 h. Afterwards, and until 120 h, the pH increased up to 7·0 at a mean rate of 0·025±0·001 pH units.h−1. After 120 h, it raised slowly, and after 150 h, it remained constant at 7·3±0·2. For Epoisses, the lag phase ended at 36 h. During the exponential phase, the pH increased up to 5·8 at a mean rate of 0·013±0·001 pH units.h−1. After that, it remained constant around 6·0±0·2. Consequently, the time necessary to achieve pH of 5·8±0·1 by incubation with Deb. hansenii was 70±2 h for Epoisses, 48±1 h for Livarot, 68±1 h for Munster, and 66±1 h for Reblochon. Though the same yeast strain had been used for all media, these differences clearly showed the impact of the curd on pH changes.
Analysis of bacterial biofilms
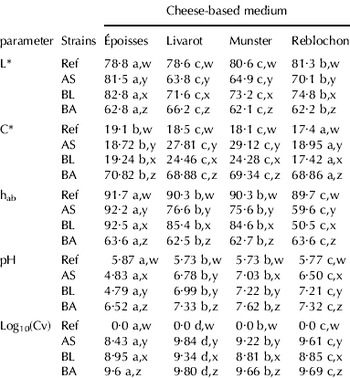
Whatever the deacidified media (DM) and whatever the incubation time, the different measurements in pH, viable bacterial concentration and colour parameters obtained for the reference (non-seeded medium) were statistically independent of the given cheese curd (on d 28, Table 2).
Lightness (L*), saturation (C*), hue angle (hab), pH, and decimal logarithm of viable bacterial concentration (CFU⋅cm−2), and their statistical groups (two factor ANOVA), in relation to curd DM for three bacteria and none-seeded deacidified media on d 28 (incubation, 12°C, 93% relative humidity). This Anova was performed by X=Xm+a.strain+b.medium+c.strain.medium+ε. Xm, average value of parameter. a, b, c, and d, anova groups of DM. w, x, y, and z anova groups of strain

Ref, none-seeded medium; AS, Arthrobacter species (C99); BL, Brevibacterium linens (C208) and BA, Brevibacterium aurantiacum (ATCC 9175).
For pH and viable bacterial concentrations as well as colour (L*, C* and hab) of biofilms, no significant differences between trials were observed (CV <5%). Thus, to study the evolution of the dynamics in relation to deacidified media and incubation time, the averages were compared.
Surface pH values, viable bacterial concentrations, and colour measurements of biofilms were a lot less differentiated on d 14 than on d 28. Thus, only the colour changes in bacterial biofilms on d 28 were studied.
Changes in pH of bacterial biofilms
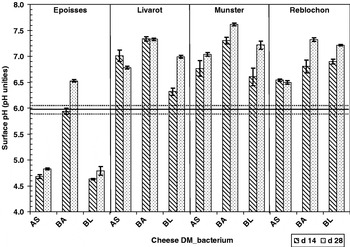
Figure 1 shows the pH evolution of bacterial biofilms in relation to deacidified media (DM) and incubation times (d14 or d28, 12°C, 93% relative humidity). For Livarot, Munster, and Reblochon DM with AS and BL, pH significantly increased between d 0 and d 14. For the Epoisses AS and BL biofilms, pH dropped over the first fortnight of growth. Therefore, overall, the dynamics in pH evolved significantly over time. More precisely, between d 14 and d 28, there were three types of evolution in the pH dynamics: (1) the surface pH remained constant (MDM_AS and LDM_BA); (2) pH increased between d 14 and d 28 (the majority of associated DM and bacterium); and (3) pH slightly decreased (LDM_AS). In fact, for EDM_AS and EDM_BL, on d 14, the pH (4·7±0·1) was lower than the one on d 0 (pH=5·8). From d 14 to d 28 it increased a little (close to 0·2 pH unity) but it remained lower than the minimal pH of growth for these two bacteria. This suggests that for these two bacteria, the Epoisses DM did not provide the necessary growth factors.
Changes in surface pH of cheese deacidified media (in pH unities) after d 14 and d 28 of incubation (12°C; 93% of RH). BA, Brevibacterium aurantiacum; AS, Arthrobacter species; BL, Brevibacterium linens. E, Epoisses; L, Livarot; M, Munster, and R, Reblochon. The line at pH 5·8 corresponds to the curd pH after yeast growth and pasteurization. The dot lines over and below gives the range of pH in which bacterial were seeded.

The changes in pH during bacterial biofilm growth on the various DM appeared to depend on the cheese curds (Fig. 1; Table 2). Given all the strains considered, the EDM had the lowest pH. For the others, there was a significant increase in pH. In the case of MDM, it increased the most (by 1·17 units).
Deb. hansenii was able to efficiently deacidify the 4 curd types and enables the inoculation of different bacteria at a constant pH of 5·8. For each reference DM, on d 28, the pH and the colour (C* and hab) were the same, the growth of Deb. hansenii did not change the colour of the cheese medium. The heat treatment of the DM killed Deb. hansenii and consequently, the following results are only due to the interaction between the curd chemical composition and the bacteria cultivated onto the curd medium. LDM, RDM and MDM are able to raise the pH quickly and are produced from a curd dominantly obtained by the action of rennet and which consequently has a high pH at draining. They loose less of the minerals at draining and a higher proportion of caseins stayed charged in EDM. Due to these features, these curds probably have a higher buffer capacity in EDM and may explain differences in pH changes observed.
Microbial changes in bacterial biofilms
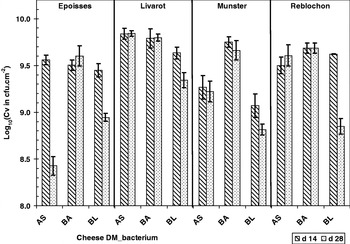
Figure 2 shows the evolution of viable bacterial concentrations in relation to the cheese deacidified medium and incubation time (12°C, 93% RH). Whatever the curd, all the bacteria had finished their growth on d 14. There were small changes in the growth on cheeses of these bacteria, except for BA, which presented a similar result (Lelcercq-Perlat et al. Reference Leclercq-Perlat, Oumer, Bergère, Spinnler and Corrieu2000). There were two types of evolution in dynamics: (1), no significant change in cell concentration was observed between d 14 and d 28, or (2), the concentrations determined on d 28 were significantly lower than the ones obtained on d 14. The growth of the BA strain depended less on the medium than the other strains (log in CFU⋅cm−2 varied between 9·6 (Epoisses) and 9·8 (Livarot)).
Changes in decimal logarithm of bacterial viable cell concentration (in cfu/cm2) after d 14 and d 28 of incubation (12°C; 93% of RH). BA, Brevibacterium aurantiacum; AS, Arthrobacter species; BL, Brevibacterium linens. E, Epoisses; L, Livarot; M, Munster, and R, Reblochon.

The cell concentration of AS on d 28 was the most sensitive to DM composition whatever the curd. It had the lowest concentration (log CFU⋅cm−2=8·4 on EDM). This value was lower than the one observed at the same time and on the same medium with BA (9·6 CFU⋅cm−2) (Table 2). But this strain AS behaved in much the same way as BL.
BL always had the lowest population on d 28. The growth of BL on d 14 was high on any of the curd medium (even on MDM the population was upper than 109 cfu⋅cm−2) but the viable bacterial concentration fell from d 14 to d 28. If in all the DM the viable population significantly decreased between d 14 and d 28, EDM and RDM, provoked the strongest drop in BL viable population. Here it is pure cultures. There are no direct interactions with other microorganisms, contrarily to what happens in cheese. Consequently, the origin of this population decrease should be researched in abiotic factors such as limitations in nutrients, pH level, and toxicity of metabolites produced by the strain studied.
For EDM, the low surface pH may lead to the drop in population after d 14. The pH was lower than the required minimum pH for growth (Corsetti et al. Reference Corsetti, Rossi and Gobbetti2001; Bockelmann et al. Reference Bockelmann, Willems, Neve and Heller2005; Irlinger et al. Reference Irlinger, Bimet, Delettre, Lefèvre and Grimont2005). The absence of enough growth factors (Corsetti et al. Reference Corsetti, Rossi and Gobbetti2001) and/or the low mineralization of the EDM were factors that may explain this. On d 28, with BA, although the mean pH of LDM and RDM was the same, the viable population was higher for LDM than for RDM. Therefore, the pH was not sufficient to explain the difference.
In EDM, the drop in pH between d 0 and d 14 could be a reason for the strong drop in population (Rattray & Fox, Reference Rattray and Fox1999), but it is not the case for RDM. EDM and RDM are the media with the highest fat levels and so they could contain the highest level of free fatty acids, which are well known to have strong antimicrobial activities. In EDM, which has a low buffer capacity, FFA could also be the origin for both the drop of pH (before d 14) and the drop of viable population. As RDM has the highest buffering capacity, a change in FFA within this medium could affect viable population without changing the pH. In all the curd DM, the drop in population between d 14 and d 28 was associated with a raise in pH. The liberation of ammonia associated to cell lysis is common (Boyaval et al. Reference Boyaval, Boyaval and Desmazeaud1985) and would consequently cause a raise in pH.
Colour changes in bacterial biofilms
Lightness evolution (L*)
The lightness values L* of the bacterial biofilms on d 28 are shown in Table 2. It varied between 82–83 (EDM_BL or EDM_AS) and 62 (MDM_BA and RDM_BA). No matter the DM in the case of BA, L* had low values and they were in the same statistical group involving the darkest colours. Except for EDM_AS and EDM_BL, each biofilm was blacker than the reference. BA gave the blackest colours, though AS and BL were the whitest. When considering the type of curd, LDM gave rise to the blackest colours followed by the RDM and the MDM. The EDM giving the white colour except when BA was used.
Metric saturation evolution (C*)
The saturation values C* of the bacterial biofilms on d 28 are provided in Table 2. In these experiments, on d 28, whatever the cheese DM, the biofilm saturation values of Brevi. aurantiacum (BA) were high (mean value of C* close to 69·5), corresponding to an intense dark colour. Indeed, Dufossé et al. (Reference Dufossé, Galaup, Carlet, Flamin and Valla2005) have shown that a C* value higher than 50 are seen as very dark by human. The mean value of the colour saturation was the lowest with BL (21·4). AS colour saturation fell within an intermediate range with a C* value of 23·7 and it was the strain most sensitive to the type of curd: more than 10 units separated EDM_AS from MDM_AS.
EDM biofilm saturation had the lowest mean value, corresponding to a light colour. Mean values of LDM and MDM colour intensities were significantly higher than the reference ones. For these two cheese DM, the BL biofilm C* was roughly 24·5 while the AS biofilm C* was roughly 28, corresponding to a medium colour intensity.
Hue angle evolution (hab) (Table 2)
On d 28, whatever the cheese DM, the hab values of the Brevi. aurantiacum (BA) biofilms were very similar to each other and were about 63°, corresponding to an orange colour. Brevi. linens (BL) had the highest hab mean value (78·2) but it also showed a large sensitivity to the curd (between 50·5 (RDM) and 92·5 (EDM)). Strain AS did not produce a regular hab: it varied between 59·6° (RDM, orange) and 92·2° (EDM, yellow) with a mean value of 76·0°. For RDM, hab varied from 50° (RDM_BL) to 64° (RDM_BA) corresponding to a range of colour from red-orange to orange colour. For EDM, except for BA, the hab was nearly the same as the reference one (corresponding to yellow) which was understandable because of the low number of viable cell bacteria on the cheese curd. For MDM and LDM, the hue angle of the AS and BL biofilms ranged from a yellow to a lemon-yellow colour.
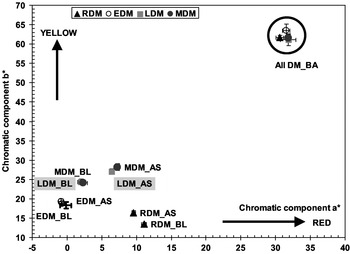
A stable colour is provided by the high pH which permits the colonization of a cheese surface with a high bacterium surface density (Masoud & Jakobsen, Reference Masoud and Jakobsen2003). On d 28 pigmentation tests of BA on the curd DM surface revealed that its biofilm colour (noted by L*, C* and hab) appeared not to depend on the given curds (Table 2; Fig. 3). In all cases, BA produced a dark orange-brown colour. This result suggests that (1) even if the metabolites consumed or produced during the deacidification were different, their impact on the colour of the BA biofilm was negligible, and (2) the viable concentration as well as the biochemical composition changes in DM but did not influence the pigment expression of this bacterium. It has been shown on synthetic media and on cheese-based media that the specific pigment production by BA is not very dependant on the environmental conditions (Galaup et al. Reference Galaup, Gautier, Piriou, de Villefranche, Valla and Dufossé2007). Moreover, Dufossé et al. (Reference Dufossé, Mabon and Binet2001) have shown that a specific production of carotenoids by Brevibacterium species can be predicted according to the following equation: Y=0·0297 C* −0·1357. Applying this model, carotenoid production on d 28 was 1·97±0·04 for the EDM and 1·91±0·03 mg/g DM for the other DM. Therefore, the quantity of pigments produced by this bacterium may not depend on the curd. In this experiment, the colouring capacity of BA proved to be suitable in the case of Epoisses, Livarot, and Munster, but not in the case of Reblochon for which the colour was too dark.
Color scheme of bacterial biofilms in relation to cheese deacidified media on d 28 (incubation 12°C; 93% of RH). DM, deacidified medium.

The colour observed with BL can be explained by its lower population level with BL. Indeed, in the case of the RDM, this strain produced a red-orange colour (hue=50·5) while on EDM the hue was no different from the reference, suggesting that the medium composition impacted on the colour development of this BL culture. This could be explained by the quantity of pigments produced as shown by Dufossé et al. (Reference Dufossé, Mabon and Binet2001) . On d 28, the carotenoid level was calculated to be 0·43±0·02 mg/gDM for the EDM, 0·59±0·02 mg/gDM for both MDM and LDM, and 0·38±0·01 mg/gDM for the RDM. This result can also explain the observed differences in the Brevi. linens colouring capacity, which provided a colour suitable for Reblochon, but not for the other three smear cheese curds.
In the case of RDM, both AS and BL provided a colour that fell within the light orange range, suitable for Reblochon. The phenomena of bacterial colouring capacity are complex. This work provides first clues of colouring capacity of three bacterial strains; depending on a given curd used as models representing four characteristically different cheese technologies. It has clearly shown that colour is not a simple expression of a viable population concentration but more the effect of an ecosystem. Moreover, each component of colour could behave differently in terms of microbial population and environmental parameters. This would explain why AS provided a suitable colour in case of the Reblochon but not in the other cases. Previously, Lecocq & Guéguen (Reference Lecocq and Guéguen1994) and Lecocq et al. (Reference Lecocq, Guéguen and Coiffier1996) have shown that the variations in the appearance of cheeses issued from different factories are due to the effect of strains and the interactions between the given microorganisms. However, the interactions involved in this study are only due to differences in the curd DM composition and not to biological direct interactions between the yeast and the bacteria. The colour differences observed here suggest that, the medium environment before deacidification or due to Deb. hansenii activities of these four curds are sufficiently different to give different population behaviours but also give different colouring functionalities with the same population level.
Conclusion
Some strains such as BA are insensitive to the DM composition as soon as the pH is over 5·8. This strain is particularly interesting because it was able to produce colour on the four different curds tested. With all the other strains, the results have clearly shown that the colour production depends on the type of curd. This work clearly shows that there are indeed interactions between a given strain and curd that could be attributed to the different characteristics of the cheese curds. At present, growth tests are definitely necessary to evaluate colouring capacity on a given cheese DM. The present method connecting strains and curds is efficient in eventually formulating a defined ripening starter, able to produce a biofilm with a given colour, on a defined curd. With the exception of BA which was well adapted, the lactic curds being the more difficult to colonize, were also the ones where the choice of bacterial strains were the more restricted. On mixed curd deacidified medium (Munster), AS looked like it was the more efficient in giving a dark colour.
This work was supported by the French Research Ministry (ACTIA contract n°02.11). The authors thank Mme Stahl (AERIAL, Strasbourg, 67), Mme Denis (ADRIA-Normandie, Villers le Bocage, 14), M. Mathieu (ITFF, La Roche sur Foron, 74), and M. Thibault (CRIT2Abi, Dijon, 21) for their contributing discussions. We are grateful to Mme Tanis-Plant for discussions and thorough editorial advice in English.