INTRODUCTION
Temperature is a key environmental factor regulating both the rate of development and growth of crops (Evans Reference Evans1975; Slafer & Rawson Reference Slafer and Rawson1994). Thus, the statement that global change seems to be unavoidable, regardless of efforts to reduce the emission of greenhouse gases (Parry et al. Reference Parry, Canziani, Palutikof, van der Linden and Hanson2007), implies uncertainty for the future of agriculture, since the main changes expected globally are increase in average temperature and atmospheric CO2 concentration, and rainfall variation (Asseng et al. Reference Asseng, Cao, Zhang, Ludwig, Sadras and Calderini2009). It has been projected that the increase in temperature will have a negative impact on crop production (Trnka et al. Reference Trnka, Dubrovský, Semeradova and Zalud2004; Porter & Semenov Reference Porter and Semenov2005), whereas an increase in atmospheric CO2 concentration could have a positive effect that could compensate for higher temperatures. However, evidence supporting compensation through increased photosynthesis is controversial, especially taking into account that a number of studies showing compensation used CO2 concentrations higher than those projected by current rates of CO2 increase (1·9 ppm/year; Rosenzweig & Parry Reference Rosenzweig and Parry1994; Batts et al. Reference Batts, Wheeler, Morison, Ellis and Hadley1996; Wheeler et al. Reference Wheeler, Batts, Ellis, Hadley and Morison1996; Tubiello et al. Reference Tubiello, Amthor, Boote, Donatelli, Easterling, Fischer, Gifford, Howden, Reilly and Rosenzweig2007; Giannakopoulos et al. Reference Giannakopoulos, Le Sager, Bindi, Moriondo, Kostopoulou and Goodess2009). This may have resulted in overestimation of the positive effects of increased CO2 (Kimball et al. Reference Kimball, Kobayashi and Bindi2002; Long et al. Reference Long, Ainsworth, Leakey and Morgan2005). Further, several experiments have consistently shown that relatively small changes in average temperature have a large effect on the crop productivity, compared with those produced by doubling the concentration of CO2 (Batts et al. Reference Batts, Wheeler, Morison, Ellis and Hadley1996; Wheeler et al. Reference Wheeler, Batts, Ellis, Hadley and Morison1996; Cheng et al. Reference Cheng, Sakai, Yagi and Hasegawa2009; Kim & You Reference Kim and You2010). Therefore, it is necessary to improve understanding of crop responses to temperatures above those of the present day to have a picture of future constraints to be faced in different cropping areas.
In Chile, wheat is the most extensively grown crop and 0·8 of the wheat-harvested area (between 37 and 40°S, Odepa 2010) is characterized by a high yield potential (Sandaña et al. Reference Sandaña, Harcha and Calderini2009), mainly due to favourable temperature conditions. Consequently, the two key environmental characteristics accounting for the high grain yield obtained in this area (i.e. high photothermal quotient at and around flowering and favourable temperature for grain growth) would be affected by increasing temperatures. Moreover, the temperature is expected to increase at the end of spring and during the summer (November–February in the southern hemisphere; Rosenbluth et al. Reference Rosenbluth, Fuenzalida and Aceituno1997; Parry et al. Reference Parry, Canziani, Palutikof, van der Linden and Hanson2007). Therefore, the increase in temperature will affect the most important environmental characteristic at key phenophases for grain crops such as wheat grown in the central-southern area of the country.
Global projections estimate that the average global temperature will increase between 1·7 and 4·9 °C towards the end of the 21st century (Wigley & Raper Reference Wigley and Raper2001). In addition to the increasing mean temperature, higher frequencies of extreme temperature events (Wigley & Raper Reference Wigley and Raper1992; Easterling et al. Reference Easterling, Horton, Jones, Peterson, Karl, Parker, Salinger, Razuvayev, Plummer, Jamason and Folland1997; Porter & Gawith Reference Porter and Gawith1999; Parry et al. Reference Parry, Canziani, Palutikof, van der Linden and Hanson2007) and faster increases in daily minimum temperature (Easterling et al. Reference Easterling, Horton, Jones, Peterson, Karl, Parker, Salinger, Razuvayev, Plummer, Jamason and Folland1997; Nicholls Reference Nicholls1997; Vose et al. Reference Vose, Wuertz, Peterson and Jones2005; Lobell & Field Reference Lobell and Field2007) are also expected. The temperature increase projected for central-southern Chile is between 1 and 4 °C by 2100 under moderate and severe gas emission scenarios, respectively (Department of Geophysics – University of Chile, 2006). At present, average annual temperature in the area from 37° to 40° S in Chile ranges from 18 to 11 °C. Therefore, the expected average temperatures would increase to 22–15 °C, with implicit negative consequences for wheat cropping systems. However, the impacts of higher temperature on wheat yield grown in the central-southern area of Chile have not been assessed under field conditions and the likely impact has only been estimated by simulation models (Meza & Silva Reference Meza and Silva2009).
Experimental assessment of the effects of higher temperatures on wheat under field conditions is necessary because simulation models do not consider the key period of the pre-anthesis phase for grain weight determination (Calderini et al. Reference Calderini, Abeledo, Savin and Slafer1999; Ugarte et al. Reference Ugarte, Calderini and Slafer2007). The importance of considering the Bo-At phase for grain weight has been highlighted recently by Ferrise et al. (Reference Ferrise, Triossi, Stratonovitch, Bindi and Martre2010), who found that final grain weight (FGW) of durum wheat under different sowing dates was explained almost completely (R 2=0·99, P<0·001) by maximum temperatures averaged across the 15-day period before anthesis. As this response cannot be simulated by present crop models, it is necessary to assess the behaviour of wheat under high temperatures in field experiments.
The assessment of wheat response to temperature has been focused mainly on the effect of chronic moderately high temperatures, i.e. 15–32 °C throughout the crop life-cycle, or during an entire phenophase (Wardlaw et al. Reference Wardlaw, Dawson and Munibi1989, Reference Wardlaw, Blumenthal, Larroque and Wrigley2002; Hunt et al. Reference Hunt, Van Der Poorten and Pararajasingham1991; Wheeler et al. Reference Wheeler, Batts, Ellis, Hadley and Morison1996; Prasad et al. Reference Prasad, Pisipati, Ristic, Bukovnik and Fritz2008), and to heat-shock temperatures (a few days >32 °C) during grain filling (Stone & Nicolas Reference Stone and Nicolas1995a, Reference Stone and Nicolasb, Reference Stone and Nicolasc, Reference Stone and Nicolas1996; Spiertz et al. Reference Spiertz, Hamer, Xu, Primo-Martin, Don and Van Der Putten2006). Less research has been carried out on the impact of moderately high temperatures (15–32 °C) during short periods of the wheat crop life-cycle (Ferris et al. Reference Ferris, Ellis, Wheeler and Hadley1998). Thus, the present work studied the effect of moderately high temperature at different moments during grain yield determination, taking into account that these events are the most likely future scenario for central-southern Chile.
A central goal was to evaluate the sensitivity of yield components and quality associated traits, which are poorly predicted by crop models, especially grain weight and protein concentration. Therefore, the present study aimed to assess the impact of moderately high temperature events on grain yield, its components and grain protein concentration under the most likely scenarios of temperature increase projected for central-southern Chile during the key phases for grain number and grain weight determination.
MATERIALS AND METHODS
Site and plant husbandry
Two experiments were carried out under field conditions at the experimental station of the Universidad Austral de Chile (UACh) in Valdivia (39° 47′S, 73° 14′W, 19 m asl), Chile, during the 2006/07 (Expt 1) and 2007/08 (Expt 2) growing seasons. The experiments were sown on 1 September 2006 and 29 August 2007. In both experiments the seed rate at sowing was 320 seeds/m2 in plots of 9 rows, 0·15 m apart and 2 m long. Experimental units were fertilized with 150 kg N/ha and 300 kg P2O5/ha at sowing. In addition, 150 kg N/ha was applied at tillering (GS 23; Zadoks et al. Reference Zadoks, Chang and Konzak1974) in both years. Plots were periodically surface-irrigated during the growing seasons to avoid water shortage. Weeds were controlled by hand and insecticides and fungicides were used to control or prevent biotic damage at the rates recommended by their manufacturers.
Treatments and experimental design
Treatments consisted of the factorial combination of: (i) two wheat cultivars, (ii) three temperature regimes (control and two increased temperature treatments over the control) and (iii) two or three timings of heating during the crop cycle (twice in Expt 1 and three times in Expt 2). Plots were arranged in a split plot design with three replicates in both experiments, where the main plot was the timing of thermal treatment (i.e. the phenological phase of the crop), and cultivars and temperature regimes were randomized over main plots.
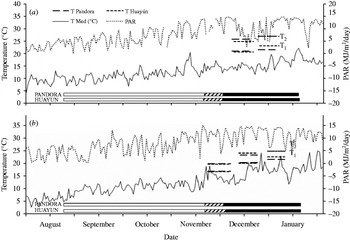
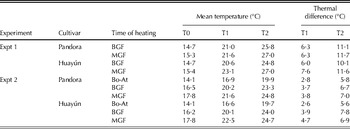
The cultivars were chosen considering (i) their high yield potential and wide use by Chilean farmers, (ii) similar phenology (mainly considering anthesis and maturity dates) and (iii) contrasting average grain weight (Pandora INIA: high and Huayún INIA: low). Thermal regimes consisted of one control treatment at ambient temperature (T0) and two treatments with temperatures above the control (T1 and T2) at two (Expt 1) or three (Expt 2) timings (Table 1). Treatments T1 and T2 shown in Table 1 were determined according to the temperatures expected for central-southern Chile (University of Chile 2006; Parry et al. Reference Parry, Canziani, Palutikof, van der Linden and Hanson2007) under the A2 and B2 scenarios of greenhouse gas emissions defined by the Intergovernmental Panel on Climate Change (IPCC) and more severe global change scenarios. The timings of temperature treatments were 12 days at the beginning of grain-filling (3–15 days after anthesis, referred to from now on as BGF) and in the middle of the grain-filling period (20–32 days after anthesis: MGF) in Expt 1. In Expt 2, an additional phenophase was evaluated (Bo-At) in addition to BGF and MGF. The timing of treatments is shown in Fig. 1.
Daily mean temperature of control (ambient temperature; solid line) and PAR (dotted line): (a) Expt 1 and (b) Expt 2. Horizontal dashed lines show heated treatments (T1 and T2 for each cultivar). Horizontal bars at the bottom of the panels indicate phenological phases in the control treatments of cultivars Pandora and Huayún: emergence to booting (open bars), Bo-At (grey bars) and anthesis to physiological maturity (closed bars).

Mean temperature of controls (T0) and heated (T1, T2) treatments at Bo-At, BGF and MGF phases of Pandora and Huayún cultivars in experiments 1 and 2. Thermal difference shows the increase of temperature in heated treatments above the control (T1 or T2 – T0)

Chambers and devices to increase crop temperature
Plants were heated using polyethylene chambers equipped with thermostatically controlled electric heaters as in previous experiments (Savin et al. Reference Savin, Stone and Nicolas1996; Ugarte et al. Reference Ugarte, Calderini and Slafer2007). The thermal regime was controlled by thermal sensors placed at the height of the spikes and connected to a temperature regulator. Temperature at the level of the spikes both within the chambers and outside was recorded using data loggers (Cavadevices, Buenos Aires, Argentina). Air mean temperature in the field was also recorded by a weather station (Davis Vantage Pro, USA) set in the experimental station 50 m from the experiment. The chambers were built of wood (2·2×1·7×1·2 m) and covered by transparent polyethylene (100 μm thick). The tops of the chambers were removed daily between 09.00 and 17.00 h, to avoid increase in temperature above 32 °C within the chamber and to prevent the interception of solar radiation by the polyethylene film, which would have decreased the amount of photosyntetically active radiation (PAR) reaching the canopy. Incident PAR was measured at the Geophysics Institute of the Universidad Austral de Chile, located 2 km from the experimental station.
Plant measurements and data analysis
Dates of emergence (GS 10), booting (GS 43) and anthesis (GS 65) were recorded using the scale proposed by Zadoks et al. (Reference Zadoks, Chang and Konzak1974). Physiological maturity was registered a posteriori by grain mass stabilization, measured as follows: from anthesis onwards, dry weight of grains within the two central spikelets was measured after oven drying for 48 h at 65 °C with an electronic balance (Mettler, Germany). The samples were obtained twice weekly from two spikes (randomly selected from spikes that reached anthesis at the same time) in each plot, until c. 50 days after anthesis. FGW and timing of physiological maturity was estimated using a bi-linear model as in Miralles et al. (Reference Miralles, Dominguez and Slafer1996). Grain-filling duration was calculated by subtracting the days to anthesis from the number of days to maturity. The length of post-anthesis phases (BGF, MGF) in thermal treatments was calculated as the number of days when grains accumulated the same fraction of grain mass than controls during heated period of 12 days.
Aboveground biomass of plants was sampled at maturity. Samples were taken from 1 m of the central row of each plot. In Expt 2, samples were divided into main stems and tillers. Biomass samples were divided into three categories: spikes, leaf blades and stems plus sheath leaves. These plant organs were weighed with an electronic balance (Mettler, Toledo XP205DR, Greifensee, Switzerland) after drying for 48 h at 65 °C. Spikes were threshed, and then grain yield was recorded. Average grain weight was estimated using three random subsets of 200 grains per plot. Grain number was calculated as the ratio between grain yield and average grain weight. Harvest index was calculated as the ratio between grain yield and above-ground biomass. At harvest, N concentration of grains was measured in 35 g of seed samples adjusted to 150 g water/kg of fresh weight moisture over 18 h and milled on a Perten 120 laboratory mill (Huddinge, Sweden). The Kjeldahl procedure was used to determine total N. Protein was calculated by multiplying total N by 5·7 (Merrill & Watt Reference Merrill and Watt1973).
The effects of thermal treatments on key response variables were assessed by a three way analysis of variance. Least significant differences (LSD) were calculated to identify differences between treatments, taking into account that the temperature levels were different between treatments. In addition, one-way Anova (Anova 1) and the Dunnet test were used to evaluate the differences between the control without temperature chambers and the other treatments. The degree of association between variables was assessed by the linear regression analysis.
RESULTS
Environmental conditions and crop phenology of the experiments
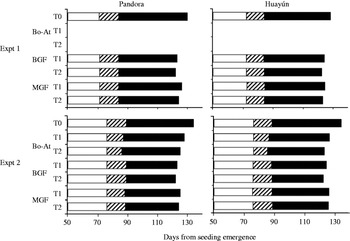
Environmental conditions were similar between seasons. The average temperature between emergence and anthesis was 1 °C higher in Expt 1, while the post-anthesis temperature was c. 1 °C lower than in Expt 2 (Fig. 1). Incident PAR averaged 7 MJ/m2/day during the emergence-anthesis period and 11 MJ/m2/day from anthesis to physiological maturity in both experiments (Fig. 1). As expected, dates of phenological stages in the control treatments were similar for Pandora and Huayún in both seasons, avoiding differences in environmental conditions during key phases for grain yield determination, between cultivars (Figs 1 and 2). As a consequence, mean temperature and incident PAR were similar during the entire crop cycle in both cultivars and experiments (Fig. 1).
Length of phenological phases after seedling emergence under control (T0) and heated (T1, T2) treatments during the Bo-At, BGF and MGF phases in Expts 1 and 2. Bars show the length of each phase: stem elongation to booting (SE-Bo, open bars), Bo-At (grey bars) and anthesis to physiological maturity (At-PM, closed bars).

Heating increased the mean temperature within the chambers mainly due to higher maximum temperature, but it is important to point out that maximum temperatures were always below heat-shock temperatures (i.e. plants were maintained within the range of moderately high temperatures: 25–31 °C). Similar average temperatures were recorded in heated treatments at each phase in Expts 1 and 2 (Table 1). However, the average temperature increased throughout the crop cycle by c. 3 °C from Bo-At to MGF (Fig. 1, Table 1).
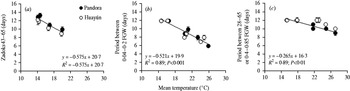
The higher temperatures in the chambers modified the crop phenology by shortening each phase with regard to the control in both experiments (Fig. 2). Despite this general response, the impact of higher temperatures depended on when the increased temperatures were applied (hereafter referred to as ‘time of heating’). The length of the Bo-At period (GS 43–65) was shortened by 3 days (P<0·05) in Expt 2, the period when grains accumulate 0·04–0·2 of their final dry weight (0·04–0·2 FGW) was shortened by 2–6 days (P<0·05) and the period when grains accumulate 0·28–0·65 (Expt 1) or 0·4–0·85 (Expt 2) of their final dry weight (0·28–0·65 or 0·4–0·85 FGW respectively), was reduced by 0–3 days). The length of each phase (GS 43–65, 0·04–0·2 and 0·28–0·65 or 0·4–0·85 FGW) was associated (P<0·01) with the average temperature of treatments (Fig. 3); however, the sensitivity of the development rate to temperature was different (P<0·05) among the phases: GS 43–65=0·04–0·2 FGW>0·28–0·65 or 0·4–0·85 FGW (Fig. 3).
Relationship between the mean temperature at each phase and (a) the length of GS 43–65, (b) the period when grain mass accumulated was 0.04–0.2 of FGW, and (c) the period when grain mass accumulated was 0.28–0.65 (Expt 1) or 0.4–0.85 (Expt 2) of FGW.

Grain yield and yield components response to thermal treatments
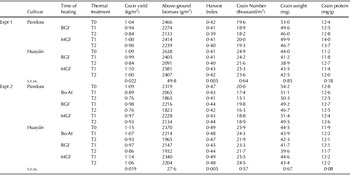
Grain yield was significantly affected by the temperature regime (P<0·001), the time of heating (P<0·01) and cultivar (P<0·05) in Expt 1, while no interaction between these sources of variation was found (Table 2). In Expt 2, where the Bo-At phenophase was also evaluated, grain yield was affected (P<0·01) by the three sources of variation as in Expt 1, but significant interactions between temperature increase and time of heating (P<0·01), as well as between time of heating and cultivar (P≤0·001), were found. These interactions were mainly due to the Bo-At treatment (Table 2).
Grain yield, above-ground biomass, harvest index and yield components (grain number and grain weight) of controls (T0) and heated (T1, T2) treatments at Bo-At, BGF and MGF phases of Pandora and Huayún cultivars in Expts 1 and 2

s.e.m.: standard error of the means. Values are means of three replications.
Thermal treatments decreased grain yield by 8–30% across experiments. The time of heating explained most of the variation in grain yield of each cultivar and, to a lesser extent, the temperature increase (Table 2). The highest grain yield decrease was recorded in T2 for the Bo-At (30% in Pandora and 20% in Huayún) and BGF (30% Pandora and 26% Huayún) phases in Expt 2. Huayún was relatively less affected than Pandora at these phases (Table 2). Grain yield was negatively associated with the average temperature at both Bo-At and BGF. However, these phases showed different sensitivities, i.e. the rate of yield decrease as a response to increased temperature; the Bo-At period was the most responsive (Fig. 4). In contrast, there was no association between grain yield and temperature at MGF (Fig. 4) as grain yield decreased 0–14% in this phase.
Relationship between grain yield of cultivars Pandora and Huayún and mean temperature of treatments at different phenophases in Expts 1 and 2. Bo-At, booting-anthesis; BGF, beginning of the grain filling; and MGF, middle of grain filling.

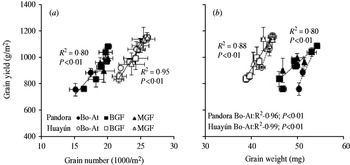
The three sources of variation assessed, i.e. thermal regime (P<0·01), time of heating (P<0·05) and cultivar (P<0·01), affected grain number and grain weight in both experiments (Table 2) and significant interactions were found only in Expt 2. Grain yield was significantly associated with both grain number and grain weight; although a closer relationship was found with grain number in both cultivars (Figs 5(a) and (b)). A different association was found between grain yield and grain weight for the pre- and post-anthesis treatments as the heating treatments induced a higher decline in yield per unit of grain weight reduction at the Bo-At phase than in post-anthesis because of the double effect on grain weight and grain number (Fig. 5b).
Relationship between grain yield and (a) grain number or (b) grain weight of cultivars Pandora and Huayún under thermal treatments in Expts 1 and 2.

The sensitivity of grain number to temperature depended on time of heating and cultivar. Grain number declined more strongly in T2 at Bo-At (25%, Expt 2) than during BGF (7% in Expt 1 and 19% in Expt 2) in Pandora, whereas Huayún showed a similar response for this trait when plants were heated at Bo-At (15%, Expt 2) and during BGF (13 and 16% in Expts 1 and 2, respectively). In fact, a negative association between grain number and mean temperature was found in Pandora only for the Bo-At phase, while a single association was fitted for data recorded at both Bo-At and BGF timing in Huayún (Figs 6(a) and (b)).
Relationship between mean temperature and (a, b) grain number, or (c, d) grain weight of cultivars Pandora (left panels) and Huayún (right panels).

The sensitivity of grain weight depended on the time of heating and cultivar, taking into account that grain weight decreased 5–7% at Bo-At (Expt 2, both genotypes), 6–14% during the BGF period (both experiments and cultivars) and 5–12% during MGF in Pandora (both experiments, Table 2). However, differences between phenophases seem to be a consequence of the temperature rise instead of the assessed period because a unique association was found between grain weight and average temperature for both Bo-At and BGF periods in Pandora and Huayún (Figs 6(c) and (d)). Cultivars showed different slopes of the linear regression analysis indicating higher sensitivity of grain weight to temperature by Pandora (0·68 mg/°C) than Huayún (0·51 mg/°C) at both Bo-At and BGF phenophases (Figs 6(c) and (d)). Grain weight recorded at the MGF treatment was not associated with average temperature in Huayún, but a single association was fitted in Pandora when the three timings of heating were plotted together (R 2=0·78, P<0·01), showing more responsiveness in the latter cultivar during the MGF phase (Table 2).
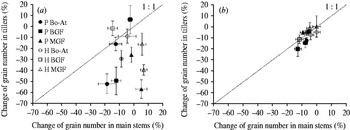
The response of yield components to higher temperatures was also analysed accordingly with the spike category (i.e. main stems and tillers) in Expt 2 to assess the sensitivity of stem categories to future scenarios of global warming. Interestingly, grain number was more affected in tillers than in main stems considering both genotypes and all the timings of heating explored in Expt 2 (Fig. 7a). In contrast to grain number, grain weight showed similar sensitivities between stem categories of both genotypes (Fig. 7b).
Relationship of (a) grain number or (b) grain weight change of thermal treatments relative to controls (%) between tillers and main stems. Closed symbols correspond to Pandora and open symbols to Huayún. Line shows the 1 : 1 ratio.

Grain protein concentration
Grain protein concentration of the controls was significantly (P<0·01) higher (9·2%) in Pandora than in Huayún when averaged across both experiments, even when similar grain yield was achieved by these cultivars (Table 2). Thermal treatments increased (P<0·05) grain protein concentration of Huayún during BGF (13%, T2) and of both cultivars (7% in Huayún T2; 10 and 13% in Pandora T1 and T2, respectively) during MGF in Expt 1 (Table 2). In contrast, protein concentration remained similar to the controls (12 mg/g) throughout the heated treatments in Expt 2. It is important to highlight that the largest grain protein increase found in Expt 1 was only 0·3%/°C of temperature increase, therefore, no clear association was found between this trait and average temperature at any phenophase explored in this study. Protein yield and mean temperature showed a negative association in treatments at Bo-At and BGF (R 2=0·68, P<0·01), mainly because the reduction of grain yield was driven by the impact of high temperatures (Table 2, Fig. 4). A weak but significant association (R 2=0·31, P<0·01) was found between grain protein concentration and grain weight across all the treatments assessed.
DISCUSSION
There has been little investigation into the impact of increased temperature within the moderately high range (15–32 °C) during short periods of the crop cycle in wheat. For this reason, the present study focused on the response of grain number, grain weight and protein concentration of grains to increased temperature within the moderately high temperature range, according to the most likely scenarios of global change for the central-southern area of Chile.
A crucial issue to evaluate the response of yield and quality to higher temperature is the relevance of the phenological phase at which temperature is increased. In this study, the timing of temperature increase was central for the magnitude of the penalty on yield since this trait was more affected at the Bo-At phase than at those periods evaluated during grain filling (Table 2, Fig. 4). Previous studies have pointed out that both main yield components (grain number and weight) of wheat, barley and triticale are highly sensitive to an increase of temperature during the phase immediately previous to anthesis (Calderini et al. Reference Calderini, Abeledo, Savin and Slafer1999, Ugarte et al. Reference Ugarte, Calderini and Slafer2007; Ferrise et al. Reference Ferrise, Triossi, Stratonovitch, Bindi and Martre2010; Hakala et al. Reference Hakala, Jauhiainen, Himanen, Rötter, Salo and Kahiluoto2012). The present study quantified the yield response at specific phases both at pre- and post-anthesis by negative associations between grain yield and average temperature (Fig. 4). The quantitative association shown here for the Bo-At period (5% grain yield reduction per each °C of temperature increase) was similar to the sensitivity of wheat (6%/°C) found by Prasad et al. (Reference Prasad, Pisipati, Ristic, Bukovnik and Fritz2008) for the whole period from booting to physiological maturity. These results reinforce the importance of the Bo-At phase.
Grain number showed the closest association with grain yield (Fig. 5) and this component was the most sensitive to higher temperature during the Bo-At phase (Fig. 6). Moreover, higher temperatures decreased the number of grains at similar rates (4%/°C) to those reported in previous experiments where the effect of high temperature was assessed around anthesis (Wardlaw et al. Reference Wardlaw, Dawson and Munibi1989; Ugarte et al. Reference Ugarte, Calderini and Slafer2007; Prasad et al. Reference Prasad, Pisipati, Ristic, Bukovnik and Fritz2008). At the same time, the sensitivity of grain weight (1%/°C) was also found to support the overlap between grain number and grain weight determination reported previously. However, this was found in experiments where the heat-shock effect could have played a role, since maximum temperatures surpassed the range of moderately high temperatures (Calderini et al. Reference Calderini, Abeledo, Savin and Slafer1999; Ugarte et al. Reference Ugarte, Calderini and Slafer2007). Therefore, this study demonstrates that moderately high temperatures during the Bo-At phase negatively affect both grain yield components.
The different sensitivities shown by the cultivars to higher temperature could be promising for mitigation of the negative effects of increasing temperatures, by choosing which cultivar to sow, i.e. cultivar Huayún, because grain number and grain weight were less sensitive to temperature increase in that cultivar. Grain number in Pandora was particularly sensitive to higher temperatures and grain weight was affected in this cultivar even at the later thermal treatment during grain filling. Regarding the stems category, responses of both tillers and main stems seem to be important for the sensitivity of cultivars to heat stress: the former because of their high sensitivity to increased temperature, the latter because even with lower sensitivity, its contribution to final grain yield is major.
In the light of projections made by crop simulation models and results from previous experiments, it is expected that the increase of global temperatures will affect grain yield and protein concentration of wheat in most of the wheat growing areas of the world (Correll et al. Reference Correll, Butler, Spouncer and Wrigley1994; Tubiello et al. Reference Tubiello, Rosenzweig, Goldberg, Jagtap and Jones2002; Ewert et al. Reference Ewert, Rounsevell, Reginster, Metzger and Leemans2005; Magrin et al. Reference Magrin, Travasso, Rodriguez, Solman and Nunez2009; Asseng et al. Reference Asseng, Foster and Turner2010; Stöckle et al. Reference Stöckle, Nelson, Higgins, Brunner, Grove, Boydston, Whiting and Kruger2010), even considering the positive effects of increased CO2 on the productivity of C3 species (Wheeler et al. Reference Wheeler, Batts, Ellis, Hadley and Morison1996; Kimball et al. Reference Kimball, Kobayashi and Bindi2002; Long et al. Reference Long, Ainsworth, Leakey and Morgan2005). Under global change scenarios, crop simulation models have estimated up to 50% of grain yield decrease (Tubiello et al. Reference Tubiello, Rosenzweig, Goldberg, Jagtap and Jones2002; Porter & Semenov Reference Porter and Semenov2005; Magrin et al. Reference Magrin, Travasso, Rodriguez, Solman and Nunez2009; Asseng et al. Reference Asseng, Foster and Turner2010). In central-southern Chile, grain yield reduction of wheat has been estimated between 10 and 20% by simulation models in a scenario of 2·3–2·6 °C of temperature increase and under different water availabilities (Meza & Silva Reference Meza and Silva2009). Yield losses recorded in our study ranged 8–30% in response to temperature increase between 2·6 and 11·7 °C, assessed, however, during shorter periods than those evaluated by simulation models. Moreover, at specific developmental stages, and under expected scenarios of temperature increase (+2·4–3·4 °C, Parry et al. Reference Parry, Canziani, Palutikof, van der Linden and Hanson2007), the impact could be higher than observed (14–18% at Bo-At) regarding that the thermal increase lasted for only 12 days.
Even considering that the evaluations carried out in the present study did not assess the impact of increased CO2 concentration, which could modify the responses of grain yield to higher temperature (Peart et al. Reference Peart, Jones, Curry, Boote, Allen, Smith and Tirpak1989), the results support previous studies that concluded that the CO2 scenarios for 2100 would not compensate for the negative effect of increased temperature on wheat in several areas of the world (Rosenzweig & Parry Reference Rosenzweig and Parry1994; Van Oijen & Ewert Reference Van Oijen and Ewert1999). This may be especially important at specific phenological phases where crops such as wheat are less dependent on current photosynthesis (Shpiler & Blum Reference Shpiler and Blum1986; Borrás et al. Reference Borrás, Slafer and Otegui2004, Calderini et al. Reference Calderini, Reynolds and Slafer2006) as during the grain-filling period (Slafer & Savin Reference Slafer and Savin1994; Borrás et al. Reference Borrás, Slafer and Otegui2004). As a consequence, the positive effect of the future increase of the photosynthetic rate (in response to higher atmospheric CO2 concentration) on yield may be low. Therefore, it is not expected that the negative impact of increased temperature on grain number and grain weight at or after anthesis could be completely compensated by the gain in photosynthesis rate.
In addition to grain yield, high temperatures could affect grain quality through: (i) modifying the synthesis of proteins, (ii) affecting the starch accumulation and grain weight and (iii) both (Jenner et al. Reference Jenner, Ugalde and Aspinall1991; Dupont et al. Reference Dupont, Hurkman, Vensel, Tanaka, Kothari, Chung and Altenbach2006; Liu et al. Reference Liu, Guo, Jiang, Pu, Feng, Zhu, Peng, Kuang and Little2011). However, in this study the effect of higher temperature on grain protein concentration was negligible. This result is in agreement with Wardlaw et al. (Reference Wardlaw, Blumenthal, Larroque and Wrigley2002), who found a small or null effect of increased moderately high temperatures on the protein concentration of wheat grains, when the temperature was increased during most of the grain-filling period. The results from Wardlaw et al. (Reference Wardlaw, Blumenthal, Larroque and Wrigley2002) and the present work both suggest that moderately high temperatures have a similar impact on N and starch accumulation of grains. Thus, it is proposed that under temperature increases, similar to those evaluated in this study, protein concentration of grains would not be affected; however, protein yield will be reduced by the negative effect of higher temperature on grain yield.
The main conclusions of the present work are that short periods of increased temperatures (+2·6–11 °C) in the range of moderately high during key phases for grain number and grain weight determination decreased grain yield between 8 and 30%. Nonetheless, the extent of grain yield reduction was greatly dependent on the sensitivity of specific phenophases. At the same time, protein concentration of grains was hardly affected under the increased temperatures assessed in this study. Different cultivars were found to have different levels of sensitivity, associated mainly with grain number and grain weight responses of both main stems and tillers. More studies will be required to investigate whether high grain number cultivars such as Huayún are better suited to address future events of temperature increase than high grain weight cultivars as Pandora.
Taking into account the results reported in the present and previous studies, it has become necessary to improve the accuracy of crop simulation models by developing algorithms to account for the sensitivity of grain weight to temperature during the pre-anthesis phase, which has been shown critical for both grain number and weight determination.
We especially thank Magda Lobnik for technical assistance, Luis Vargas by providing facilities at the experimental station and Christine Harrower for revising the English usage. We are grateful to the two anonymous referees for useful comments and careful review of our paper. X. C. Lizana held a postgraduate scholarship from the Chilean Technical and Scientific Research Council (CONICYT). This study was funded by Project FONDECYT 1040125 (CONICYT) competitive grant.