INTRODUCTION
Dynamic stochastic general equilibrium (DSGE) models with complete markets and a representative agent are widely used nowadays in the asset pricing literature. Because Mehra and Prescott (1985), research on “Asset Pricing Puzzles” has benefited from numerous contributions, which have served to isolate salient discrepancies between models and data. Three puzzles have particularly attracted attention: The Equity Premium Puzzle refers to the fact that returns on the stock market exceed the returns on Treasury bills by an average of 6 percent; the Risk-Free Rate Puzzle, identified by Weil (1989), refers to the fact that the return on riskless bills is low in average; and the Stock Market Volatility Puzzle refers to the fact that returns on stocks are very volatile. A major advancement in the research program on the Equity Premium Puzzle suggests that allowing for the frictionless adjustment of the capital stock constitutes a major weakness of a DSGE asset pricing model with a nontrivial production sector. Elaborating on this line of argument, Jermann (1998) has proposed a valuable contribution that, by combining adjustment costs in the investment technology with habit formation in preferences, simultaneously succeeds in reproducing asset returns and business cycles stylized facts.
This paper studies asset returns in different versions of the real business cycle model, adopting an alternative empirical strategy to assess a model's goodness of fit. This approach considers a model as an approximation to the process generating the observed data, and characterizes the dimensions for which the model provides a good approximation and those in which it does not. Our aim is to offer new evidence about the size and the location of approximation errors of a set of stochastic growth models that are considered to be decisive steps in the progress of the asset pricing research program: the standard RBC model, a RBC model with habit persistence, a RBC model with capital adjustment costs, and our benchmark model inspired from Jermann (1998). Our specific objective is to reevaluate the results of the Jermann's model by extending the calculations to the frequency domain. The second-order moments, which traditionally have been used to evaluate dynamic general equilibrium models after Kydland and Prescott's (1982) original paper, present the disadvantage of hiding important information on the way data are matched: a model may succeed in replicating the total variance without concentrating it on correct frequencies. Spectral goodness-of-fit measures, originally proposed by Watson (1993), are a good guide in detecting this kind of failure. We are particularly interested in the model ability to explain the volatility of the equity return, the risk-free rate, the consumption, the dividends and the mean equity premium.1
Our contribution exploits the fact that in DSGE models households equate intertemporal marginal rates of substitution in utility with intertemporal marginal rates of transformation. Under the complete markets hypothesis, we are able to derive the endogenous stochastic discount factor, the return on equity, the return on long-term bond, and the risk-free rate. This allows us to evaluate the models' ability to account for the main Asset Returns Puzzles.
The main result is that the benchmark model's behavior in the spectral domain is mixed. Some time-based results are confirmed: the model certainly reproduces enough covariance between the stochastic discount factor (SDF) and the equity return, and needs a very small contribution of approximation errors to account for the empirical equity premium. However, some spectral behaviors differ from the time-based evaluations: although the model's explanation of the equity return volatility is well accounted for in the time domain, the contribution of approximation errors remains relatively high. More generally, we find that spectral results are relatively encouraging because the location of the approximation errors (when they are substantial) seems to be essentially concentrated at high frequencies, which are of little interest for macroeconomists interested in medium- and long-run dynamics.
Our spectral evaluation is closely related to Cogley (2001).2
He provides a frequency decomposition of approximation errors for stochastic discount factor models. To this aim, he extends the work of Hansen and Jagannathan (1997) by developing a version of the Hansen-Jagannathan's specification error bound in the frequency domain. This diagnostic tool is then applied to different versions of SDF models selected for their crucial role in the Asset Pricing literature or their relative success in accounting for key Asset Returns Puzzles.
The paper is organized as follows. Section 2 presents the basic theoretical framework and the extensions to account for the key financial asset returns properties. Section 3 reports the methodology used to solve and calibrate the different versions of the model, then goes on the measure of fit. Section 4 comments the empirical results.
MODEL ECONOMIES
A Standard Real Business Cycle Model
We analyze a version of the standard real business cycle model with a large number of infinitely lived firms and households. There is a single consumption-investment good produced with a constant returns technology, subject to random shocks in productivity:

where Y denotes production, K the stock of capital, N the labor input, X the deterministic trend in labor augmenting technical change, and Z the stochastic productivity level.
Firms
At each period, firms decide how much labor to hire and how much to invest. Managers maximize the value of the firms to the owners, that is the present discounted value of current and future expected cash flows:

where
is the owners' intertemporal marginal rate of substitution, W the real wage rate, and I investment. The capital stock obeys the intertemporal accumulation law:

where δ is the depreciation rate. This firm does not issue new shares and finances its capital stock solely through retained earnings. The dividends to shareholders are then equal to:

Households
The representative household maximizes expected lifetime utility of consumption subject to a sequence of budget constraint. The time endowment is entirely allocated to productive work. The program writes:

where β is the discount factor, γ the coefficient of relative risk aversion, at is a vector of financial assets held at t and chosen at t−1,
, and
are the vectors of asset prices and current period payouts, respectively. The asset vector a contains shares of the representative firm and possibly other assets.
Final good market equilibrium
At equilibrium, all produced goods are either consumed or invested:

Asset prices
Prices and rates of return derive from the solution to each agent's optimization problem. The rate of return on the risk-free asset is:
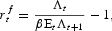
where Λt is the Lagrange multiplier associated with the household's resource constraint, which also operates in the intertemporal marginal rate of substitution of the owners of the firm. This multiplier is the derivative of expected present discounted utility with respect to Ct.
We also take into account a j-period bond return:

We can then define the model equivalent to a long term bond return, that is a ten-year (j=40) pure discount bond return.
The stochastic discount factor then amounts to

The rate of return on equity is:

where Qt is the consumption good value of a newly installed unit of capital (which will be used in the production at the beginning of t+1), and Pt+1 the value of the same unit of capital at the end of period t+1. As shown by Boldrin, Christiano, and Fisher (1995), Qt can be interpreted as the price of equity and Pt+1/Qt as the capital gain. In the standard RBC model, we have Qt=1, and Pt+1=1−δ. Consequently, this model exhibits no variation in the capital gain component of the return to equity. The mean equity premium is
.
Finally, we also define the Sharpe ratio
as

where
represents the standard-deviation of equity return.
The Habit Formation Model
A first extension of the RBC model consists in modifying the preference structure. We consider a simple version of habit formation:

When η is zero, one obtains the standard RBC model. When η is positive, household preferences are characterized by habit persistence. As shown by Contantinides (1990), habit formation has the potential to account for the equity premium puzzle, while implying a modest degree of risk aversion. According to several econometric analyses, this form of preferences is promising in reconciling U.S. data on consumption and asset returns [Daniel and Marshall (1997, 1998), Heaton (1995)].
The Adjustment Cost Model
In the standard RBC model, the linear capital accumulation implies that the supply of capital Kt+1 at date t is infinitely elastic to the price of the consumption good. The adjustment cost hypothesis reduces the elasticity of capital supply. To this aim, we replace the linear capital accumulation technology (3) by the specification used in Jermann (1998):

where ϕ(.) is a positive increasing and concave function:

The concavity of ϕ(.) captures the idea that changing capital stock rapidly is more costly than changing it slowly. This specification allows the shadow price of installed capital to diverge from the price of an additional unit of capital. Therefore, it allows for variations of Tobin's q. Coefficients a, b, and c are chosen so as to yield the same steady-state properties as the standard capital accumulation technology.3
We also impose the following properties around the steady state:
and
. a is chosen in order to match the elasticity of the
ratio with respect to Tobin's q. We can then deduce the value for b=(i/k)a and
.
In what follows, we will focus on four models: the standard RBC model, the habit formation model (HAB model), the adjustment cost model (ADJ model), and, finally, our benchmark model (BMK model), which combines habit formation and capital adjustment costs.
THE METHODOLOGY
Solution Method
A key characteristic of our paper is to solve all of the models with a fully nonlinear method inspired from Judd (1998).4
Prior studies of assets returns in general equilibrium models, relied on value function iteration as a solution technique [Rouwenhorst (1995)]. Jermann (1998) proposes another method based on loglinear-lognormal environment.
Calibration
We use the following parameter values: the quarterly trend growth rate is 1.005, the depreciation rate δ is 0.025, the constant labor share in the Cobb-Douglas production function (1−α) is 0.64. For the productivity level, the standard deviation of the shock is set so as to match the U.S. output growth volatility. The persistence parameter for the AR(1) is set to 0.95. We choose the “transformed economy” discount factor β*=βμ−γ equals to 0.991. To facilitate comparison with Jermann's results, we set ξ, the elasticity of the investment capital ratio with respect to the Tobin's q, equal to 0.23. In the same fashion, the power parameter γ, in the utility function, is set at 5 for both the time-separable case and the habit-formation specifications.
Jermann (1998) uses a minimum-distance metric to calibrate the habit formation parameter, the capital adjustment costs elasticity parameter, the pure discount factor, and the shock persistence. His objective is to maximize the model's ability to match some moments of interest. This procedure remains applicable with a fully nonlinear solution method, but is time-consuming. For example, Boldrin, Christiano, and Fisher (1995, 2001) propose a similar methodology, but they only compute the criterion's value for the habit parameter. We follow this procedure to optimize the model's ability in accounting for the mean equity premium and the mean risk-free rate. Therefore, we minimize the criterion
where:

Here,
is a 2×1 vector composed of the sample average of quarterly observations on the risk-free rate and the equity premium. VT is a 2×2 weighting diagonal matrix, which is composed of the inverse of the variance of the statistics in
. Finally, g(η) is the model's implied average quarterly mean risk-free rate and equity premium, conditional on η and other parameters' value. The components of g are obtained by taking the average over 500 simulations, each 200 quarters long. In practice, we compute
for a grid of values for η=[0, 0.9] then take the value
that minimizes
. For our benchmark model, we find
. Table 1 summarizes the calibration procedure.5
For the habit model we find a value of
equal to 0.86.

Measure of Fit
Following Watson (1993), we view our economic model as an approximation to the stochastic processes generating empirical data.6
Appendix A provides further details on the methodology.
Let ut, be the approximation error in the economic model. According to Watson (1993), a lower bound for the variance of ut, also called Relative Mean Square Approximation Error (RMSAE) is:

where Γj(ω) denotes the jth component of Γ, [Au(z)]jj and [Ay(z)]jj denote the (j, j) elements of matrices Au(z) and Ay(z), which are the autocovariance generating function of ut and yt, respectively. In the same fashion, our Covariance Measure of fit writes,

where ϒkj(ω) denotes the component of kth row and the jth column of ϒ, [Au(z)]kj is the (k, j) element of the matrix Au(z).
Given the nonlinear structure of the approximated model solution, it is no longer possible to exploit the vector autoregressions (VAR) representation that naturally emerges from the loglinearization of a model's first order conditions. To estimate the spectral density matrix for each variable in this context, we have to resort to another method. We choose to numerically simulate the nonlinear approximated solution, then estimate a VAR on these simulated series. The implied autocovariance generating function is then used to calculate the previous measure of fit. This is a kind of indirect inference in the spirit of Smith (1993) and Gouriéroux, Monfort, and Renault (1993).
QUANTITATIVE RESULTS
Time Domain Results
As a first step, we focus on second order statistics. Table 2 reports key business cycle and financial statistics for the U.S. economy. Our data sample for asset returns exhibits a mean equity premium of 6.38%, a mean risk-free rate of 1.23%, and a Sharpe ratio equal to 0.40. The standard deviation for quarterly dividend growth is 11%.

The standard RBC model generates an equity premium, which is far too low (0.0007%). This is a consequence of the too low covariance between mt+1 and
. To look into the reasons of this weakness, let us recall that, by definition, the mean equity premium is:

The mean equity premium can be written as the product of the standard deviation of the equity return, the standard deviation of the stochastic discount factor and the correlation between equity return and the stochastic factor. Given the power utility function used in the RBC models, mt is modeled as a function of aggregate consumption and we take the standard deviation of consumption growth as an empirical proxy of σm. We learn from the observed data that
and σΔc are small. The main failure of the RBC model stems from the lack of volatility (0.46% against 15.9% in the data) of the equity return: the model offers too many possibilities to smooth consumption after a shock. A successful model should incorporate factors, which increase the countercyclical movements between mt and
.
Introducing habit formation in the utility function does not significantly improve the model's performances at reproducing the observed mean equity premium. In a model that includes endogenous choices for consumption and dividends, the representative agent smoothes his consumption profile (the standard deviation of consumption growth is 0.39 for the standard RBC model against 0.11 in the HAB model). In addition, there is no capital gain in this model (
is as low as in the RBC model). As a result, the variations in the return to equity are solely driven by those of the marginal product of capital, which are small in both the standard RBC model or the habit formation model.
Similarly, the capital adjustment cost mechanism is unable to increase the model's ability to reproduce asset returns. The theoretical mean equity premium (0.95%), although weak compared with the data, is significantly higher than in the RBC case. The Sharpe ratio implied by the ADJ model represents a substantial step forward compared to the RBC or the HAB models. This is first because of the increase in the value of
, which is multiplied by a factor of 5 in the presence of adjustment costs. This confirms the idea that the introduction of capital gains into a RBC model is a good way to generate the volatility of equity return (2.38 against 0.38 in the RBC model). Nevertheless, the mean risk-free rate is a little high (3.25% against 1.23%). In sum, the introduction of capital gain is a necessary but insufficient condition to match the empirical equity premium. Demand for capital also must vary appropriately. These conditions are achieved by combining habit formation in preferences and adjustment costs in the investment technology.
Compared to the three others, the BMK model does a good job in reproducing financial stylized facts. Its quantitative predictions are similar to those reported in Jermann (1998). The mean equity premium and risk-free rate are close to the empirical data (respectively 6.33% and 1.23%). The shortcomings also are similar: the standard deviation of the dividend growth and the risk-free rate are overstated (respectively 15.1% and 14.4% instead of 1.41% and 11.02%). On the business cycle side, the model reproduces the investment relative volatility quite well, but heavily understates the consumption relative volatility (0.39 against 0.67 in the data).
The Frequency Domain Results
The use of second-order statistics in the time domain to evaluate DSGE models is characteristic of the “RBC methodology” [Prescott (1986), King and Rebelo (1999)]. In the previous paragraph, we assessed the model's goodness of fit by informally comparing a simulated moment with its empirical counterpart. Although these theoretical statistics indicate a good fit, one may wonder about the quality of the informal moment-matching criterion itself. The second-order statistics criterion presents the disavantage of hiding important information on the way data is matched because the statistics only focus on the overall quantity of variance or covariance. Therefore, it is not very informative about the model's behavior because the overall variance or covariance for a given variable may be well replicated, while being concentrated at wrong frequencies with respect to the data. By allowing an evaluation of the contribution of each frequency to the overall (co)variance, a frequency-based evaluation provides a more complete view of the model's properties. Spectral analysis is particularly useful in understanding a model's performances in replicating asset returns stylized facts [Berkowitz (2001)]. For example, the mean equity premium is proportional to the covariance between mt and
, which can be decomposed in the frequency domain.7
For the models that integrate habit formation in preferences, the formulation of the SDF involves a conditional expectation operator. Following Kocherlakota (1996), we approximate this conditional expectation by an unconditional sample mean.
by frequency, in order to determine the approximation errors necessary to reconcile the theoretical cospectral density with its empirical counterpart.
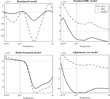
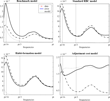
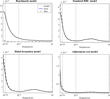
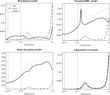
Let us recall that this spectral evaluation's aim is to present new evidence regarding the size and the location of approximation errors, that is to provide a characterization of the dimensions for which the models provide a good approximation and those in which they do not. We address two following questions: How much error must be added to a model to reconcile it with the observed data? Are the approximation errors severe throughout the frequency domain, or are they mainly confined at high or low frequencies? The measures of fit previously presented are used to answer the first question. Table 3 presents the frequency domain results for the four models on the entire spectral domain [0, π]. To deal with the second question, we report the RMSAE on three frequency bands in Table 3: [π/16, π/3] representing business cycles frequencies, [0, π/16] representing low frequencies, and [π/3, π], high frequencies. Finally, to illustrate and to complete the numerical results obtained for each band of frequencies, we plot the RMSAEs against frequency: Figures 1 to 4 provide the decomposition spectra (or cospectra) of the model, the data and the approximation errors for several variables.

Stock return and the stochastic discount factor cospectrum. Frequency domain is partitioned in three intervals. [0, π/16] represents low frequencies interval, which include components for more than eight years. [π/16, π/3] is the business cycle frequencies, that is, periods between 1.5 and 8 years. The last interval, [π/3, π], is the high frequencies interval. A solid line represents error cospectrum required to reconcile the model with the emprical mean equity premium. Dotted and dashed-dotted lines respectively respresent the model and the data cospectra.

Quarterly consumption growth spectrum. Frequency domain is splitted into three intervals. [0, π/16] represents low frequencies interval, which includes components for more than eight years. [π/16, π/3] is the business cycle frequencies, that is, periods between 1.5 and 8 years. The last interval, [π/3, π], is the high frequencies interval. A solid line represents the error spectrum. Dotted and dashed-dotted lines respectively respresent the model and the data spectra.

Risk-free rate spectrum. See Figure 2 for details.

Quarterly dividend growth spectrum. See Figure 2 for details.

The following frequency evaluation focuses mainly on five key variables: the equity return
, the risk-free rate
, the long-term bond return
, the quarterly consumption growth (Δct), and the quarterly dividend growth (Δdt).
measures the fraction of covariance between the stochastic discount factor and equity return because of the model's approximation errors.8
One may argue that focusing on the theoretical discount factor “limited comovement” with equity returns leads to the evaluation of the model conditional on a given utility function. Indeed, the empirical counterpart of the “SDF” is just a given nonlinear function of consumption. Our opinion is that a comparison of the model with unconditional empirical quantities is beyond the scope of this paper. Moreover, the study of comovements between equity returns and consumption growth only holds for models that involve standard separable utility functions. When habit formation is taken into account in preferences, the covariance between
and mt is not equal to the covariance between
and Δct.
See Appendix A for further details.
Results on the size of approximation errors
The first general result is the relatively poor spectral performances of all models. To match the empirical spectral densities, the magnitude of the variance of errors must represent more than 60% of the magnitude of the data variance. In the RBC, HAB, and ADJ models, none of the RMSAE computed on the spectral densities are inferior to 80%, which is synonymous with poor fit.
A first illustration of poor fit is the consumption case. The replication of the global consumption growth volatility is particularly unsatisfying in the RBC and HAB models (respectively 0.94 and 0.90). The ADJ is even worse (2.61) on this point. The BMK is not the exception to the rule and provides poor performances at matching the overall volatility of the empirical consumption growth. The lack of variance with respect to the data in the time-domain evaluation, which we pointed out previously, is confirmed by the frequency-based method: the RMSAE for Δct equals 1.57, which means that the variance of approximation errors have to be at least 157% of the magnitude of the variance of the empirical series to reconcile the model autocovariances with these of the data.10
RMSAE may be superior to 1, if the model produces too much (or not enough) variance (or covariance) with respect to the series.
However, except for the consumption and the risk-free rate case, the quantitative predictions of the BMK model are better than those obtained with the other three models. The equity return (0.74 against 0.99 for the others), bond return, and dividend growth volatility are better accounted for by this model. The BMK model clearly distinguishes itself from the three other models in the replication of the covariance between the equity return and the discount factor: the contribution of approximation errors is 24% to be reconciled with the empirical counterpart. The BMK model explanation of the covariance between equity return and the discount factor is encouraging. We will detail the frequencies responsible for this improved fit later.
The evidence of improved fit of the BMK model with respect to the other models should prevent the masking of the relatively high contribution of approximation errors for some variables. For instance, the approximation errors account for 74% of the model's explanation of the equity return volatility, and yet the theoretical standard deviation on equity in the time domain is very close to its empirical counterpart (15.78 in the model against 15.98). A similar result holds for the dividend growth. If one only considers the theoretical standard deviation of the dividend growth (14.4%), one may conclude that the model works well at reproducing the dividend growth volatility. But, according to the RMSAE on Δdt, approximation errors account for more than 89% of the series variance. It is necessary to investigate the reasons behind this kind of failure by decomposing the measures of fit by bands of frequencies.
Results on the location of approximation errors
The decomposition of the entire measure of fit is particularly appealing in the assessment of the quality of the model approximation: a model may involve an important contribution of approximation errors while largely confining them at frequencies of little interest for macroeconomists. We combine the numerical results on different bands of frequencies with Figures 1–4, which represent decomposition spectra (or cospectra) for the model, the data, and the errors.
A salient result concerning the location of approximation errors is the strong evidence of improved fit at low frequencies, especially for the BMK model. In Table 3, the comparison of the results on [0, π/16] and [π/16, π/3] shows that RMSAEs are closer to zero on [0, π/16] than on [π/16, π/3]. The RMSAE on equity return, for instance, equals 0.63 on [π/16, π/3], 0.74 on [0, π] and 0.88 on [π/3, π]. It drops to 0.26 on [0, π/16]. The good results at reproducing the equity return volatility in the time domain essentially comes from low and medium frequencies.
At business cycle frequencies, the covariance between the stochastic discount factor and equity return is correctly accounted for by the BMK as the contribution of errors represents 17% of the magnitude of the variance of the data. On lower frequencies, the RMSAE increases to 0.24, which is still synonymous with a very good fit. The good performances of the BMK model in the time domain in reproducing the empirical equity premium seems to be a direct result of the model's behavior on medium-low frequencies.
Figure 1 provides further information.11
The flat appearance of the HAB, RBC, and ADJ models cospectra is an effect of the scale difference with respect to the data.
and mt, already noticed in the time domain.
The spectral evaluation confirms that, in a DSGE model with a nontrivial production sector, the introduction of either habit persistence or capital adjustment cost alone does not help the resolution of the equity premium puzzle. In addition, we learn that approximation errors are particularly more severe at business cycle frequencies than at long frequencies in these models.
Figure 2 displays the error necessary to explain the consumption growth volatility.12
The consumption growth behavior plays a central role in the stochastic discount factor definition. This is why we chose to incorporate this variable in our study.
Figure 3 depicts the short-term interest rate spectrum. It gives more information on the way the models work to reproduce the interest rate volatility. The RBC model accounts poorly for the risk-free rate volatility on the entire frequency band. The ADJ model does not really fit in a satisfying way. We have learned from the time-based evaluation that the ADJ model generates an interest rate volatility that is as big as the data volatility. The decomposition of this variance by frequency shows that the volatility comes mainly from the low frequencies. The BMK model case is intriguing because it produces far too much volatility. This shortcoming comes from the association of habit persistence in consumption with capital adjustment cost. This phenomenon has been emphasized by previous studies using a similar framework.13
Figure 3 shows that low and business cycles frequencies are mainly responsible for this extra-volatility. This explains why the BMK model's spectrum is close to the error spectrum.The last comment concerns the dividend growth volatility behavior. If one only considers the standard deviation statistics computed in Table 2, an apparent conclusion is that the BMK model slightly overstates the dividend growth standard deviation, whereas the RBC and the HAB models generate dividend time-series that are too volatile. However, Figure 4 shows another pattern. Quarterly dividends growth is particularly volatile at very high frequencies compared to low or medium frequencies. The model's spectrum largely overstates the contribution of low and medium frequencies, while largely understating the contribution of the high frequencies. This is another illustration of a model that replicates the global variance correctly without concentrating it on correct frequencies.
CONCLUSION
This paper is a first attempt to study asset returns by applying Watson's (1993) evaluation methodology to several variants of general equilibrium asset pricing models. The challenge consists in providing a spectral evaluation of general equilibrium asset pricing models with an explicit production sector. Four versions have been studied; the last one is closely related to Jermann (1998) and combines habit formation and capital adjustment costs. This model is well known for its success in accounting for both stylized facts of asset returns and business cycles. Our aim is to develop evidence about the size and the location of approximation errors. On the one hand, we evaluate how well a model fits the data. On the other hand, we check that approximation errors are severe throughout the frequency domain, or confined mainly at frequencies of little interest to macroeconomists. We do not evaluate the model's performances with respect to the degree of risk aversion, as in Cogley (2001). Instead, we take a model known for its ability to replicate selected stylized facts of asset returns, in order to study its behavior in the frequency domain. We evaluate a model's ability to account for the equity premium puzzle, by decomposing by frequency the cospectrum of the equity return and the stochastic discount factor. To provide a more complete picture of the spectral properties of a given model, we also take into account the short-term interest rate, the quarterly consumption, and the dividends growth.
We found that the spectral performances of the benchmark model were mixed. The spectral evaluation confirms some time-based results. For instance, the explanation of the equity premium puzzle is relatively satisfying: spectral results are as good as those obtained in the traditional approach. The spectral evaluation also exhibits new information that is completely hidden in the time-domain evaluation. For example, in spite of the closeness of the theoretical variance of the equity returns with its empirical counterpart, the model needs a substantial contribution of approximation errors. By decomposing the error by fequency, we show that high frequencies are responsible for this failure. A similar result holds for the risk-free rate, which is known to be too volatile in this kind of model. The spectral evaluation illustrates that this extravolatility mainly comes from the low frequencies.
It turns out that DSGE models with nontrivial production sector, involving habit persistence and capital adjustment costs, represent a good point of departure in the task of resolving the asset prices puzzles. Evidence about the location of approximation errors suggest that this kind of framework provides a relatively good approximation in analyzing asset pricing topics, especially on medium- and long-run frequencies. However, the results on economic variables (such as consumption or dividends) suggest that, in the task of integrating asset returns and business cycles analysis, this model has to be improved to account for those dynamics.
APPENDIX A
Consider an economic model that describes the evolution of an n×1 covariance stationary vector of variables, xt. Let us introduce the autocovariance generating function (ACGF) of xt denoted Ax(z). The empirical counterpart of xt is denoted yt. Variables making up yt are functions of raw data collected in a real economy. Suppose that xt and yt are jointly covariance stationary, and define the approximation error in the economic model ut:

so that

where Au(z) is the ACGF of ut, Axy(z) the cross ACGF between xt and yt. Term of the second member of (21) are needed to calculate Au(z). Ay(z) is easily estimated from sample data; Ax(z) is completely determined by the model. This is not the case for the third term Axy(z), which is not be determined by the model neither be estimated from the data.
Any restriction used to identify Axy(z) is arbitrary. Instead, it is possible to calculate a lower bound for the variance of ut without imposing any restriction on Axy(z). When this lower bound on the variance of ut is large, then under any assumption on Axy(z), the model fits poorly the data. If the lower bound of the variance of ut is small, then there are possible assumptions about Axy(z) that imply that the model fits the data well.
The bound is calculated by choosing Axy(z) so as to minimize the variance of ut subject to the constraint that the implied joint ACGF for xt and yt is positive and semidefinite. Watson (1993) suggests that the lower bound estimate of the Relative Mean Square Approximation Error (RMSAE) writes:

where Γj(ω) denotes the jth component of Γ, [Au(z)]jj, [Ay(z)]jj the (j, j) elements of the matrices Au(z) and Ay(z), respectively. Thus, Γ(ω) measures the fraction of volatility in frequency ω because of model approximation errors, that is the variance of the error relative to the variance of the data for each frequency. Small values of Γ(ω) mean that the model explains most of the volatility concentrated around this frequency. Integrating the numerator and denominator of Γ(ω) provides an overall measure of fit.
In the same fashion, the covariance measure of fit is:

where ϒkj(ω) denotes the kth row and jth column component of ϒ, and [Au(z)]kj the (k, j) element of matrix Au(z). The numerator Au(z) measures the real part of the cospectrum between two variables due to approximation error around frequency ω. The denominator measures the real part of the data sample covariance between the same two variables in frequency ω. Thus, ϒ(ω) measures the fraction of the required covariance in frequency ω that is a result of the model approximation errors. Again, small values mean that the original model explains most of the covariance between two given variables around frequency ω. Integrating over all frequencies yields an overall covariance measure of fit.
Because we are interested in the spectral behavior of DSGE models with asset pricing conditions, recall that the mean equity premium equals the negative of the covariance between the stochastic discount factor (mt) and a risky-asset return
.

A model that produces a large equity premium must displays a substantial negative covariation between the stochastic discount factor and the equity return. We compute ϒ between mt and
.
According to Watson (1993), the log linearization of the Euler equation yields an approximate solution allowing a VAR representation for the logarithms of endogenous variables. Coefficients of this VAR are complicated functions of the structural parameters. With these values for the parameters, the VAR describing the equilibrium can be calculated and the ACGF of xt follows directly. This approach is no longer applicable when the Euler equation is approximated using a fully nonlinear method (the models are solved using orthogonal collocation with Chebyshev polynomials). Another procedure is needed to compare Ay(z) to Ax(z) in order to derive Γj(ω) and ϒkj(ω).
We propose the following procedure inspired from Smith (1993) and Gouriéroux, Monfort, and Renault (1993). Once we obtain the solution, we simulate our nonlinear model for the variables we are interested in. Then, as Ellison and Scott (2000), we use these simulated series to evaluate Ax. Practically, we estimate a VAR on each vector of simulated series, then we compute the implied ACGF. The operation is repeated 500 times for series of 200 points long. Next, we take the average ACGF among the 500 replications to compare it with the data. A similar VAR is estimated on empirical data. We impose the same lengths for empirical and theoretical data and the same number of lags in VARs.
The VAR's specification is inspired from Campbell and Ammer (1993). We adapt their forecasting VAR by building a vector autoregression for stocks returns, long-term bond returns, consumption growth, dividends growth, and the real rate of interest. Estimates are realized over the period 1952–1998, using quarterly data. In following Campbell and Ammer (1993), we try to limit the arbitrary aspect of the choice of the variables integrated in the VAR. Then, given the final VAR specification we have checked that the spectral behavior derived from the VAR model was robust to its specification by using an alternative estimation method based on the Bartlett method.
APPENDIX B
So as to define our macroeconomic and financial variables, we start from the following time-series:
[1]: consumption of durable goods;
[2]: consumption of nondurable goods;
[3]: consumption of services;
[4]: private fixed investment;
[5]: civilian population over 16;
[6]: total gross real return on stocks;
[7]: real dividend;
[8]: three-month treasury bill real rate;
[9]: ten-year treasury yields.
Quarterly data [1], [2], [3], [4], and [5] are taken from the Stock and Watson database over the period 1952(1)–1998(1). We then define the aggregate series:

Notice that public expenditures are excluded from our definition of c, x, and y.
Quarterly financial data [6], [7], [8], and [9] cover the period 1947(1)–1999(1). These data were kindly furnished by John Y. Campbell. [8] is a quarterly series constructed by selecting the data corresponding to the last month of the quarter. Bond return are calculated from yields using the par-bond approximation given in Campbell, Lo, and MacKinlay (1997), Chapter 10, equation (10.1.19).
This paper has benefited from constructive comments from Julien Matheron, Tristan-Pierre Maury, and Fabien Tripier, and Gilbert Abraham-Frois, and Christian Bidard. Two referees also provided valuable criticism and suggestions that have led to significant improvements in the paper. All remaining errors are mine.