

Introduction
The diversity of domestic cattle reflects millennia of artificial breeding, selection and geographic separation, which have led to a broad spectrum of phenotypes (Hanotte et al., Reference Hanotte, Bradley, Ochieng, Verjee, Hill and Rege2002). Since the introduction of modern farming in the eighteenth century, an erosion of genetic diversity has taken place in livestock (Tapio et al., Reference Tapio, Värv, Bennewitz, Maleviciute, Fimland, Grislis, Meuwissen, Miceikiene, Olsaker, Viinalass, Vilkki and Kantanen2006). A few high-performance cattle breeds have been utilized in the industrial farming system, where selective breeding and assisted reproduction have resulted in an overall loss of genetic variability (Kantanen et al., Reference Kantanen, Olsaker, Holm, Lien, Vilkki, Brusgaard, Eythorsdottir, Danell and Adalsteinsson2000; Taberlet et al., Reference Taberlet, Valentine, Rezaei, Naderi, Pompanon, Negrini and Ajmone-Marsan2008).
The indigenous breeds are – in contrast to the highly selected commercial breeds – exposed to lower selection pressures. They have been subjected to local use and traditional husbandry management, and have – as a group – generally maintained a large pool of genetic variability, despite their small population sizes (Tapio et al., Reference Tapio, Värv, Bennewitz, Maleviciute, Fimland, Grislis, Meuwissen, Miceikiene, Olsaker, Viinalass, Vilkki and Kantanen2006). As a consequence, there are high levels of phenotypic variation among indigenous breeds, a variety of adaptations to local environmental conditions and high fitness under natural conditions (Tapio et al., Reference Tapio, Värv, Bennewitz, Maleviciute, Fimland, Grislis, Meuwissen, Miceikiene, Olsaker, Viinalass, Vilkki and Kantanen2006; Dalvit et al., Reference Dalvit, Marchi, Zotto, Zanetti, Meuwissen and Cassandro2008). They represent a unique genetic resource, and can potentially contribute genetic diversity beneficial for meeting present and future breeding objectives (Sørensen, Sørensen and Berg, Reference Sørensen, Sørensen and Berg2005; Toro, Fernández and Caballero, Reference Toro, Fernández and Caballero2009). At present, a high number of indigenous breeds have low effective population sizes (N e) and are listed as at risk by the Food and Agriculture Organization of the United Nations (FAO, Reference Rischkowsky and Pilling2007). Understanding the variability, genetic structure and breeding units of indigenous breeds is important for conserving them in the most sustainable way (Taberlet et al., Reference Taberlet, Valentine, Rezaei, Naderi, Pompanon, Negrini and Ajmone-Marsan2008; Toro, Fernández and Caballero, Reference Toro, Fernández and Caballero2009).
In Denmark, the Danish livestock industry has focused on the commercial Holstein and Jersey breeds (Sørensen, Sørensen and Berg, Reference Sørensen, Sørensen and Berg2005; Taberlet et al., Reference Taberlet, Valentine, Rezaei, Naderi, Pompanon, Negrini and Ajmone-Marsan2008). As a consequence, indigenous breeds such as the Red Danish, Agersoe Cattle and the Jutland breed have been neglected. These breeds have suffered significant declines in population sizes, prompting concern about their long-term genetic viability (Danish Ministry of Food, Fisheries and Agriculture, 2008).
One indigenous breed that has been maintained through the efforts of private collectors is the Jutland breed. It presumably originated from black- and grey-pied cattle and was widespread in Denmark in the eighteenth century, mainly on the Jutland peninsula (Kantanen et al., Reference Kantanen, Olsaker, Holm, Lien, Vilkki, Brusgaard, Eythorsdottir, Danell and Adalsteinsson2000; Negrini et al., Reference Negrini, Nijman, Milanesi, Moazami-Goudarzi, Williams, Erhardt, Dunner, Rodellar, Valentini, Bradley, Olsaker, Kantanen, Ajmone-Marsan and Lenstra2007; Danish Ministry of Food, Fisheries and Agriculture, 2010; Withen et al., Reference Withen, Brüniche-Olsen, Pedersen and Gravlund2011). Since then it has experienced a drastic decline in population size and is now classified as endangered (FAO, 2007). Estimated from unequal sex ratios (Hedrick, Reference Hedrick2002, equation 6.6a), the effective population size of the Jutland breed was estimated at 40 out of a census size of ~350 individuals in 2007 (http://dad.fao.org). This is similar to the effective population size of commercial Danish breeds: Danish Holstein (N e = 49), Danish Jersey (N e = 53) and Danish Red (N e = 47) (Sørensen, Sørensen and Berg, Reference Sørensen, Sørensen and Berg2005). As these breeds have considerably larger population sizes of 560 000 to 3 700 000 individuals (Sørensen, Sørensen and Berg, Reference Sørensen, Sørensen and Berg2005), they are not classified as endangered (http://iuncredlist.org).
Before the introduction of modern farming, the Jutland breed was used in both dairy and beef production under traditional usbandry management. In the eighteenth–twentieth century, there was a large export, of mainly steers, to the North German market (Danish Ministry of Food, Fisheries and Agriculture, 2010). In 1881, the first herd book was published and in 1950 part of the breed was crossed with black-pied cattle from Holland and Germany to form the Danish Black-Pied. A few private collectors continued to breed the original Jutland breed, and the breed currently consists of four main herds and a number of herds of smaller size, which have been separated for at least the last five decades without admixture from other breeds (S. Benzon, personal communication). A management strategy for the breed is currently being planned on the basis of the present survey.
We used 737-bp of the mitochondrial DNA (mtDNA) control region and 23 microsatellites to estimate genetic diversity and structuring within the Jutland breed. To elucidate the genetic relationship between the Jutland breed and breeds which may have been admixed with it, we included microsatellite data from the following six breeds: the German Black-Pied (N e = 172) (H. Simianer, personal communication), Dutch Belted (N e = 136), Dutch Friesian (N e = 225), Groningen White-Head (N e = 149), Meuse–Rhine–Yssel (N e = 689) and the Danish Black-Pied (N e = 4). Effective population sizes were estimated from unequal sex ratios (Hedrick, Reference Hedrick2002, equation 6.6a) based on data from FAO's Domestic Animal Diversity Information System (http://dad.fao.org).
Materials and methods
Samples
Blood and tissue samples were collected between 1997 and 2007 from 207 registered Jutland breed animals. Four main herds were sampled: Kortegaard (n = 21), Vesterboelle (n = 28) and Westergaard (n = 22) all from Northern Jutland, and Oregaard from Funen (n = 82), in addition to 54 animals from smaller herds consisting of one to four animals, mainly from Jutland. The animals were selected to be as unrelated as possible (avoiding siblings and parent/offspring) according to the Danish Register for Livestock. Due to difficulties in amplifying mtDNA and microsatellites for a number of samples, not all animals were represented in every analysis.
Dr H. Lenstra from the European Cattle Genetic Consortium (ECGC) kindly provided microsatellite data from the Danish Black-Pied (n = 44), the German Black-Pied (n = 20) and four Dutch cattle breeds: Dutch Belted (n = 24), Dutch Friesian (n = 34), Groningen White-Head (n = 25) and the Meuse–Rhine–Yssel (n = 39). The ECGC dataset is based on 30 microsatellite loci, which are recommended by the International Society for Animal Genetics (ISAG) and FAO. The loci are unlinked and neutral, and widely used in genetic studies of cattle. All samples were collected in 1999. Unfortunately mitochondrial data were not available for these breeds.
In the following, we use herds to refer to the analysis of the four main herds. The term breeds is used in reference to the comparative analysis between the Jutland breed and the six black-pied breeds.
DNA extraction
DNA was extracted and purified from 100 µl blood or 20 mg tissue samples according to the DNeasy Blood & Tissue Kit (Qiagen) following the manufacturer's protocol and was stored at −20 °C in the laboratory.
MtDNA
The control region (d-loop) of the mtDNA was amplified in PCR using two flanking primers 5′-CTGCAGTCTCACCATCAACC-3′ (Loftus et al., Reference Loftus, Maghugh, Bradley, Sharp and Cunningham1994) and 5′-AGAGTTAACAGGAAGGCTGG-3′ (Kim et al., Reference Kim, Lee, Lee and Yang2003). The amplification was performed in a 25 µl volume PCR containing 1 µl purified DNA, 1 × PCR buffer, 1.5 mM MgCl2, 1 µM of each primer, 2 µM of each dNTP and 1 unit Taq polymerase (Thermo Scientific). The following cycling conditions were used: 2 min at 94 °C; 35 cycles of 1 min at 94 °C; 1 min at 57 °C; 1 min at 72 °C and a final extension for 10 min at 72 °C. PCR blanks were always included and remained negative throughout. Purification of PCR products was performed with Invisorb Vacuum Manifold kit (Invisorb) following the manufacturer's protocol. The PCR product was run on a 2 percent agarose-gel and verified afterwards.
Sequencing was performed using ABI Prism®BigDye Terminator version 3.1 Cycle Sequencing Kit (Applied Biosystems) in a 10 µl volume containing 1 µl DNA template and 10 µl HiFi. Two primer pairs were used in the sequencing 5′-CTGCAGTCTCACCATCAACC-3′ (Loftus et al., Reference Loftus, Maghugh, Bradley, Sharp and Cunningham1994), 5′-CGAGATGTCTTATTTAAGAGG-3′ (Cymbron et al., Reference Cymbron, Loftus, Malheiro and Bradley1999), 5′-CGCTCCGGGCCCATAAACCG-3′ and 5′-GCCTGCGTTTATATATTGAC-3′ (Withen et al., Reference Withen, Brüniche-Olsen, Pedersen and Gravlund2011). The fragments of 597 and 588-bp, respectively, overlapped resulting in a 737-bp sequence. Cycle sequencing products were purified prior to separation on a 5 percent denaturing polyacrylamide gel in an ABI Prism®377 DNA sequencer (Applied Biosystems) using the DyeEx 2.0 Spin kit (Qiagen).
The two mtDNA sequence fragments were assembled and edited in SEQUENCHER version 4.8 (Gene Code Cooperation) and for each individual a consensus sequence was composed using the bovine mtDNA reference sequence (Anderson et al., Reference Anderson, de Bruijn, Coulson, Eperon, Sanger and Young1982; accession no. NC_00156, GenBank). The sequences were aligned in SE-AL version 2.0a11 (Rambaut, Reference Rambaut1996) and formatted in CLUSTALX version 2.0.7 (Larkin et al., Reference Larkin, Blackshields, Brown, Chenna, McGettigan, McWilliam, Valentin, Wallace, Wilm, Lopez, Thompson, Gibson and Higgins2007).
Microsatellites
Thirty unlinked microsatellite loci were genotyped for each sample as recommended by the ISAG and FAO. StockMarks® Horse and Cattle Paternity PCR Typing Kit (Applied Biosystems) were used for 11 of the markers: TGLA227 (18), BM2113 (2), TGLA53 (16), ETH10 (5), SPS115 (15), TGLA126 (20), TGLA122 (21), INRA23 (12), ETH3 (19), ETH225 (9) and BM1824 (1), numbers in parentheses indicate chromosome location (http://www.thearkdb.org/arkdb). The PCR was run, using 1 µl DNA template, according to the manufacturer's protocol with all 11 markers amplified in one PCR reaction (Supplementary Table S1). Sequencing was done on an ABI Prism®BigDye terminator version 3.1 Cycle Sequencing Kit (Applied Biosystems) in a 13 µl volume containing 1 µl DNA, 11.5 µl HiDi-formamid and 0.5 µl Rox500.
The remaining nineteen markers: INRA063 (18), INRA005 (12), ILST005 (10), HEL5 (21), HEL1 (15), INRA035 (16), ETH152 (5), HEL9 (8), CSSM66 (14), INRA032 (11), HEL13 (11), INRA037 (10), BM1818 (23), ILST006 (7), MM12 (9), CSRM60 (10), ETH185 (17), HAUT24 (22) and HAUT27 (26) were amplified with QIAGEN® Multiplex PCR Kit (Qiagen) in six reactions with unique PCR conditions following the manufacturer's protocol using 1 µl DNA as the template. The reactions were combined in three groups and took place in 96-well microtitre plates with 1 µl DNA in 13 µl volume (Supplementary Table S1). All loci were sequenced on an ABI Prism®BigDye terminator version 3.1 Cycle Sequencing Kit (Applied Biosystems) in a 10 µl volume containing 2 µl DNA template, 7.5 µl HiDi-formamid and 0.5 µl Rox500. To be able to compare our data with the ECGC dataset, we standardized our microsatellite data to the ECGC data by including ECGC reference DNA in our sequencing and scoring our samples accordingly.
Statistical methods
Validation of microsatellite data
The microsatellite loci were checked for possible allelic stuttering, allele drop out and null alleles in MICRO–CHECKER version 2.2 (Van Oosterhout et al., Reference Van Oosterhout, Hutchinson, Wills and Shipley2004), which resulted in elimination of the following seven loci: TGLA227, TGLA122, INRA32, BM1818, INRA35, BM2113 and ETH185, yielding a total of 23 loci.
Genetic diversity
Quantification of mtDNA genetic variation was estimated in DNASP version 5.0 (Rozas et al., Reference Rozas, Sanchéz-DelBarrio, Messeguer and Rozas2003) as haplotype (H) and nucleotide (π) diversity according to Nei (Reference Nei1987) along with Tajima (Reference Tajima1989) to test for selection. Haplogroup relationship (T, T1, T2 and T3) for each sequence was determined according to Troy et al. (Reference Troy, Machugh, Bailey, Magee, Loftus, Cunningham, Chamberlain, Sykes and Bradley2001). JMODELTEST version 0.1.1 (Posada, Reference Posada2008) was used to find the substitution model that best fitted the observed data based on the Akaike Information Criterion constrained to compute likelihood scores only for models available in ARLEQUIN version 3.11 (Excoffier, Laval and Schneider, Reference Excoffier, Laval and Schneider2005). A median-joining network (Bandelt, Foster and Röhl, Reference Bandelt, Foster and Röhl1999) was constructed in NETWORK version 4.5.1.6 (http://www.fluxus-engineering.com) using the default settings.
Basic microsatellite diversity indices; mean number of observed alleles (A O), observed (H O) and unbiased expected (UH E) heterozygosities and numbers of private alleles (A P), were estimated in GENALEX version 6.3 (Peakall and Smouse, Reference Peakall and Smouse2006). Fixation indexes (f) and significant deviation from Hardy Weinberg Equilibrium (HWE) were estimated in GENODIVE version 2.0b17 (Meirmans and Van Tienderen, Reference Meirmans and Van Tienderen2004), each tested for significance by 999 permutations. In GENEPOP version 3.4 (Raymond and Rousset, Reference Raymond and Rousset1995) significant deviations from linkage equilibrium (LE), was estimated for each locus pair using Fishers Exact Test based on 104 batches with 105 de-memorizations and 105 permutations per batch resulting in standard error <0.03 followed by sequential Bonferroni correction to reduce type 1 errors.
Genetic differentiation
Haplotype differentiation, defined as ФST (Weir and Cockerham, Reference Weir and Cockerham1984), was estimated in ARLEQUIN applying Tamura and Nei's substitution model (Tamura and Nei, Reference Tamura and Nei1993). Genetic differentiation, defined as F ST (Weir and Cockerham, Reference Weir and Cockerham1984), based on microsatellite data was estimated in GENODIVE version 2.0b17, and tested for significance with 103 permutations followed by Bonferroni correction. Reynold's genetic distance (D R) was estimated using ARLEQUIN with 103 permutations to test for significance. The results were visualized as a NeighborNet in SPLITSTREE version 4.10 (Huson and Bryant, Reference Huson and Bryant2006).
Genetic structure
Structuring was estimated in STRUCTURE version 2.2 (Pritchard, Stephens and Donnelly, Reference Pritchard, Stephens and Donnelly2000) based on an admixture model with no prior information. A burn-in of 104 iterations followed by an Markov Chain Monte Carlo (MCMC) of 105 iterations for each value of K (K = 1–12) was applied, with five repetitions for each K. The most likely number of clusters was determined following the delta-K method (Evanno, Regnaut and Goudet, Reference Evanno, Regnaut and Goudet2005) in STRUCTURE HARVESTER version 0.56.3 (Earl, Reference Earl2009). CLUMPP (Jakobsson and Rosenberg, Reference Jakobsson and Rosenberg2007) was applied to permute membership matrices across replicates and generate a mean permuted matrix for a given value of K. The results were displayed using DISTRUCT (Rosenberg, Reference Rosenberg2004).
Assignment test was performed in GENALEX version 6.3 based on the “leave one out” option. The individual of interest was removed from the dataset prior to estimating the population genotype frequencies. The smaller herds were treated as unknown samples when assigned to populations and therefore not influencing the population genotype frequency estimates.
Gene flow
Pairwise gene flow rates were estimated in BAYESASS+ version 1.3 (Wilson and Rannala, Reference Wilson and Rannala2003). The programme uses an MCMC algorithm to estimate recent gene flow assuming low levels of migration (<1/3 of the population total in each generation) and linkage equilibrium among loci. The method infers recent migration rates from the observed disequilibrium among genotypes in the population, generated by novel multi-locus genotypes introduced by migrants or individuals recently descended from migrants. BAYESASS+ may be applied to non-stationary populations that are far from HWE. We used a burn-in of 106 iterations followed by an MCMC of 4 × 10⁶ iterations with a sampling frequency of 2 × 10³. Delta values were set to 15 for allele frequency, migration rate and inbreeding level. To test for convergence, the programme was run with two different “seed” values (10 and 103). The results were examined in R ver. 2.12.2 (R Development Core Team, 2011) using the BOA package (Smith, Reference Smith2007). Convergence was assumed when no significant difference was found between the mean of the first 10 percent of the chain and the mean of the last 50 percent (Geweke, Reference Geweke1992).
Results
Genetic diversity
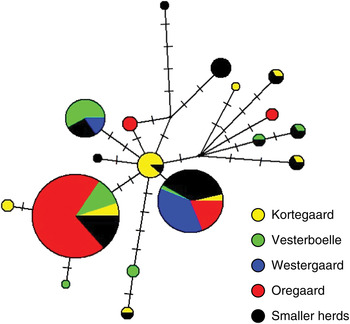
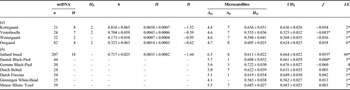
The mtDNA analysis yielded 207 sequences of 737-bp (accession no. JQ234675–JQ234881). All haplotypes belong to the T3 haplogroup. There were 29 variable sites, resulting in 18 haplotypes. No sign of selection was detected (Table 1), which is consistent with expectations for this region (Anderson et al., Reference Anderson, de Bruijn, Coulson, Eperon, Sanger and Young1982; Tajima, Reference Tajima1989). Half of the haplotypes were shared among several herds with the most frequent found in 46 percent of the individuals (Figure 1). The overall haplotype diversity (H) was 0.72 and ranged from 0.17 in Westergaard to 0.81 in Kortegaard. The nucleotide diversity (π) was 0.0035 and varied from 0.0007 in Westergaard to 0.0043 in Vesterboelle (Table 1a).
Median-joining network of the 18 mitochondrial haplotypes found in the Jutland breed. Each circle corresponds to a haplotype and the relative size of the circle represents the haplotype frequency. Substitutions are indicated with bars on the branches.

Summary statistics of (a) the four main herds within the Jutland breed based on mtDNA and microsatellites and (b) the black-pied breeds based on microsatellites.

MtDNA information based on 737 bp includes number of haplotypes (H), number of private haplotypes (H P), haplotype diversity (h), nucleotide diversity (π) and Tajima's D (D). Information from the 23 microsatellite loci includes mean number of alleles (A O), number of private alleles (A P), observed heterozygosity (H O), unbiased expected heterozygosity (UH E), inbreeding coefficient (f) and number of significant pairwise linkage disequilibria (LE). *Indicates p < 0.05.
The 23 microsatellite loci had 149 alleles in total, ranging from two alleles (ILST005) to 12 alleles (TGLA53) per locus. The observed heterozygosity (H O) was 0.555–0.656 and mean number of alleles (A O) was 4.6–4.8 per locus in the four herds, each having seven to eight unique alleles (A P). Vesterboelle showed a significant excess of heterozygotes compared to HWE (Table 1a). Non-random association among loci (LE) was found in all herds (Table 1a). The smaller herds had LE = 48, which resulted in LE = 60 in the Jutland breed (Table 1b).
The observed heterozygosity (H O) was 0.611 for the Jutland breed and 0.565–0.722 for the other breeds with a mean number of alleles (A O) of 6.5 and 4.1–5.7, respectively (Table 1b). Unique alleles (A P = 1–8) were found in all breeds except for Groningen White-Head. Deviations from HWE were found in the Jutland breed and the Danish Black-Pied, which both showed an excess of homozygotes (Table 1b). Linkage disequilibrium (LE = 1–5) was found among pairs of loci in the Danish Black-Pied and all Dutch breeds. The Jutland breed had the highest amount (LE = 60) (Table 1b).
Genetic differentiation
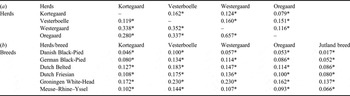
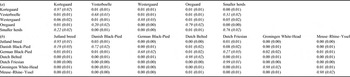
All pairwise mtDNA ΦST comparisons among the herds revealed significant differentiation (Table 2a). Kortegaard and Vesterboelle were found to be the least differentiated, and Oregaard and Westergaard the most highly differentiated herds based on mtDNA. All pairwise microsatellite F ST comparisons were also significant, but in contrast to the mtDNA data, the microsatellite data showed Kortegaard and Oregaard as the least differentiated herds, and Kortegaard and Vesterboelle as the most differentiated.
Pairwise estimates of genetic differentiation among (a) the four herds and (b) the Jutland breed and the black-pied breeds.

Values based on (a) pairwise comparisons of 737 bp mtDNA (ΦST) under the diagonal and 23 microsatellite loci (F ST) above the diagonal and (b) 23 microsatellite loci (F ST). All values from the microsatellite analysis are based on 103 permutations. *Indicates p < 0.05.
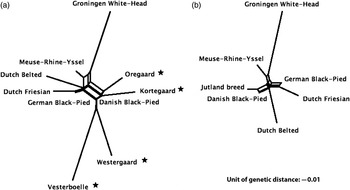
The genetic differentiation (F ST) and genetic distance estimates (D R) revealed significant genetic differentiation between herds and breeds (Table 2b and Figure 2a). All four herds were more closely related to the Danish and German Black-Pied than they were to each other. Overall, the Jutland breed was closely related to the Danish- and German Black-Pied breeds (Table 2b and Figure 2b).
NeighborNets based on genetic distances (D R) among (a) the four main Jutland breed herds (marked with a star) and the black-pied breeds, and (b) the entire Jutland breed and the black-pied breeds. The NeighborNets are based on 23 microsatellite loci.

Genetic structure
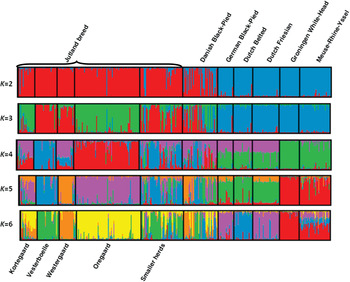
Clear population structure was found among herds and among breeds (Figure 3). The distinction of the Jutland breed and the German and Dutch breeds was found throughout. The herds showed structure for lower values of K than the breeds. The most likely number of clusters was three (ΔK = 455), which divided the samples into three groups: (1) Kortegaard, Oregaard and the smaller herds, (2) Vesterboelle and Westergaard and (3) the German and Dutch breeds. The Danish Black-Pied showed membership coefficients in all three groups (Figure 3).
Estimated population structure among the Jutland breed herds and the black-pied breeds based on 23 microsatellite loci. Black vertical lines divide individuals into breeds, as indicated above the figure, and herds as indicated below the figure.

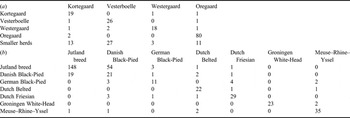
The assignment test showed that the majority of individuals from the four main herds were assigned to their herd of origin (Table 3a). The smaller herds assigned primarily to Kortegaard, Vesterboelle and Oregaard (Table 3a). The majority of individuals from the breeds were assigned to their breed of origin, except for the Danish Black-Pied, where half of the individuals were assigned to the Jutland breed (Table 3b).
Assignment of individuals to (a) herds and (b) breeds. Rows represent the herd/breed of origin. Columns represent the herd/breed to which an individual is assigned.

Assignment test are based on the “leave one out” option, where the individual of interest is removed from the dataset prior to estimating the population genotype frequencies.
Gene flow
Gene flow among the herds (Table 4a) was high (m > 0.10) from Kortegaard to the smaller herds, from Vesterboelle to Oregaard, and from the smaller herds to Vesterboelle. All other gene flow rates were low (m < 0.10) among the herds.
Estimates of gene flow rates (m) among (a) the Jutland breed herds and (b) the black-pied breeds.

Migration rates (m) into each population are shown with standard errors (SE) given in parentheses. Rows represent the population from which each individual was sampled, and columns represent the populations from which they migrated. Diagonal values represent the proportions of individuals derived from the source populations in each generation. Migration rates ≥0.10 are in italics.
Two gene flow rates were high (m > 0.10) among the breeds (Table 4b), from the Jutland breed to the Danish Black-Pied and from the Dutch Friesian to the German Black-Pied. Low gene flow rates (m < 0.10) were found among the rest of the breeds (Table 4b).
Discussion
Genetic diversity of the Jutland breed
This study reveals the Jutland breed as a highly structured breed that is significantly differentiated from other related breeds, which make it a valuable reserve of genetic variation for both the indigenous and commercial breeds. The Jutland breed has high genetic diversity (Table 1). All haplotypes belong to the common T3 haplogroup and most are shared among multiple herds (Figure 1). T3 is the most common haplogroup in Europe, and we found no evidence of introgression of breeds of the T, T1 or T2 haplogroups, which are more prevalent in the Middle East, Anatolia and Africa (Troy et al., Reference Troy, Machugh, Bailey, Magee, Loftus, Cunningham, Chamberlain, Sykes and Bradley2001).
The haplotype diversity is higher than that observed in other indigenous Danish breeds (Withen et al., Reference Withen, Brüniche-Olsen, Pedersen and Gravlund2011). This corresponds well with their history of being widely used for local husbandry and not commercial selected breeding (Tapio et al., Reference Tapio, Värv, Bennewitz, Maleviciute, Fimland, Grislis, Meuwissen, Miceikiene, Olsaker, Viinalass, Vilkki and Kantanen2006; Dalvit et al., Reference Dalvit, Marchi, Zotto, Zanetti, Meuwissen and Cassandro2008). The level of genetic variation (H O) is similar to that found in the Northern European black-pied breeds (Table 1); despite the Jutland breeds considerably lower effective population size as compared with the German and Dutch breeds. Different microsatellite loci have been applied to studies of genetic diversity in other cattle breeds, which makes direct comparisons of results complicated. However, based on data sets that have analysed a large number of same loci, the Jutland breed shows a level of genetic diversity comparable with the observed heterozygosity and mean allele number reported in other indigenous European cattle breeds (Kantanen et al., Reference Kantanen, Olsaker, Holm, Lien, Vilkki, Brusgaard, Eythorsdottir, Danell and Adalsteinsson2000; Tapio et al., Reference Tapio, Värv, Bennewitz, Maleviciute, Fimland, Grislis, Meuwissen, Miceikiene, Olsaker, Viinalass, Vilkki and Kantanen2006; Dalvit et al., Reference Dalvit, Marchi, Zotto, Zanetti, Meuwissen and Cassandro2008; Withen et al., Reference Withen, Brüniche-Olsen, Pedersen and Gravlund2011).
The small size of each herd – during at least the last five decades – is expected to lead to a reduction in genetic variation and an increase in levels of inbreeding (Reed and Frankham, Reference Reed and Frankham2003). Historically the herd sizes are expected to have been larger when the Jutland breed was widespread (Kantanen et al., Reference Kantanen, Olsaker, Holm, Lien, Vilkki, Brusgaard, Eythorsdottir, Danell and Adalsteinsson2000; Negrini et al., Reference Negrini, Nijman, Milanesi, Moazami-Goudarzi, Williams, Erhardt, Dunner, Rodellar, Valentini, Bradley, Olsaker, Kantanen, Ajmone-Marsan and Lenstra2007; Withen et al., Reference Withen, Brüniche-Olsen, Pedersen and Gravlund2011). We did not observe significant levels of inbreeding in Kortegaard, Westergaard and Oregaard. Unfortunately, we do not have historic data to address whether a change in inbreeding and genetic diversity has taken place. As of now, these three herds can be seen as stable.
Vesterboelle shows signs of out-breeding (Table 1a). This might in part be ascribed to introgression from a Dutch-born grey-pied bull of unknown origin, which has been used extensively in the breeding programme of this herd (Dalsgaard, Reference Dalsgaard2001). Vesterboelle's small population size and the extensive introgression are expected to lead to deviations from HWE (Hedrick, Reference Hedrick2002). The introgression has most likely led to the distinctness of the herd, based on microsatellite markers (Table 2a and b). Unfortunately, we did not have genetic samples from the grey-pied bull, so we can only speculate that the introgression might have led to the observed pattern. The bull's origin must be of a breed, which was not included in this analysis, as Vesterboelle is distinct from the analysed breeds (Table 2b; Figures 2a and 3).
The high haplotype diversity found in Kortegaard and Vesterboelle may be due to high diversity of the founder females. In contrast, the lower haplotype diversity observed in Westergaard and Oregaard suggests high relatedness among the founder females. This is most pronounced in Westergaard, which showed very low levels of haplotype variation (Table 1a). The high number of haplotypes of low frequency was probably a remnant of a historically larger genetic diversity from a time when the breed was more abundant (Figure 1).
Impacts of restricted breeding
All results suggest the four main herds represent distinct units (Tables 1a, 2a and 4a; Figures 2a and 3). The contrast of low levels of linkage disequilibrium in each herd (0–2 percent) and high linkage disequilibrium in the Jutland breed (24 percent), with the smaller herds being the main contributor (16 percent), suggests the Wahlund effect (Wahlund, Reference Wahlund1928) when grouping the herds (Table 1b). This is supported by the genetic distances among herds (Table 2a; Figure 2a), assignment of individuals almost exclusively to the herd of origin (Table 3a) and the clustering patterns (Figure 3). These findings correspond with the history of the breed, and the presumed separation of the four herds for at least the past 50 years, with only low levels of admixture (Table 3a).
The limited gene flow – among most of the herds – has resulted in genetic drift and resulting high level of differentiation among them (Table 4a) (Fernández, Toro and Caballero, Reference Fernández, Toro and Caballero2008; Toro, Fernández and Caballero, Reference Toro, Fernández and Caballero2009). This is well known from other small breeds (Kantanen et al., Reference Kantanen, Olsaker, Holm, Lien, Vilkki, Brusgaard, Eythorsdottir, Danell and Adalsteinsson2000; Withen et al., Reference Withen, Brüniche-Olsen, Pedersen and Gravlund2011). The high level of differentiation among herds (Figure 2a) may be due to a separation time longer than five decades (S. Benzon, personal communication).
The joint grouping of (1) Kortegaard and Oregaard and (2) Vesterboelle, Westergaard and a large number of individuals from the smaller herds could reflect the hierarchical structuring of the Jutland breed (Figure 3; K = 3). As the number of clusters increases it becomes evident that Vesterboelle, Westergaard and Oregaard are genetically distinct, whereas Kortegaard share genotypes with each of them (Figure 1; K = 4, 5, 6). In accordance with their history of originating from the main herds, the smaller herds represent the genetic diversity found in the four herds (Table 3a; Figures 1 and 3). Their resemblance to the German and Dutch breeds (Figure 3) and the unique haplotypes are most likely the result of minor introgression from these (Figure 1).
Genetic relationship among the black-pied breeds
Overall, the breeds are less differentiated than the herds (Table 2b) and have a higher level of gene flow (Table 4b), this is expected when accounting for genetic drift and differences in population size (Reed and Frankham, Reference Reed and Frankham2003). The Dutch breeds – and to a lesser extent the German Black-Pied – are distinct from the Jutland breed (Tables 2b and 4c; Figures 2b and 3b). Information on historic exchange of animals among the countries is limited; our results indicate that there has been limited exchange of animals between the breeds (Table 4b).
The putative origin of the Danish Black-Pied as a mix between the Jutland breed and black-pied cattle from Holland and Germany (Danish Ministry of Food, Fisheries and Agriculture, 2010) is supported by several of our analyses (Tables 3b and 4b; Figure 3), with the Jutland breed being by far the largest contributor (Tables 3b and 4b; Figure 3). All four herds have contributed almost equally with genetic material to the Danish Black-Pied breed (Table 2b; Figure 3), which is likely to have contributed to the observed Wahlund effect within this breed (Table 1b).
Management of a subdivided breed
The management of a subdivided breed, such as the Jutland breed, implies a compromise of two main factors: (1) maintenance of the highest possible levels of genetic diversity and (2) conservation of unique herd characteristics (Toro and Caballero, Reference Toro and Caballero2005). The two factors can be achieved if the four main herds are kept completely isolated. However, this will result in an increase in herd inbreeding levels, which can compromise their short-term survival (Reed and Frankham, Reference Reed and Frankham2003; Taberlet et al., Reference Taberlet, Valentine, Rezaei, Naderi, Pompanon, Negrini and Ajmone-Marsan2008). Alternatively, the herds could be united as one large breeding unit. The trade-off would be loss of genetic diversity, washing out singularity of the herds and a long-term decrease in effective population size (Toro and Caballero, Reference Toro and Caballero2005).
We propose a management strategy where the herds are managed separately, but with an increased amount of gene flow among them, to avoid further genetic drift. A minimum of one migrant per herd per generation has been shown to counteract the detrimental effects of genetic drift (Fernández, Toro and Caballero, Reference Fernández, Toro and Caballero2008; Toro, Fernández and Caballero, Reference Toro, Fernández and Caballero2009). To conserve the uniqueness of the Jutland breed, introgression from the German and Dutch Black-Pied breeds should be avoided.
Conclusion
Losses of indigenous cattle breeds are happening at a high rate worldwide, and FAO has recommended immediate action should be taken to conserve local cattle breeds and possible valuable genetic variation (FAO, 2007b). Our characterization of the indigenous Danish cattle breed; the Jutland breed, shows it to be a valuable reservoir of unique genetic variation. Our results further demonstrate the rapid diversification of the Jutland breed herds due to limited gene flow and genetic drift. The Jutland breed has experienced limited introgression from related Northern European black-pied breeds. We propose conserving the Jutland breed herds as separate breeding entities with moderate gene flow among the herds. This will assure conservation of the highest possible amount of genetic variation and fitness for future management of the Jutland breed.
Supplementary material
Supplementary online material is available at http://cambridge.journals.org/AGR.
Acknowledgements
We thank the Benzon family for assistance in taking blood samples from their Jutland breed herd and for information on the history of the breed. We thank Dr Johannes A. Lenstra for providing microsatellite data from the six Northern European black-pied breeds and Dr Henner Simianer for information on the German Black-Pied. We thank Natascha Jakobsen, Ruth B. Jakobsen and Pernille S. Olsen for assistance in the laboratory. We also thank Alonzo Alfaro-Núñez and Anthony Ferrari for assistance with translation of the abstract to Spanish and French, respectively, and two anonymous reviewers whose comments significantly helped improve this manuscript. We are grateful for funding support received from the Danish Ministry of Food, Fisheries and Agriculture to perform this work.