




1 Introduction
Understanding of the instability mechanisms of surface waves with or without the presence of a floating/stationary body is of fundamental interest and practical importance in ocean science and marine engineering. A practical example is the observation of stochastic behaviours of the impact pressure on the tank wall caused by steep or overturning sloshing waves in a regularly oscillating tank (e.g. Yung et al. Reference Yung, Standström, He and Minta2010). Characterization and quantification of the sloshing-wave impact pressure in an oscillating tank requires the understanding of the stability of nonlinear sloshing surface waves generated by an oscillating solid boundary including the presence of surface tension. The main objective of this paper is to numerically investigate the instability of progressive surface ring waves generated by vertical oscillation of a surface-piercing axially symmetric body under the influence of gravity and surface tension.
There are extensive studies on the dynamics of free capillary waves (e.g. Milewski, Vanden-Broeck & Wang Reference Milewski, Vanden-Broeck and Wang2010; Wang, Vanden-Broeck & Milewski Reference Wang, Vanden-Broeck and Milewski2014; Pan & Yue Reference Pan and Yue2014; Wang Reference Wang2016) and those generated by a pressure source (Diorio et al. Reference Diorio, Cho, Duncan and Akylas2009, Reference Diorio, Cho, Duncan and Akylas2011; Cho et al. Reference Cho, Diorio, Akylas and Duncan2011; Park & Cho Reference Park and Cho2017) in the absence of floating bodies. The present work studies the dynamics of surface gravity–capillary waves radiated by an oscillating body in an infinite domain. It is motivated by the laboratory experiments of Tatsuno, Inoue & Okabe (Reference Tatsuno, Inoue and Okabe1969), hereinafter TIO, and Taneda (Reference Taneda1991) who observed that the free-surface pattern of surface waves generated by vertical oscillation of a half-submerged sphere varies distinctively as the amplitude or frequency of the oscillation increases beyond a threshold value. Specifically, axisymmetric (or non-axisymmetric) outgoing progressive waves are radiated when the oscillation amplitude/frequency is small (or large). A similar phenomenon was first reported by Faraday (Reference Faraday1831), which was caused by a vertical oscillation of a surface-piercing cylindrical cork in a water basin. Faraday found that the wave field is not axial-symmetric but with ‘ridges’ around the cork. The mechanism governing the pattern change of the radiated progressive waves has not been fully understood yet despite the existence of a substantial amount of research on the stability of wave motions.
There are typically two categories of instability problems of nonlinear waves, for which fundamentally different approaches need to be used in the analysis. In the first category, the base flow can be converted into a steady system by the use of a coordinate system transformation. The instability of Stokes waves is an example of this category. In the second category, the base flow is time-periodic, which cannot be converted into a steady system through coordinate system transformation. The instability of standing waves or progressive waves radiated by body motions belongs to the latter. There has been a great deal of study of the former while the study of the latter is limited. The instability problem addressed in this work belongs to the latter.
The instability analysis of plane propagating waves was first carried out by Benjamin & Feir (Reference Benjamin and Feir1967). They showed that a second-order Stokes wave train is unstable to a small sideband disturbance. By accounting for higher-order effects, Longuet-Higgins (Reference Longuet-Higgins1978a, Reference Longuet-Higgins1978b) extended the instability analysis to a finite-amplitude Stokes wave train. The growth rate of unstable modes obtained by Longuet-Higgins agrees with that of Benjamin & Feir at small wave steepness. When the disturbance is extended to three dimensions, the Stokes wave train is found to be unstable to oblique sideband disturbances (Benney & Roskes Reference Benney and Roskes1969). McLean (Reference McLean1982) generalized the instability analysis of a travelling wave to include broadband disturbances by converting the travelling wave into a steady wave shape in a moving frame. A general form of disturbances is applied to the steady base wave, leading to an eigenvalue problem. The unstable disturbance modes are determined to correspond to the eigenvalues with positive imaginary part. A stability diagram is obtained by varying the disturbance wavenumber and base wave steepness. Two distinguishable unstable regions are found, which are defined as type I and II instabilities. The type I instability is the two-dimensional instability that is dominant in small wave steepness, causing strong wave package modulation during the time evolution. Benjamin–Feir instability belongs to this type. The type II instability is the three-dimensional instability for which unstable three-dimensional disturbances move with the base wave causing the development of distinctive three-dimensional wave patterns during the evolution of a two-dimensional base wave train. These predictions agree well with the experiments in wave basins (Su Reference Su1982) and the direct nonlinear numerical simulations (Xue et al. Reference Xue, Xu, Liu and Yue2001).
For unsteady base waves, such as a standing wave, McLean’s approach becomes invalid. Becker & Miles (Reference Becker and Miles1991) carried out a weakly nonlinear theoretical analysis of the stability of standing waves in an annular tank. For general time-periodic base flows, the so-called transition matrix method can be employed for the instability analysis (Coddington & Levinson Reference Coddington and Levinson1955; von Kerczek & Davis Reference von Kerczek and Davis1976) under the assumption that the disturbance can be expanded into the summation of normal modes at any time. The Floquet theory is then adopted to determine the growth rates, frequencies and shapes of the unstable modes. Mercer & Roberts (Reference Mercer and Roberts1992) used the transition matrix method to analyse the instability of deep water two-dimensional standing waves. Similarly to Stokes waves, the sideband instability is found to be dominant for two-dimensional standing waves. Zhu, Liu & Yue (Reference Zhu, Liu and Yue2003) combined the transition matrix method with a high-order spectral element method to study the instability of standing waves in a rectangular tank to three-dimensional disturbances. They found that the two-dimensional standing wave is generally unstable to three-dimensional disturbances as long as the disturbance wave frequency is close to the base standing wave frequency. Moreover, Zhu et al. (Reference Zhu, Liu and Yue2003) also carried out the instability analysis for three-dimensional standing waves in a circular tank. The dominant instability is found to be due to the sideband instability in which the summation of two frequencies of disturbance waves is close to twice the frequency of the base standing wave.
In the instability analysis of progressive waves that are generated by an oscillating object, a main challenge lies in the determination of homogenous modes required to represent the general disturbances in addition to the computation of nonlinear outgoing base waves. In the context of gravity waves, there does not exist any non-trial homogeneous solution for the wave–body interaction problem involving a body like a surface-piercing sphere (John Reference John1950). When the surface tension effect is accounted for, Shen & Liu (Reference Shen and Liu2019) recently showed through a theoretical analysis the existence of non-trivial solutions of the linearized homogeneous boundary value problem at any frequency. The homogeneous solution is completely determined by the mean free-surface slope at the waterline of the body and physically represents progressive radial cross-waves. For a vertical circular cylinder in deep water, they derived the analytic solution of the cross-wave modes. When the cylinder undergoes a radial expansion–contraction motion in the horizontal plane, they derived an evolution equation governing energy transfer from the radiated progressive ring wave to the subharmonic radial cross-wave due to their triadic resonant interactions, based on a weakly nonlinear analysis by the averaged Lagrangian method. The analysis was applied approximately to the case of high-frequency vertical oscillation of a sphere. The prediction of the threshold value of oscillation amplitude and characteristic features of radial cross-waves agrees qualitatively with TIO’s experimental observation.
Despite these, we point out that in the theoretical analysis of Shen & Liu (Reference Shen and Liu2019), the cross-waves for the case of a half-submerged sphere are obtained by an asymptotic extension of the solution for the vertical circular cylinder case. Furthermore, the analysis uses the linearized ring wave solution that does not include the nonlinear free-surface and body boundary effects. In addition, the analysis does not consider the viscous effect. All of these may contribute to the discrepancies between the theoretical prediction of Shen & Liu (Reference Shen and Liu2019) and TIO’s experimental observations, which will be addressed in this paper. Moreover, the weakly nonlinear analysis shows that the unstable mode shape is given by the linear homogeneous cross-wave solution multiplied by a slowly varying amplitude envelope. This implies that we are unable to expand the unstable modes in terms of linear homogeneous modes only, because the envelope is also a part of the solution that is unknown. As a result, the transition matrix method cannot be applied in the present case. We thus have to rely on the use of direct numerical simulations to examine the instability of finite-amplitude progressive ring waves by a surface-piercing oscillating body.
In this work, we employ direct numerical simulations of nonlinear wave–body interactions by the use of a mixed Euler–Lagrangian (MEL) quadratic boundary-element method (QBEM) in the context of potential flow formulation to study the instability of finite-amplitude progressive ring waves. The ring waves are radiated by a forced vertical harmonic oscillation of a half-submerged sphere in deep water. Both gravity and surface tension effects are included in the simulations. In § 2, we first summarize the mathematical formulation of the nonlinear wave-making problem by an oscillating body. We then describe the direct numerical simulation approach to analyse the instability of general nonlinear time-periodic flows. In § 3, we provide a brief summary of the extension of MEL-QBEM, originally developed for the computation of fully nonlinear gravity wave interaction with a floating three-dimensional body, to include the surface tension effect and the implementation of the far-field Orlanski–Sommerfeld radiation condition. These developments enable us to achieve high-fidelity computation of nonlinear evolution of outgoing gravity–capillary waves produced by an oscillating surface-piercing body. Section 4 contains the convergence tests and validations of the QBEM computations of base ring waves and radial cross-waves. Section 5 presents some basic properties of instability and characteristic features of the unstable cross-waves. We compare the present nonlinear simulation result with the weakly nonlinear theory prediction of Shen & Liu (Reference Shen and Liu2019) in § 6 and the experimental data of TIO in § 7 to illustrate the nonlinear effects of base flow and the viscous effect on the threshold value of sphere oscillation amplitude/frequency beyond which the instability of ring waves occurs. Section 8 shows the dependence of instability on physical parameters such as the initial disturbance phase and shape. The influence of nonlinear interactions of multiple unstable cross-wave modes on the development of distinctive free-surface patterns during long-time evolution of the wave field is investigated in § 9. We finally draw conclusions in § 10.
2 Mathematical formulation
2.1 Problem statement
Definition sketch of the wave radiation problem by a half-submerged sphere of radius  $r_{1}$ which oscillates vertically with an amplitude of
 $a$ at a frequency of
 $2\unicode[STIX]{x1D714}_{0}$ in deep water. A circular cylindrical coordinate (
 $r$,
 $\unicode[STIX]{x1D713}$,
 $z$) system is defined to describe the problem. The fluid domain is represented as
 ${\mathcal{D}}$ that is encircled by the body surface
 $S_{B}$, the free surface
 $S_{F}$, the far-field vertical cylindrical surface
 $S_{\infty }$ at
 $r=r_{2}\gg r_{1}$, and the fictitious deep-water surface
 $S_{0}$.

We consider the hydrodynamic problem of nonlinear capillary–gravity wave interaction with a floating sphere in deep water in the context of potential flow. The problem is depicted in figure 1. The sphere with radius  $r_{1}$ is half-submerged and undergoes a periodic vertical oscillation with amplitude
 $a$ and frequency
 $2\unicode[STIX]{x1D714}_{0}$. At any time
 $t$, the velocity potential
 $\unicode[STIX]{x1D719}(r,\unicode[STIX]{x1D713},z,t)$ that is used to describe the fluid motion satisfies the Laplace equation in the fluid
 ${\mathcal{D}}(t)$,
 $$\begin{eqnarray}\unicode[STIX]{x1D6FB}^{2}\unicode[STIX]{x1D719}=0\quad \text{in }{\mathcal{D}}(t),\end{eqnarray}$$
where  $\unicode[STIX]{x1D735}\equiv (\unicode[STIX]{x2202}/\unicode[STIX]{x2202}r,\unicode[STIX]{x2202}/r\unicode[STIX]{x2202}\unicode[STIX]{x1D713},\unicode[STIX]{x2202}/\unicode[STIX]{x2202}z)$ and
 $t$ represents time. The kinematic and dynamic boundary conditions on the instantaneous free surface
 $S_{F}(t)$ are
 $$\begin{eqnarray}\unicode[STIX]{x1D701}_{t}+\unicode[STIX]{x1D735}\unicode[STIX]{x1D701}\boldsymbol{\cdot }\unicode[STIX]{x1D735}\unicode[STIX]{x1D719}=\unicode[STIX]{x1D719}_{z}\quad \text{on }S_{F}(t)\end{eqnarray}$$
and
 $$\begin{eqnarray}\unicode[STIX]{x1D719}_{t}+\frac{1}{2}\unicode[STIX]{x1D735}\unicode[STIX]{x1D719}\boldsymbol{\cdot }\unicode[STIX]{x1D735}\unicode[STIX]{x1D719}+g\unicode[STIX]{x1D701}+\frac{T_{s}}{\unicode[STIX]{x1D70C}_{w}}\unicode[STIX]{x1D735}\boldsymbol{\cdot }\boldsymbol{n}=0\quad \text{on }S_{F}(t),\end{eqnarray}$$
where  $\unicode[STIX]{x1D701}(r,\unicode[STIX]{x1D713},t)$ denotes the instantaneous elevation of the free surface,
 $g$ is the gravitational acceleration,
 $\boldsymbol{n}$ is the unit normal vector of the free surface pointing out of the fluid,
 $T_{s}$ is the coefficient of surface tension of water (in contact with air) and
 $\unicode[STIX]{x1D70C}_{w}$ is the water density. The boundary condition on the instantaneous sphere surface
 $S_{B}(t)$ is
 $$\begin{eqnarray}\unicode[STIX]{x1D719}_{n}=\unicode[STIX]{x1D709}_{t}n_{z}\quad \text{on }S_{B}(t),\end{eqnarray}$$
where  $\unicode[STIX]{x1D709}(t)$ represents the vertical displacement of the sphere centre, and
 $n_{z}$ is the vertical component of the unit normal of the body surface. In the present study, the sphere is forced in harmonic motion with
 $\unicode[STIX]{x1D709}$ given by
 $$\begin{eqnarray}\unicode[STIX]{x1D709}(t)=a\sin 2\unicode[STIX]{x1D714}_{0}t.\end{eqnarray}$$
In deep water, the fluid motion vanishes
 $$\begin{eqnarray}\unicode[STIX]{x1D735}\unicode[STIX]{x1D719}=0\quad \text{on }S_{0}.\end{eqnarray}$$
The radiation condition is imposed at the far-field surface  $S_{\infty }(t)$, which requires that the generated waves due to body oscillation propagate outwards. In addition, the initial conditions of
 $\unicode[STIX]{x1D719}(r,\unicode[STIX]{x1D713},z,t=0)$ on the free surface
 $\unicode[STIX]{x1D701}(r,\unicode[STIX]{x1D713},t=0)$ and the position
 $\unicode[STIX]{x1D709}(t=0)$ and velocity
 $\dot{\unicode[STIX]{x1D709}}(t=0)$ of the sphere need to be specified.
In the context of gravity waves, the above stated initial boundary value problem is complete, for which a unique solution exists (John Reference John1950) because the homogeneous problem (with linearized free-surface boundary conditions) has a trivial solution only. In the context of gravity–capillary waves, the solution of the stated problem is non-unique because the homogeneous problem (with linearized free-surface boundary conditions) possesses a non-trivial solution which is dependent on the radial slope of the free-surface at the intersection line (often known as the waterline) of the sphere with the free surface (Shen & Liu Reference Shen and Liu2019). A unique solution of the stated problem, which represents outgoing progressive ring waves due to forced vertical sphere oscillation, can be achieved only under the condition of zero radial slope of the free surface on the waterline
 $$\begin{eqnarray}\unicode[STIX]{x1D701}_{r}(r,\unicode[STIX]{x1D713},t)=0\end{eqnarray}$$
for  $0\leqslant \unicode[STIX]{x1D713}<2\unicode[STIX]{x03C0}$ at any time (Rhodes-Robinson Reference Rhodes-Robinson1971; Shen & Liu Reference Shen and Liu2019). In general, the position of the waterline varies with time in the time domain simulation. For small body oscillation amplitude
 $a$, the waterline can be approximated to be fixed at the position
 $r=r_{1}$. For large body oscillation amplitude
 $a$, a numerical procedure described in § 3.2 is employed to determine the waterline position in the nonlinear time-domain simulation. Appendix C describes a numerical approach for the determination of the solution of the linearized homogeneous problem (with
 $\unicode[STIX]{x1D719}_{n}=0$ on the body surface, but
 $\unicode[STIX]{x1D701}_{r}\neq 0$ on the waterline
 $r=r_{1}$) in the frequency domain. The homogeneous solution represents the progressive radial cross-waves.
The purpose of this work is to investigate the stability of the finite-amplitude progressive ring waves (forced by a harmonic vertical sphere oscillation) subject to the small disturbance given in terms of the progressive radial cross-waves including both gravity and surface tension effects.
2.2 Instability-analysis method
We write the governing equation of the above stated nonlinear wave–body interaction problem in symbolic form,
 $$\begin{eqnarray}\frac{\unicode[STIX]{x2202}\boldsymbol{u}}{\unicode[STIX]{x2202}t}={\mathcal{N}}(\boldsymbol{u}),\end{eqnarray}$$
where  ${\mathcal{N}}$ is the nonlinear operator of the problem and
 $\boldsymbol{u}\equiv (\unicode[STIX]{x1D701}(r,\unicode[STIX]{x1D713},t),\unicode[STIX]{x1D719}^{s}(r,\unicode[STIX]{x1D713},t))$ is the solution of the nonlinear problem in which
 $\unicode[STIX]{x1D719}^{s}\equiv \unicode[STIX]{x1D719}(r,\unicode[STIX]{x1D713},z=\unicode[STIX]{x1D701}(r,\unicode[STIX]{x1D713},t),t)$ represents the velocity potential on the free surface.
In a linear stability analysis, we write  $\boldsymbol{u}$ as the sum of a nonlinear base flow
 $\boldsymbol{u}_{0}$ (corresponding to finite-amplitude propagating ring waves) and a small disturbance
 $\boldsymbol{u}^{\prime }$,
 $$\begin{eqnarray}\boldsymbol{u}(r,\unicode[STIX]{x1D713},t)=\boldsymbol{u}_{0}(r,t)+\boldsymbol{u}^{\prime }(r,\unicode[STIX]{x1D713},t),\end{eqnarray}$$
where  $\boldsymbol{u}_{0}$ satisfies the inhomogeneous body-boundary condition (2.4) with the zero radial-slope condition (2.7) while
 $\boldsymbol{u}^{\prime }$ satisfies the homogeneous body-boundary condition
 $\unicode[STIX]{x1D719}_{n}=0$ but with
 $\unicode[STIX]{x1D701}_{r}\neq 0$ on the waterline. Substituting (2.9) into (2.8) then leads to the linearized equation governing the temporal-spatial evolution of the disturbance,
 $$\begin{eqnarray}\frac{\unicode[STIX]{x2202}\boldsymbol{u}^{\prime }}{\unicode[STIX]{x2202}t}={\mathcal{L}}(\boldsymbol{u}^{\prime }),\end{eqnarray}$$
where  ${\mathcal{L}}$ is a linearized time-periodic (variable-coefficient) operator given by the Jacobian of
 ${\mathcal{N}}$ with respect to
 $\boldsymbol{u}$ (evaluated at
 $\boldsymbol{u}_{0}$). For the present problem,
 ${\mathcal{L}}$ has a frequency of
 $2\unicode[STIX]{x1D714}_{0}$ and a period of
 $T_{0}/2$, where
 $T_{0}=2\unicode[STIX]{x03C0}/\unicode[STIX]{x1D714}_{0}$ is the period of the subharmonic.
Since  $\boldsymbol{u}^{\prime }$ is periodic in
 $\unicode[STIX]{x1D713}$, we expand
 $\boldsymbol{u}^{\prime }$ in a Fourier series
 $$\begin{eqnarray}\boldsymbol{u}^{\prime }(r,\unicode[STIX]{x1D713},t)=\mathop{\sum }_{m=0}^{\infty }\overline{\boldsymbol{u}}_{m}^{\prime }(r,t)\cos (m\unicode[STIX]{x1D713}),\end{eqnarray}$$
where, without loss of generality, we consider the cosine series in  $\unicode[STIX]{x1D713}$, and
 $\overline{\boldsymbol{u}}_{m}^{\prime }(r,t)$ represents the amplitude of the
 $m$th cosine mode. In practice, the infinite series in (2.11) is truncated at a suitable large number
 $M$. Substituting (2.11) into (2.10) gives the evolution equation for the amplitude of each cosine mode,
 $$\begin{eqnarray}\frac{\unicode[STIX]{x2202}\overline{\boldsymbol{u}}_{m}^{\prime }}{\unicode[STIX]{x2202}t}={\mathcal{L}}(\overline{\boldsymbol{u}}_{m}^{\prime }),\quad m=0,1,\ldots ,M.\end{eqnarray}$$
The purpose of instability analysis is to solve (2.12) to obtain the frequency, growth rate and spatial shape of unstable modes for given azimuthal wavenumber  $m=0,1,\ldots ,M$.
In the present study, the base flow  $\boldsymbol{u}_{0}$ is a finite-amplitude progressive ring wave propagating outwards in the radial direction, which cannot be made a steady flow through a coordinate-system transform as in the case of Stokes waves. The conventional instability-analysis for steady base flows (e.g. McLean Reference McLean1982) cannot be applied here. Since the base flow is time periodic, we analyse the instability of the present problem based on Floquet theory (e.g. Coddington & Levinson Reference Coddington and Levinson1955; von Kerczek & Davis Reference von Kerczek and Davis1976).
For a disturbance with  $N$ degrees of freedom, we express the solution of (2.12) as a combination of
 $N$ linearly independent solutions
 $\overline{\boldsymbol{u}}_{mn}^{\prime }$,
 $n=1,2,\ldots ,N$
 $$\begin{eqnarray}\overline{\boldsymbol{u}}_{m}^{\prime }(r,t)=\mathop{\sum }_{n=1}^{N}\unicode[STIX]{x1D6FE}_{mn}\overline{\boldsymbol{u}}_{mn}^{\prime }(r,t),\end{eqnarray}$$
where the coefficients  $\unicode[STIX]{x1D6FE}_{mn}$ are obtained from the initial condition for
 $\overline{\boldsymbol{u}}_{m}^{\prime }$. Upon substituting (2.13) into (2.12), we obtain from Floquet theory (Coddington & Levinson Reference Coddington and Levinson1955) the general solution of (2.12) in the form
 $$\begin{eqnarray}{\mathcal{U}}_{m}(r,t)={\mathcal{P}}_{m}(r,t)\exp (R_{m}t),\quad m=0,1,\ldots ,M,\end{eqnarray}$$
where  ${\mathcal{U}}_{m}(r,t)=[\overline{\boldsymbol{u}}_{mn}^{\prime }(r,t)]$ is an
 $N$-column matrix,
 ${\mathcal{P}}_{m}(r,t)$ is also an
 $N$-column matrix which is real and time-periodic with the (subharmonic) frequency of
 $\unicode[STIX]{x1D714}_{0}$ (i.e.
 ${\mathcal{P}}_{m}(r,t)={\mathcal{P}}_{m}(r,t+T_{0})$), and
 $R_{m}$ is an
 $N\times N$ real number constant matrix. The stability of the flow depends on the eigenvalues
 $\unicode[STIX]{x1D706}_{mj}$ (
 $j=1,\ldots ,N$) of
 $R_{m}$. The flow is stable if
 $\text{Re}\{\unicode[STIX]{x1D706}_{mj}\}\leqslant 0$, for all
 $j=1,\ldots ,N$; and unstable if
 $\text{Re}\{\unicode[STIX]{x1D706}_{mj}\}>0$ for any
 $j=1,\ldots ,N$. The unstable mode is the eigenvector corresponding to
 $\unicode[STIX]{x1D706}_{mj}$ with frequency
 $\text{Im}\{\unicode[STIX]{x1D706}_{mj}\}$.
One must note that in the instability analysis of standing waves in a rectangular tank (e.g. Mercer & Roberts Reference Mercer and Roberts1992) or in a cylindrical circular basin (Zhu et al. Reference Zhu, Liu and Yue2003), the time and space dependence of  $\overline{\boldsymbol{u}}_{mn}^{\prime }$ in (2.13) can be separated by the use of orthogonal normal mode expansions. (The normal modes, which satisfy the field equation with the homogeneous boundary condition, can be found in a straightforward way in these problems with simple domain boundaries). This leads to the so-called transition-matrix method, in which the eigenvalues of
 $R_{m}$ are directly related to those of the transition matrix. For the present problem, we are unable to separate the time and space dependence of
 $\overline{\boldsymbol{u}}_{mn}^{\prime }$ since it is difficult to obtain a closed-form solution of normal modes for the problem with the presence of a surface-piercing sphere in an unbound domain. The traditional transition matrix method for the stability analysis of unsteady flow cannot be adopted here. We thus apply direct numerical computation to solve (2.12) for the solution of
 $\overline{\boldsymbol{u}}_{m}^{\prime }(r,t)$ from which we examine the stability of ring waves.
For a flat free surface (i.e. the base ring wave has a zero amplitude), equation (2.12) represents the linearized homogeneous (wave–body interaction) problem for which there exists a non-trivial solution in the context of gravity–capillary waves (Shen & Liu Reference Shen and Liu2019). The homogeneous solution can be written in symbolic form  $\boldsymbol{G}_{m}(r,\unicode[STIX]{x1D714})\equiv (\overline{\unicode[STIX]{x1D702}}_{m},\overline{\unicode[STIX]{x1D711}}_{m})$ which represents the linear progressive radial cross-wave mode with azimuthal wavenumber
 $m=0,1,\ldots ,M$, for any frequency
 $\unicode[STIX]{x1D714}\in (0,\infty )$. In the case of a half-submerged sphere, appendix C provides a brief description of a numerical method for the determination of
 $\boldsymbol{G}_{m}(r,\unicode[STIX]{x1D714})$,
 $m=0,1,\ldots ,M$. In this limiting case of zero-amplitude ring waves, we have
 $\boldsymbol{p}_{mn}(r,t)=\boldsymbol{G}_{m}(r,\unicode[STIX]{x1D714})\exp (\text{i}\unicode[STIX]{x1D714}t)$ , which can be seen as a column vector of matrix
 ${\mathcal{P}}_{m}$, and
 $R_{m}=0$. This means that a flat surface is neutrally stable to the propagating cross-wave perturbations of any frequency.
In the presence of a small-amplitude base ring wave, the multiple-scale perturbation analysis of resonant interactions between the ring wave (with frequency  $2\unicode[STIX]{x1D714}_{0}$) and a subharmonic cross-wave (with frequency
 $\unicode[STIX]{x1D714}_{0}$) shows that the subharmonic cross-wave amplitude grows with time (with
 $\text{Re}\{\unicode[STIX]{x1D706}_{m1}\}>0$ and
 $\text{Im}\{\unicode[STIX]{x1D706}_{m1}\}=0$) by taking energy from the ring wave when the ring wave steepness (measured by the dimensionless sphere oscillation amplitude) exceeds the threshold value (Shen & Liu Reference Shen and Liu2019). The time-evolution solution of the
 $m$th subharmonic cross-wave mode, which is the first column vector of matrix
 ${\mathcal{U}}_{m}(r,t)$, is given by
 $$\begin{eqnarray}\boldsymbol{p}_{m1}(r,t)=\unicode[STIX]{x1D6F1}_{m1}(r)\boldsymbol{G}_{m}(r,\unicode[STIX]{x1D714}_{0})\text{e}^{\text{i}\unicode[STIX]{x1D714}_{0}t}\text{e}^{\unicode[STIX]{x1D706}_{m1}t},\end{eqnarray}$$
where  $\unicode[STIX]{x1D6F1}_{m1}(r)$ is a slowly varying function of
 $r$ representing the envelope of the relatively fast-varying function
 $\boldsymbol{G}_{m}(r,\unicode[STIX]{x1D714}_{0})$. This indicates that the base ring wave is unstable to the sub-harmonic cross-wave perturbation. The interactions of the ring wave with other harmonic (i.e. higher and lower than subharmonic) cross-waves are not analysed, and the stability of the small-amplitude ring waves to these cross-wave perturbations remains unknown. In the general case of finite-amplitude ring waves, we would expect the time-evolution solution
 $\boldsymbol{p}_{m1}(r,t)$ for the sub-harmonic cross-wave mode to take the same form as (2.15) with the envelope
 $\unicode[STIX]{x1D6F1}_{m1}(r)$, growth rate
 $\text{Re}\{\unicode[STIX]{x1D706}_{m1}\}$ and frequency
 $\text{Im}\{\unicode[STIX]{x1D706}_{m1}\}$ influenced by the base ring wave conditions. In this work, direct numerical simulations are used to quantify the stability of finite-amplitude progressive ring waves subject to general cross-wave perturbations.
In the direct computation approach, we numerically integrate (2.12) in time starting from specified initial conditions to obtain the solution of  $\overline{\boldsymbol{u}}_{m}^{\prime }(r,t)$ from which we determine the (complex) growth rate
 $\unicode[STIX]{x1D706}_{mn}$ and mode shape
 $\unicode[STIX]{x1D6F1}_{mn}(r)$ based on (2.14) and (2.15). In practice, two steps of computations are involved. In the first step, we use the direct numerical simulation to solve the nonlinear initial boundary value problem to obtain the (steady state) time-periodic fully nonlinear base flow solution
 $\boldsymbol{u}_{0}$ in the computational domain. In the second step, we add a small initial disturbance, which is chosen to correspond to the
 $m$th cross-wave of arbitrary frequency
 $\unicode[STIX]{x1D714}$, into the steady state base flow at a certain time instant, say,
 $t=t_{0}$
 $$\begin{eqnarray}\boldsymbol{u}_{m}(r,\unicode[STIX]{x1D713},t_{0})=\boldsymbol{u}_{0}(r,t_{0})+s_{0}\boldsymbol{G}_{m}(r,\unicode[STIX]{x1D714})\cos (m\unicode[STIX]{x1D713})\text{e}^{\text{i}\unicode[STIX]{x1D714}t_{0}},\quad m=0,1,\ldots ,M\end{eqnarray}$$
where  $s_{0}\ll 1$ is the initial amplitude of the
 $m$th cross-wave disturbance. This choice of the initial disturbance provides a best initial guess of the unstable mode shape. The time simulation of the nonlinear evolution of the disturbed wave field gives the solution of
 $\boldsymbol{u}(r,\unicode[STIX]{x1D713},t)$ for a sufficiently long time period of
 $t\in [t_{0},t_{0}+t_{1}]$ with
 $t_{1}\gg T_{0}$. Subtracting
 $\boldsymbol{u}_{0}$ from
 $\boldsymbol{u}(r,\unicode[STIX]{x1D713},t)$, we obtain the temporal-spatial evolution solution of the disturbance
 $\boldsymbol{u}^{\prime }(r,\unicode[STIX]{x1D713},t)$ from which we get
 $\overline{\boldsymbol{u}}_{m}^{\prime }(r,t)$,
 $m=0,1,\ldots ,M$, by the use of a Fourier transform in
 $\unicode[STIX]{x1D713}$. Upon applying the moving window time-harmonic analysis to
 $\overline{\boldsymbol{u}}_{m}^{\prime }(r,t)$, we can express
 $\overline{\boldsymbol{u}}_{m}^{\prime }(r,t)$ in the form
 $$\begin{eqnarray}\overline{\boldsymbol{u}}_{m}^{\prime }(r,t)=\mathop{\sum }_{n=0}^{N}\boldsymbol{C}_{mn}(r,t_{s})\text{e}^{\text{i}n\unicode[STIX]{x1D714}_{0}t}\text{e}^{\unicode[STIX]{x1D706}_{mn}(r,t_{s})t},\quad t\in [t_{s},t_{s}+T_{w}]\end{eqnarray}$$
for  $t_{s}\in [t_{0},t_{0}+t_{1}-T_{w}]$, where
 $t_{s}$ is the start of the time window,
 $T_{w}$ is the span of the moving time window,
 $N$ is the truncated number of the time harmonics. Based on (2.17), we can determine the complex growth rate
 $\unicode[STIX]{x1D706}_{mn}(r,t_{s})$ and mode amplitude
 $\boldsymbol{C}_{mn}(r,t_{s})$ for
 $n=0,1,\ldots ,N$ by the use of nonlinear least squares with the Marquardt (Reference Marquardt1963) algorithm. Once
 $\unicode[STIX]{x1D706}_{mn}(r,t_{s})$ and
 $\boldsymbol{C}_{mn}(r,t_{s})$ reach their steady state (i.e. with
 $\unicode[STIX]{x1D706}_{mn}(r,t_{s})$ being independent of
 $r$ and
 $t_{s}$, and
 $\boldsymbol{C}_{mn}(r,t_{s})$ being independent of
 $t_{s}$), we obtain the final solution of the growth rate
 $\text{Re}\{\unicode[STIX]{x1D706}_{mn}\}$ and mode shape
 $$\begin{eqnarray}\unicode[STIX]{x1D6F1}_{mn}(r)\boldsymbol{G}_{m}(r,n\unicode[STIX]{x1D714}_{0})=\boldsymbol{C}_{mn}(r)/\unicode[STIX]{x1D6FE}_{mn}\end{eqnarray}$$
for  $m=0,1,\ldots ,M$ and
 $n=0,1,\ldots ,N$, where
 $\unicode[STIX]{x1D6FE}_{mn}$ is the normalization factor for mode shape. The frequency of the
 $mn$th mode is given by
 $n\unicode[STIX]{x1D714}_{0}+\text{Im}\{\unicode[STIX]{x1D706}_{mn}\}$.
We remark that the second step of the computation is similar to the application of ‘power iteration’ to finding the largest eigenvalue of a constant matrix and the corresponding eigenvector. In this case, the eigenvalue is  $\unicode[STIX]{x1D706}_{mn}+\text{i}n\unicode[STIX]{x1D714}_{0}$, and eigenvector is
 $\unicode[STIX]{x1D6F1}_{mn}(r)\boldsymbol{G}_{m}(r,n\unicode[STIX]{x1D714}_{0})$. The unique part of the present problem is that the matrix
 ${\mathcal{L}}$ in (2.12) is not constant, but varying with time.
3 Numerical simulation of fully nonlinear wave–body interactions
3.1 Mixed Eulerian–Lagrangian quadratic boundary integral equation method
The nonlinear wave–body interaction problem described in § 2.1 is a generalized Cauchy problem whose solution at any time is completely determined in terms of values on the boundary of the fluid domain. We employ a mixed Eulerian–Lagrangian (MEL) boundary integral equation (BIE) method to solve the initial boundary value problem in the time domain by accounting for fully nonlinear wave–wave and wave–body interactions. This method is commonly used in solving the fully nonlinear marine hydrodynamic problems (Mei, Stiassnie & Yue Reference Mei, Stiassnie and Yue2005). In this approach, there are two main steps of computations at each time step: (I) for given  $\unicode[STIX]{x1D719}(t)$ on the free surface
 $S_{F}(t)$ and
 $\unicode[STIX]{x1D719}_{n}(t)$ on the body surface
 $S_{B}(t)$, solve the (linear) boundary value problem for unknown
 $\unicode[STIX]{x1D719}_{n}$ on
 $S_{F}(t)$ and unknown
 $\unicode[STIX]{x1D719}$ on
 $S_{B}(t)$; and (II) integrate the (nonlinear) evolution equations with time to update the free surface and body positions,
 $S_{F}(t+\unicode[STIX]{x0394}t)$ and
 $S_{B}(t+\unicode[STIX]{x0394}t)$, and to obtain
 $\unicode[STIX]{x1D719}(t+\unicode[STIX]{x0394}t)$ on
 $S_{F}(t+\unicode[STIX]{x0394}t)$ and
 $\unicode[STIX]{x1D719}_{n}(t+\unicode[STIX]{x0394}t)$ on
 $S_{B}(t+\unicode[STIX]{x0394}t)$, where
 $\unicode[STIX]{x0394}t$ is the time step. The initial boundary value problem can be solved for any specified duration of time by repeating the two computational processes starting from the initial conditions. Among these two, operation I demands the most of the computational cost while II is relatively straightforward.
In operation I, we apply Green’s second identity to reformulate the boundary value problem as the following BIE:
 $$\begin{eqnarray}\unicode[STIX]{x1D6FC}(\boldsymbol{r})\unicode[STIX]{x1D719}(\boldsymbol{r})+\iint _{\unicode[STIX]{x2202}{\mathcal{D}}}[\unicode[STIX]{x1D719}(\boldsymbol{r}^{\prime })G_{n}(\boldsymbol{r};\boldsymbol{r}^{\prime })-\unicode[STIX]{x1D719}_{n}(\boldsymbol{r}^{\prime })G(\boldsymbol{r};\boldsymbol{r}^{\prime })]\,\text{d}S(\boldsymbol{r}^{\prime })=0,\quad \boldsymbol{r}\in \unicode[STIX]{x2202}{\mathcal{D}},\end{eqnarray}$$
where the position vector  $\boldsymbol{r}\equiv (r\cos \unicode[STIX]{x1D713},r\sin \unicode[STIX]{x1D713},z)$,
 $\unicode[STIX]{x2202}{\mathcal{D}}=S_{B}(t)\bigcup S_{F}(t)$,
 $G(\boldsymbol{r};\boldsymbol{r}^{\prime })=|\boldsymbol{r}-\boldsymbol{r}^{\prime }|^{-1}$ is the Rankine source Green function, and
 $\unicode[STIX]{x1D6FC}(\boldsymbol{r})$ is the interior solid angle. In (3.1), the Cauchy principal part of the singular integral is assumed, and the integrals over the deep water boundary
 $S_{0}$ and far-field boundary
 $S_{\infty }$ vanish after the imposition of the deep water condition and far-field radiation condition. The BIE is the Fredholm integral equation of the second (or first) kind for
 $\boldsymbol{r}\in S_{B}(t)$ (or
 $S_{F}(t)$).
We apply the quadratic boundary-element method (QBEM) to solve the BIE (3.1). We employ a piecewise bi-quadratic representation of both boundary  $S_{B}\bigcup S_{F}$ and the quantities
 $\unicode[STIX]{x1D719}$ and
 $\unicode[STIX]{x1D719}_{n}$ on
 $S_{B}\bigcup S_{F}$. The boundary panels are curvilinear quadrilaterals (or degenerate curvilinear triangles) with nine (or seven) nodes where boundary positions, and
 $\unicode[STIX]{x1D719}$ and
 $\unicode[STIX]{x1D719}_{n}$ are collocated. Upon discretization/collocation of (3.1), we obtain a linear algebraic system that is in general dense, non-symmetric and, because of the first-kind equations on free surface, not diagonally dominant. This algebraic system is solved iteratively using a generalized minimal residual algorithm with symmetric successive over-relaxation pre-conditioning. The requisite computational effort for the QBEM equations is approximately
 $O(N^{2})$ where
 $N$ is the total number of nodal points. The QBEM obtains quadratic convergence with the boundary-element size even in the presence of body and free surface intersections with discontinuous boundary slopes (Liu, Xue & Yue Reference Liu, Xue and Yue2001; Yan & Liu Reference Yan and Liu2011).
In the MEL approach to track the fully nonlinear free surface motion, we rewrite the kinematic and dynamic free-surface boundary conditions (2.2) and (2.3) in a Lagrangian form (Mei et al. Reference Mei, Stiassnie and Yue2005) and use them as the time evolution equations for  $S_{F}$ and
 $\unicode[STIX]{x1D719}$ on
 $S_{F}$. In operation II, we integrate these evolution equations forward with time to update
 $S_{F}$ and
 $\unicode[STIX]{x1D719}$ on
 $S_{F}$ by the use of the standard fourth-order Runge–Kutta scheme. For the present forced body motion problem, the body surface position
 $S_{B}(t)$ is specified (cf. (2.5)). In the computation of a steady state finite-amplitude ring wave, we start the simulation from a flat free-surface by smoothly increasing the amplitude of the sphere oscillation from zero to the targeted amplitude over a ramp-up period of
 $3T_{0}$ for the purpose of minimizing the transient effects associated with the impulsive start of sphere motion.
Details of the mathematic formulation, numerical implementation and systematic convergence tests of the QBEM for the study of nonlinear wave dynamics and nonlinear wave–body interactions can be found in Mei et al. (Reference Mei, Stiassnie and Yue2005) and Yan & Liu (Reference Yan and Liu2011). In the present work, all high-resolution computations of fully nonlinear evolution of the gravity–capillary wave-field by the oscillating sphere are performed on the high-performance computing platforms with the MEL-QBEM code parallelized with message passing interface.
3.2 Numerical issues in gravity–capillary wave–body interaction simulation
From theory it is known that when the surface tension is considered, the boundary value problem of wave interaction with a floating body possesses homogeneous solutions that are dependent on the free-surface slope at the waterline (Rhodes-Robinson Reference Rhodes-Robinson1971; Shen & Liu Reference Shen and Liu2019). In the simulation of gravity–capillary wave interaction with a floating body, it is thus important to limit the numerical error at the waterline since it may introduce unneeded homogeneous-solution contributions to the total solution of the problem. To minimize this effect in the time-domain simulation, after the boundary value problem is solved at each time step, we replace the free surface elevation at the waterline  $\unicode[STIX]{x1D701}(r=r_{w},\unicode[STIX]{x1D713},t)$ with the elevation at its closest neighbouring grid
 $\unicode[STIX]{x1D701}(r=r_{w}+\unicode[STIX]{x0394}r,\unicode[STIX]{x1D713},t)$, where
 $r_{w}$ represents the radial position of the waterline and
 $\unicode[STIX]{x0394}r$ is the small radial distance from the waterline. The corresponding
 $\unicode[STIX]{x1D719}$ value at the waterline position is computed by using
 $\unicode[STIX]{x1D719}_{r}$ (which is approximately equal to
 $\unicode[STIX]{x1D719}_{n}$ at the waterline of the sphere) and the
 $\unicode[STIX]{x1D719}$ value at its closest neighbouring grid (in the radial direction). This treatment is shown to be effective in eliminating arbitrary homogeneous solutions being added into the system from the waterline with negligibly small effects on the wave-making solution by the body oscillation.
In practical simulations, a computational domain with a finite  $S_{F}$ is used. In principle, the satisfaction of the radiation condition at the far-field can be ensured by matching the QBEM solution in the near-field domain of interest to a general linear analytic wave-field in the far-field over a matching boundary
 $S_{\infty }$. The latter solution can be made to satisfy the requisite radiation condition at infinity (Dommermuth & Yue Reference Dommermuth and Yue1987). In many applications, the cost of the far-field matching approach can be reduced (decreasing the size of
 $S_{\infty }$) by the use of a sponge layer (or damping zone) in the QBEM domain to absorb the reflecting waves along
 $S_{\infty }$ (Liu et al. Reference Liu, Xue and Yue2001) or by the implementation of the Orlanski–Sommerfeld radiation condition at
 $S_{\infty }$ (Orlanski Reference Orlanski1975). For the present study that is concerned with the radiation problem with a single forcing frequency, the Orlanski scheme is expected to perform more effectively. In the implementation of this scheme, we set
 $S_{\infty }$ to be a vertical cylindrical surface with radius
 $r=r_{2}\gg r_{1}$, on which the following radiation condition is imposed:
 $$\begin{eqnarray}\unicode[STIX]{x1D719}_{t}+c\unicode[STIX]{x1D719}_{r}=0,\quad r=r_{2},z\leqslant \unicode[STIX]{x1D701},\end{eqnarray}$$
and
 $$\begin{eqnarray}\unicode[STIX]{x1D701}_{t}+c\unicode[STIX]{x1D701}_{r}=0,\quad r=r_{2},z=\unicode[STIX]{x1D701},\end{eqnarray}$$
where  $c$ is the phase speed of the outgoing wave and can be determined numerically at each time step (Orlanski Reference Orlanski1975). We point out that in the context of gravity–capillary waves, owing to the presence of second-order differential terms associated with surface tension in the dynamic free-surface boundary conditions, both
 $\unicode[STIX]{x1D719}$ and
 $\unicode[STIX]{x1D701}$ Orlanski–Sommerfeld conditions need to be imposed at the intersection of
 $S_{\infty }$ and
 $S_{F}$ while only the
 $\unicode[STIX]{x1D719}$ condition is needed for the gravity wave problem. To close the fluid domain with a finite depth of
 $S_{\infty }$, a horizontal bottom
 $S_{0}$ (at deep depth
 $z=-H$) on which
 $\unicode[STIX]{x1D719}_{n}=0$ is imposed, is added.
In the numerical implementation,  $\unicode[STIX]{x1D719}$ on
 $S_{\infty }$ at any time is considered to be known from the time integration of (3.2). Thus, in solving the boundary value problem,
 $S_{\infty }$ is a Dirichlet surface on which
 $\unicode[STIX]{x1D719}_{n}$ is the unknown to be solved for. Note that at the intersection of
 $S_{\infty }$ with
 $S_{F}$, the
 $\unicode[STIX]{x1D719}_{n}$ values on
 $S_{\infty }$ and
 $S_{F}$ are not independent and they are related in terms of the orientations of
 $S_{\infty }$ and
 $S_{F}$ as well as the
 $\unicode[STIX]{x1D719}$ values on
 $S_{\infty }$ and
 $S_{F}$ (Ingham, Ritchie & Tayler Reference Ingham, Ritchie and Tayler1991). In solving the boundary value problem, only one of them is considered as an independent unknown.
The free surface particle velocity is needed to update the free surface position and the potential on the free surface. In QBEM, these velocities are evaluated using the finite difference method at parametric space in the curvilinear surface. When surface tension is accounted for, the second derivatives of the free surface need to be evaluated in order to determine the gradient of the unit normal of the free surface in the free-surface dynamic boundary condition (cf. (2.3)). Similarly to the velocities, we evaluate the second spatial derivatives of the free surface using the finite-difference method at parametric space in the curvilinear surface. The detailed formula is given in appendix A.
In MEL simulations for gravity waves, ‘sawtooth’ instabilities eventually develop on the free surface as nonlinearity increases (Longuet-Higgins & Cokelet Reference Longuet-Higgins and Cokelet1976). A variety of smooth algorithms have been developed to remove this instability (Xue et al. Reference Xue, Xu, Liu and Yue2001). In the present study, regridding is used to avoid clustering of grids on the free surface as nonlinearity increases (Dommermuth & Yue Reference Dommermuth and Yue1987). We do not observe the development of ‘sawtooth’ instabilities, which may be due to the effect of surface tension. Thus, no smoothing is applied.
4 Validation of direct numerical simulation
4.1 Ring wave and radial cross-waves by a vertical circular cylinder
To validate the accuracy of direct numerical simulations, we first consider the wave radiation by a (fictitious) vertical circular cylinder whose vertical side undergoes a forced harmonic swelling–contraction motion in the horizontal plane. For this problem, there exists an analytic solution in the case of small-amplitude oscillations (Rhodes-Robinson Reference Rhodes-Robinson1971). As a numerical example, we choose the oscillation frequency  $2\unicode[STIX]{x1D714}_{0}=40\unicode[STIX]{x03C0}~\text{rad}~\text{s}^{-1}$ (corresponding to 20 Hz), the cylinder radius
 $k_{0}r_{1}=3.98$ (with
 $r_{1}=15~\text{mm}$), and the cylinder draft
 $k_{0}H=16\unicode[STIX]{x03C0}$. The cylinder spans the water column with
 $-H\leqslant z\leqslant \unicode[STIX]{x1D701}$. The amplitude of swelling–contraction oscillation is
 $a[0.25\cos (0.5k_{0}z)+\sin (0.5k_{0}z)]$, with which only evanescent waves are generated at this oscillation frequency (Rhodes-Robinson Reference Rhodes-Robinson1971; Shen & Liu Reference Shen and Liu2019). The oscillation amplitude
 $a=0.01~\text{mm}$ (corresponding to
 $k_{0}a=0.0027$) is used in the direct (time-domain) numerical computation.
In the numerical simulation, we place the far-field radiation boundary  $S_{\infty }$ at
 $r_{2}-r_{1}=8.5\unicode[STIX]{x1D706}_{0}$, and use grid sizes
 $\unicode[STIX]{x0394}z=\unicode[STIX]{x1D706}_{0}/20$ in the vertical direction on
 $S_{B}$ and
 $S_{\infty }$,
 $\unicode[STIX]{x0394}r=\unicode[STIX]{x1D706}_{0}/10$ in the radial direction on
 $S_{0}$, and
 $\unicode[STIX]{x0394}\unicode[STIX]{x1D713}=2\unicode[STIX]{x03C0}/50$ in the azimuthal direction on
 $S_{0}$ and
 $S_{F}$ where
 $\unicode[STIX]{x1D706}_{0}=2\unicode[STIX]{x03C0}/k_{0}$. Two grid sizes in the radial direction
 $\unicode[STIX]{x0394}r=\unicode[STIX]{x1D706}_{0}/30$,
 $\unicode[STIX]{x1D706}_{0}/60$ on
 $S_{F}$ are used to show the convergence of the numerical solution. Figure 2 displays the comparison of the linearized radiated evanescent wave amplitude as a function of
 $r$ between the direct numerical simulation results and the analytic solution (Rhodes-Robinson Reference Rhodes-Robinson1971). The agreement between the numerical results and the analytic solution is excellent with the normalized root mean square (r.m.s.) error being less than 2 %. The two numerical solutions (with
 $\unicode[STIX]{x0394}r=\unicode[STIX]{x1D706}_{0}/30$ and
 $\unicode[STIX]{x1D706}_{0}/60$ on
 $S_{F}$) are graphically indistinguishable with the normalized r.m.s. error between them being less than 1 %.
Comparison of the linearized radiated (evanescent) wave amplitude ( $\unicode[STIX]{x1D702}(r)$) by a vertical circular cylinder, normalized by the oscillation amplitude
 $a$, between the numerical results with grid size
 $\unicode[STIX]{x0394}r=\unicode[STIX]{x1D706}_{0}/60$ (——) and
 $\unicode[STIX]{x0394}r=\unicode[STIX]{x1D706}_{0}/30$ (– – –) and the analytic solution (— ⋅ —) (Rhodes-Robinson Reference Rhodes-Robinson1971).

The analytic homogeneous cross-wave solution (Shen & Liu Reference Shen and Liu2019) is also used to validate the direct numerical simulation. Figures 3(a) and 3(b) compare sample (normalized) radial cross-wave profiles obtained from the time-domain numerical simulation and the analytic solution for the azimuthal wavenumber  $m=0$ and
 $5$, respectively. For these results, the cylinder parameter, oscillation frequency, and numerical parameters are the same as those used in figure 2. In the numerical simulation, as an example, a small radial free-surface slope,
 $s_{0}=0.01$, at the waterline is used. Excellent agreement between the direct numerical simulation result and the analytic solution is again obtained with the normalized r.m.s. error being less than 2 %.
Comparison of the normalized linear radial cross-wave profile ( $\unicode[STIX]{x1D702}(r,\unicode[STIX]{x1D713}=0)$) of a vertical circular cylinder with the azimuthal wavenumber (a)
 $m=0$ and (b)
 $m=5$ between the numerical results with grid size
 $\unicode[STIX]{x0394}r=\unicode[STIX]{x1D706}_{0}/60$ (——) and
 $\unicode[STIX]{x0394}r=\unicode[STIX]{x1D706}_{0}/30$ (– – –) and the analytic solution (— ⋅ —) (Shen & Liu Reference Shen and Liu2019).

4.2 Ring wave and radial cross-waves by a floating sphere
In order to study TIO’s experiments, we need to numerically mimic the problem of wave radiation by vertical oscillation of a half-submerged sphere. For this problem, there exists no analytic solution even in the linearized case. For validation of the numerical simulation, we derive an asymptotic far-field solution of the radiated ring waves at high frequency by extending the analysis of Hulme (Reference Hulme1982) for gravity wave radiation to include the effect of surface tension. The detailed derivation of the asymptotic solution is included in appendix B.
Comparison of the normalized linearized ring wave profile ( $\unicode[STIX]{x1D702}(r)/a$) radiated by vertical oscillation of a half-submerged sphere between the direct numerical simulation results with grid size
 $\unicode[STIX]{x0394}r=\unicode[STIX]{x1D706}_{0}/40$ (——) and
 $\unicode[STIX]{x0394}r=\unicode[STIX]{x1D706}_{0}/30$ (— ⋅ —) and the asymptotic far-field solution (– – –).

To mimic TIO’s experiments, we choose the radius of the sphere  $k_{0}r_{1}=3.98$ (corresponding to
 $r_{1}=15~\text{mm}$) and consider oscillation frequency
 $2\unicode[STIX]{x1D714}_{0}=40\unicode[STIX]{x03C0}~\text{rad}~\text{s}^{-1}$. The numerical parameters used in the simulation are oscillation amplitude
 $k_{0}a=0.0027$, domain size
 $r_{2}-r_{1}=8.5\unicode[STIX]{x1D706}_{0}$ and
 $H/\unicode[STIX]{x1D706}_{0}=8$, and grid sizes
 $\unicode[STIX]{x0394}z=\unicode[STIX]{x1D706}_{0}/20$ on
 $S_{\infty }$,
 $\unicode[STIX]{x0394}r=\unicode[STIX]{x1D706}_{0}/10$ on
 $S_{0}$,
 $\unicode[STIX]{x0394}\unicode[STIX]{x1D713}=2\unicode[STIX]{x03C0}/50$ on
 $S_{F}$,
 $S_{\infty }$ and
 $S_{0}$. On
 $S_{B}$, 50 and 20 uniform discretizations are used in the azimuth and polar angles, respectively. Two grid sizes
 $\unicode[STIX]{x0394}r=\unicode[STIX]{x1D706}_{0}/30$ and
 $\unicode[STIX]{x1D706}_{0}/40$ on
 $S_{F}$ are tested for convergence purposes. Figure 4 shows the comparison of the ring wave profile between the asymptotic solution and the numerical simulation result. The numerical simulation result compares well with the asymptotic solution at the far-field of the body. The discrepancy between them is apparent in the near field of the body since the asymptotic solution does not include evanescent waves while the direct simulation accounts for both propagating and evanescent waves. The discrepancy between them decreases as the radius
 $k_{0}r_{1}$ increases and the evanescent wave effect vanishes.
In order to specify the initial disturbance of radial cross-waves (that varies in  $r$ and
 $\unicode[STIX]{x1D713}$) for the stability study of ring waves, we develop a frequency-domain solver using the boundary integral equation method for the determination of linear cross-waves of a general floating body. The details of the method are described in appendix C. The frequency-domain solution can be used to validate the accuracy of direct QBEM time-domain simulations of the radial cross-waves of a floating sphere. For the same physical and numerical parameters as in figure 4, we use the time-domain simulations to obtain (limit cycle) steady state linearized solutions of cross-waves with a small specified free-surface radial slope
 $s_{0}=0$.01 at the waterline. Figures 5(a) and 5(b) compare the cross-wave profiles between the time-domain simulation result and the frequency-domain solution for the azimuthal wavenumbers
 $m=0$ and 5, respectively. The time-domain simulation results with two different free-surface discretizations converge well and match the frequency-domain solution excellently. The convergence with respect to the body surface grids, Orlanski boundary grids, and basin bottom grids is also tested. The detailed results are not presented here, but can be found in Shen (Reference Shen2019). Unless otherwise stated, we shall use the radial discretization of
 $\unicode[STIX]{x0394}r=\unicode[STIX]{x1D706}_{0}/40$ on
 $S_{F}$ and other numerical parameters specified above for all following simulations in the study of ring wave instability. We note that the deep water boundary
 $S_{0}$ is placed at
 $H/\unicode[STIX]{x1D706}_{0}=8$. Further increasing the value of
 $H$ won’t affect the instability results presented in this text.
Comparison of normalized linear radial cross-wave profiles ( $\unicode[STIX]{x1D702}(r,\unicode[STIX]{x1D713}=0)$) of a half-submerged sphere for the azimuthal wavenumbers (a)
 $m=0$ and (b)
 $m=5$ between the direct time-domain simulation result with free-surface radial grid size
 $\unicode[STIX]{x0394}r=\unicode[STIX]{x1D706}_{0}/40$ (– – –) and
 $\unicode[STIX]{x0394}r=\unicode[STIX]{x1D706}_{0}/30$ (— ⋅ —) and the frequency-domain solution (——). (Here
 $2\unicode[STIX]{x1D714}_{0}=40\unicode[STIX]{x03C0}~\text{rad}~\text{s}^{-1}$,
 $k_{0}r_{1}=3.98$.)

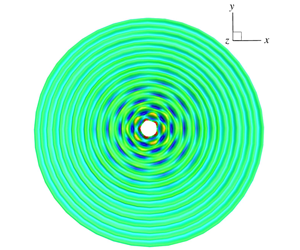
Contour snapshots of the surface wave fields from direct numerical simulations, which are radiated by vertical harmonic oscillations of a floating sphere (located at the centre of the domain). (a) Steady state base ring wave at  $t_{1}/T_{0}=0$ (
 $2\unicode[STIX]{x1D714}_{0}=40\unicode[STIX]{x03C0}~\text{rad}~\text{s}^{-1}$,
 $k_{0}r_{1}=3.98$,
 $a/r_{1}=0.12$); (b) total disturbed wave field at
 $t_{1}/T_{0}=10$ (composed of base ring wave in (a) and initial subharmonic cross-wave disturbance with azimuthal wavenumber
 $m=5$ and free-surface slope at waterline
 $s_{0}=0.1$); (c) total disturbed wave field at
 $t_{1}/T_{0}=6$ (composed of ring wave with
 $2\unicode[STIX]{x1D714}_{0}=35\unicode[STIX]{x03C0}~\text{rad}~\text{s}^{-1}$ and
 $a/r_{1}=0.2$, and initial subharmonic cross-wave disturbance with
 $m=4$ and
 $s_{0}=0.1$); and (d) total disturbed wave field at
 $t_{1}/T_{0}=6$ (composed of ring wave with
 $2\unicode[STIX]{x1D714}_{0}=30\unicode[STIX]{x03C0}~\text{rad}~\text{s}^{-1}$ and
 $a/r_{1}=0.3$, and initial subharmonic cross-wave disturbance with
 $m=3$ and
 $s_{0}=0.1$).

5 Basic properties of the instability
In this section, we show by direct time-domain simulations that the ring wave generated by a vertically oscillating sphere could be unstable to small radial cross-wave disturbances, as observed in TIO’s experiments. We discuss characteristic behaviours and fundamental properties of the instability development based on the numerical simulation results.
To mimic TIO’s laboratory experiment, we choose a sphere of radius  $r_{1}=15~\text{mm}$ in the numerical simulation. When the sphere has an oscillation frequency of
 $2\unicode[STIX]{x1D714}_{0}=40\unicode[STIX]{x03C0}~\text{rad}~\text{s}^{-1}$, the dimensionless radius of the sphere is
 $k_{0}r_{1}=3.98$. The radiated axial-symmetric ring wave reaches the steady state in the computational domain after a simulation time
 $t/T_{0}\sim 10$. Figure 6(a) shows a snapshot of the free-surface elevation contour of the ring wave at
 $t/T_{0}=10$ for the case of the sphere’s oscillation amplitude
 $a/r_{1}=0.12$. We then add a small-amplitude subharmonic cross-wave disturbance (with corresponding frequency
 $\unicode[STIX]{x1D714}_{0}$, azimuthal wavenumber
 $m=5$, and slope amplitude
 $s_{0}=0.1$) into the ring wave field at
 $t/T_{0}=10$ (with the corresponding initial disturbance time
 $t_{1}/T_{0}=0$). The simulation of subsequent nonlinear wave-field evolution indicates that the original ring wave field becomes unstable with the cross-wave disturbance growing significantly during the evolution. Figure 6(b) displays the elevation contour of the instantaneous free surface at
 $t_{1}/T_{0}=10$, from which it is seen that the cross-wave in the near field of the body becomes comparable to the base ring wave in amplitude. Similar instability phenomena are observed in the simulations with different base ring wave and cross-wave disturbance parameters. Figure 6(c) (or figure 6d) shows a snapshot of the disturbed wave-field after the simulation time
 $t_{1}/T_{0}=6$ with
 $2\unicode[STIX]{x1D714}_{0}=35\unicode[STIX]{x03C0}$ (or
 $30\unicode[STIX]{x03C0}$)
 $\text{rad}~\text{s}^{-1}$,
 $a/r_{1}=0.2$ (or 0.3) and subharmonic cross-wave azimuthal wavenumber
 $m=4$ (or 3). Consistent with TIO’s experimental observations, distinctive non-axial-symmetric wave patterns are developed from the initial axial-symmetric ring waves, indicating that the base ring wave is unstable to small radial cross-wave disturbances.
Waterfall plots of wave profiles in the radial and azimuthal directions during the nonlinear evolution of a disturbed ring wave by an oscillating sphere. (a), (c) and (e) show the time evolution of the radial wave profiles (at  $\unicode[STIX]{x1D713}=0$) of base ring wave (
 $\unicode[STIX]{x1D701}_{0}$), total disturbed wave field (
 $\unicode[STIX]{x1D701}$) and disturbance wave (
 $\unicode[STIX]{x1D701}^{\prime }$), respectively; (b), (d) and (f) display the evolution of the wave profiles, in the azimuthal direction at the waterline, of base ring wave (
 $\unicode[STIX]{x1D701}_{0}$), total disturbed wave field (
 $\unicode[STIX]{x1D701}$) and disturbance wave (
 $\unicode[STIX]{x1D701}^{\prime }$), respectively. Small subharmonic cross-wave disturbance (
 $\unicode[STIX]{x1D714}_{0}=20\unicode[STIX]{x03C0}~\text{rad}~\text{s}^{-1}$,
 $m=5$ and
 $s_{0}=0.1$) is added to the steady state ring wave (
 $2\unicode[STIX]{x1D714}_{0}=40\unicode[STIX]{x03C0}~\text{rad}~\text{s}^{-1}$,
 $k_{0}r_{1}=3.98$ and
 $a/r_{1}=0.12$) at
 $t_{1}/T_{0}=0$. The profiles shown in the figures are
 $T_{0}/20$ apart in time.

To further illustrate how the instability is developed during the evolution, for the same case, figures 6(b), 7(a), 7(c) and 7(e), respectively, display the waterfall plots of the base ring wave profile ( $\unicode[STIX]{x1D701}_{0}(r,\unicode[STIX]{x1D713},t)$), total disturbed wave profile (
 $\unicode[STIX]{x1D701}(r,\unicode[STIX]{x1D713},t)$) and disturbance wave profile (
 $\unicode[STIX]{x1D701}^{\prime }(r,\unicode[STIX]{x1D713},t)$) at the line
 $\unicode[STIX]{x1D713}=0$, showing their spatial-temporal evolution for
 $r/r_{1}=[1,15]$ and
 $t_{1}/T_{0}=[0,5]$. Figure 7(e) apparently indicates the growth of the cross-wave mode with time, which propagates outwards in the radial direction. Figures 7(b), 7(d) and 7(f) present the time evolution of the ring wave profile (
 $\unicode[STIX]{x1D701}_{0}$), total wave profile (
 $\unicode[STIX]{x1D701}$) and disturbance profile (
 $\unicode[STIX]{x1D701}^{\prime }$) at the water line, respectively. The unstable cross-wave disturbance in the
 $\unicode[STIX]{x1D713}$ direction behaves as a standing wave. Therefore, the unstable (cross-wave) disturbance behaves like a standing wave in the azimuthal direction and a propagating wave in the radial direction.
Figures 8(a) and 8(b) present the time histories of the total wave elevation ( $\unicode[STIX]{x1D701}$) and disturbance elevation (
 $\unicode[STIX]{x1D701}^{\prime }$) at a fixed location (
 $r/r_{1}=1$,
 $\unicode[STIX]{x1D713}=0$) in the neighbourhood of the waterline, respectively. The results in these figures indicate that the dominant disturbance wave has a subharmonic frequency (i.e. period
 $T_{0}$) and its amplitude grows with time during the nonlinear evolution of the wave field. To show the convergence of the numerical simulation results with the discretization in the radial direction on
 $S_{F}$, the results obtained with
 $\unicode[STIX]{x0394}r=\unicode[STIX]{x1D706}_{0}/20$,
 $\unicode[STIX]{x1D706}_{0}/30$ and
 $\unicode[STIX]{x1D706}_{0}/40$ are compared. The convergence of the solutions for
 $\unicode[STIX]{x1D701}$ and
 $\unicode[STIX]{x1D701}^{\prime }$ with
 $\unicode[STIX]{x0394}r=\unicode[STIX]{x1D706}_{0}/40$ is obtained. We point out that although apparent discrepancies in the crest/trough of
 $\unicode[STIX]{x1D701}^{\prime }$ at large time can be seen, the numerical solution with
 $\unicode[STIX]{x0394}r=\unicode[STIX]{x1D706}_{0}/40$ converges to within 1 % for the growth rate of
 $\unicode[STIX]{x1D701}^{\prime }$, which is the main interest of the study.
The time histories of the free-surface elevations at a fixed point near the water line of a vertically oscillating sphere for (a) total wave field and (b) disturbance wave only. Small subharmonic cross-wave disturbance ( $\unicode[STIX]{x1D714}_{0}=20\unicode[STIX]{x03C0}~\text{rad}~\text{s}^{-1}$,
 $m=5$ and
 $s_{0}=0.1$) is added to the steady state ring wave (
 $2\unicode[STIX]{x1D714}_{0}=40\unicode[STIX]{x03C0}~\text{rad}~\text{s}^{-1}$,
 $k_{0}r_{1}=3.98$ and
 $a/r_{1}=0.12$) at
 $t_{1}/T_{0}=0$. The plotted curves are for the numerical simulation results obtained with different free-surface radial grids:
 $\unicode[STIX]{x0394}r=\unicode[STIX]{x1D706}_{0}/20$ (— ⋅ —),
 $\unicode[STIX]{x0394}r=\unicode[STIX]{x1D706}_{0}/30$ (– – –) and
 $\unicode[STIX]{x0394}r=\unicode[STIX]{x1D706}_{0}/40$ (——).

The time dependence of the disturbance wave during the nonlinear evolution of the wave field can be analysed in terms of (2.17). For illustration, we consider the case in figure 8(b) as an example. For this case, the initial disturbance is the subharmonic cross-wave mode with  $m=5$ and slope amplitude
 $s_{0}=0$.1. Figure 9 plots the time variations of the harmonic amplitudes
 $\boldsymbol{C}_{5n}(r,t)$ of the disturbance wave elevation
 $\unicode[STIX]{x1D701}^{\prime }(r,t)$ at
 $r/r_{1}=1$ for
 $n=0,1,\ldots ,4$, which are obtained with the span of moving time window
 $T_{w}/T_{0}=2$. (We note that the results obtained with larger values of
 $T_{w}/T_{0}$ remain nearly unchanged.) It is seen that the amplitude of the subharmonic component (
 $n=1$ with period
 $T_{0}$) approaches to a steady value quickly and is much larger than that of all other harmonics which are negligibly small. Furthermore, the growth rate of the subharmonic component is a positive real value, which is shown in figure 10, while the growth rates of all other harmonics (except for
 $n=3$) are near zero. These indicate that the unstable disturbance is dominated by the subharmonic cross-wave mode (with
 $m=5$ and
 $n=1$). We remark that due to the fact that the quadratic (sum-frequency) interaction of subharmonic (
 $n=1$) cross-wave with the base ring wave (
 $n=2$) would generates the third-harmonic (
 $n=3$), the third-harmonic is observed to have the same growth rate as the subharmonic but with
 $\boldsymbol{C}_{53}$ being at least two orders of magnitude smaller than
 $\boldsymbol{C}_{51}$ as shown in figure 9. Figure 10 compares the growth rates of the unstable subharmonic cross-wave
 $\unicode[STIX]{x1D706}_{51}(r,t)$ at different radial positions with
 $r/r_{1}=1$, 2, 3 and 4 (
 $\unicode[STIX]{x1D713}=0$). The results in the figure show that the growth rates at different positions all approach the same steady value after the initial transient effects propagate away. Specifically, the steady state value is reached earlier at the locations closer to the body.
The time histories of the normalized amplitudes of different harmonic components of the disturbance wave elevation at  $r/r_{1}=1$. The plotted curves are for
 $n=0$ (
 $\cdots \cdots$),
 $n=1$ (subharmonic frequency) (——),
 $n=2$ (oscillation frequency) (– – –),
 $n=3$ (— ⋅ —) and
 $n=4$ (— ⋅ ⋅ —). Small subharmonic cross-wave disturbance (
 $\unicode[STIX]{x1D714}_{0}=20\unicode[STIX]{x03C0}~\text{rad}~\text{s}^{-1}$,
 $m=5$ and
 $s_{0}=0.1$) is added to the steady state ring wave (
 $2\unicode[STIX]{x1D714}_{0}=40\unicode[STIX]{x03C0}~\text{rad}~\text{s}^{-1}$,
 $k_{0}r_{1}=3.98$ and
 $a/r_{1}=0.12$) at
 $t_{1}/T_{0}=0$.

The time histories of growth rate  $\unicode[STIX]{x1D706}_{51}(r,t)$ of subharmonic cross-wave disturbance at different radical locations:
 $r/r_{1}=1$ (——),
 $r/r_{1}=2$ (– – –),
 $r/r_{1}=3$ (— ⋅ —) and
 $r/r_{1}=4$ (
 $\cdots \cdots$). Small subharmonic cross-wave disturbance (
 $\unicode[STIX]{x1D714}_{0}=20\unicode[STIX]{x03C0}~\text{rad}~\text{s}^{-1}$,
 $m=5$ and
 $s_{0}=0.1$) is added to the steady state ring wave (
 $2\unicode[STIX]{x1D714}_{0}=40\unicode[STIX]{x03C0}~\text{rad}~\text{s}^{-1}$,
 $k_{0}r_{1}=3.98$ and
 $a/r_{1}=0.12$) at
 $t_{1}/T_{0}=0$.

An interesting and important question is whether the instability observed in numerical simulations depends on the size of the computational domain. Physically, this is related to the question of whether the instability observed in TIO’s experiment that was conducted with a relatively small basin can occur in a larger or an infinite domain. To understand the domain size effect, we consider two base ring waves generated by vertical oscillations of the sphere with the same oscillation frequency  $2\unicode[STIX]{x1D714}_{0}=40\unicode[STIX]{x03C0}~\text{rad}~\text{s}^{-1}$ but different oscillation amplitudes
 $a/r_{1}=0.12$ and 0.15. Small initial cross-wave disturbances with azimuthal wavenumber
 $m=5$ are 3 are, respectively, added to the two ring wave fields to examine the stability. The numerical simulations are performed with four domain sizes
 $(r_{2}-r_{1})/\unicode[STIX]{x1D706}_{0}=3$, 5.75, 8.5 and 11.25. Figure 11 shows the variation of the growth rate of the subharmonic cross-wave disturbances as a function of the domain size. The growth rate is seen to become independent of the domain size for
 $(r_{2}-r_{1})/\unicode[STIX]{x1D706}_{0}>8.5$, beyond which the domain size has a negligible effect on the growth rate of unstable subharmonic cross-wave disturbances.
The variation of the growth rate of subharmonic cross-wave disturbance in the ring waves (of frequency  $2\unicode[STIX]{x1D714}_{0}=40\unicode[STIX]{x03C0}~\text{rad}~\text{s}^{-1}$) on the computational domain size
 $k_{0}r_{2}$. The plotted curves are for subharmonic cross-wave disturbance with azimuthal wavenumber
 $m=5$ in base ring wave with
 $a/r_{1}=0.12$ (—▪—), and
 $m=3$ and
 $a/r_{1}=0.15$ (—●—).

6 Comparison with the weakly nonlinear theory prediction for a vertically oscillating half-submerged sphere
Shen & Liu (Reference Shen and Liu2019) derived a weakly nonlinear theory for the subharmonic resonant interaction of an axial-symmetric base ring wave (by a vertical circular cylinder or a floating sphere) with its subharmonic radial cross-waves using the averaged Lagrangian method. The theory predicts that the subharmonic cross-wave grows exponentially with time by taking energy from the base ring wave when the oscillation amplitude of the body exceeds a (dimensionless) threshold value. The theory provides a basic understanding of the cross-wave instability behaviours and dependence on key physical parameters. The theory is, however, limited to small base ring waves. By comparing the results from fully nonlinear numerical simulations and the weakly nonlinear theory, we can examine the finite-amplitude effects of ring waves on the cross-wave instability.
Comparison of the normalized growth rate ( $\unicode[STIX]{x1D70E}_{m}$) of subharmonic cross-wave disturbances in base ring waves by vertical oscillations of a floating sphere, which are obtained from direct numerical simulations and the weakly nonlinear theory of Shen & Liu (Reference Shen and Liu2019), as a function of sphere oscillation amplitude
 $\unicode[STIX]{x1D700}$. (a), (b) and (c) are for the ring wave with oscillation frequency
 $2\unicode[STIX]{x1D714}_{0}=40\unicode[STIX]{x03C0}~\text{rad}~\text{s}^{-1}$ and sphere radius
 $k_{0}r_{1}=3.98$ while (d) is for the ring wave with
 $2\unicode[STIX]{x1D714}_{0}=35\unicode[STIX]{x03C0}~\text{rad}~\text{s}^{-1}$ and
 $k_{0}r_{1}=3.37$. The symbols represent the results from fully nonlinear simulations for the cross-wave disturbance with azimuthal wavenumber
 $m=3$ (—●—),
 $m=4$ (—▴—) and
 $m=5$ (—▪—). The solid line (——) denotes the corresponding theoretical prediction.

Comparison of the envelopes of subharmonic cross-wave modes  $\unicode[STIX]{x1D6F1}_{m1}(r)$ from fully nonlinear simulations (——) and the weakly nonlinear theory (– – –) of Shen & Liu (Reference Shen and Liu2019). (a) is for the ring wave with frequency
 $2\unicode[STIX]{x1D714}_{0}=40\unicode[STIX]{x03C0}~\text{rad}~\text{s}^{-1}$ and sphere oscillation amplitude
 $a/r_{1}=0.12$ and cross-wave with azimuthal wavenumber
 $m=5$; and (b) is for
 $2\unicode[STIX]{x1D714}_{0}=40\unicode[STIX]{x03C0}~\text{rad}~\text{s}^{-1}$,
 $a/r_{1}=0.133$, and
 $m=4$.

Comparison of the threshold value of sphere oscillation amplitude ( $\unicode[STIX]{x1D700}_{c}$) from fully nonlinear simulations and the weakly nonlinear theory of Shen & Liu (Reference Shen and Liu2019) for different subharmonic cross-wave modes as a function of sphere oscillation frequency (
 $k_{0}r_{1}$). The plotted curves are the theoretical predictions for azimuthal wavenumber of cross-waves
 $m=3$ (——),
 $m=4$ (– – –),
 $m=5$ (— ⋅ —) and
 $m=6$ (
 $\cdots \cdots$). The symbols represent the results from fully nonlinear simulations for
 $m=3$ (●),
 $m=4$ (▴),
 $m=5$ (▪) and
 $m=6$ (♦).

Figure 12 shows the comparison of the growth rates of subharmonic cross-wave disturbances obtained by the fully nonlinear numerical simulations and the weakly nonlinear theory. The result displayed in figure 12 is the variation of the normalized growth rate  $\unicode[STIX]{x1D70E}_{m}=\unicode[STIX]{x1D706}_{m1}/(\unicode[STIX]{x1D714}_{0}\unicode[STIX]{x1D700})$ of the unstable subharmonic
 $m$th cross-wave mode with the dimensionless oscillation amplitude
 $\unicode[STIX]{x1D700}\equiv k_{0}a$. Two ring-wave frequencies of
 $2\unicode[STIX]{x1D714}_{0}=40\unicode[STIX]{x03C0}~\text{rad}~\text{s}^{-1}$ and
 $35\unicode[STIX]{x03C0}~\text{rad}~\text{s}^{-1}$ and three subharmonic cross-wave modes with
 $m=3$, 4 and 5 are considered. It is seen that the weakly nonlinear theory generally over-predicts
 $\unicode[STIX]{x1D70E}_{m}$ in comparison to the fully nonlinear simulation results. The over-prediction becomes considerable for larger values of
 $\unicode[STIX]{x1D700}$ (corresponding to steeper ring waves). One main reason for the over-prediction by the weakly nonlinear theory is that compared to the linearized ring wave solution (used in weakly nonlinear analysis) for the same forced sphere oscillation, the amplitude of the first harmonic of the finite-amplitude ring wave is generally smaller owing to nonlinear effects that cause energy transfer to the higher harmonics.
Figure 13 compares the envelopes of the unstable subharmonic cross-wave mode  $\unicode[STIX]{x1D6F1}_{m1}(r)$ (cf. (2.18)) from the fully nonlinear simulation and the weakly nonlinear theory. Two representative results are presented. The envelope
 $\unicode[STIX]{x1D6F1}_{m1}(r)$ has a relatively complicated varying shape in the near-field of the body and exhibits a simple decaying shape along the radial direction in the far field of the body. Good agreement between the nonlinear numerical simulation result and the theoretical prediction is seen. This indicates that the nonlinearity of the ring wave does not significantly affect the envelope of the unstable cross-wave modes.
The comparison of the threshold value of the (dimensionless) sphere oscillation amplitude  $\unicode[STIX]{x1D700}_{c}$, beyond which the ring wave is unstable, to subharmonic cross-wave disturbances for different cross-wave modes, is presented in figure 14 over a range of oscillation frequencies. The agreement between the nonlinear simulation and the weakly nonlinear theory is quite good. This is not surprising since the ring wave steepness is relatively small at the threshold value. We remark that in TIO’s experiment, the azimuthal wavenumber of the most unstable cross-wave mode is observed to be
 $m^{\ast }\approx 1.2k_{0}r_{1}$. With the understanding that the most unstable mode has the lowest value of
 $\unicode[STIX]{x1D700}_{c}$, the results in figure 14 from both fully nonlinear simulations and weakly nonlinear theory match this characteristic feature well. Specifically, it seen from figure 14 that in the region around
 $k_{0}r_{1}=2.5$, the lowest value of
 $\unicode[STIX]{x1D700}_{c}$ is achieved by
 $m=3$; in the region around
 $k_{0}r_{1}=3.5$, the lowest value of
 $\unicode[STIX]{x1D700}_{c}$ is achieved by
 $m=4$; and in the region around
 $k_{0}r_{1}=4.5$, the lowest value of
 $\unicode[STIX]{x1D700}_{c}$ is achieved by
 $m=5$. This matches the approximate relation
 $m^{\ast }\approx 1.2k_{0}r_{1}$.
7 Comparison with experimental data
Comparison of the overall threshold value of the (dimensionless) sphere oscillation amplitude ( $\unicode[STIX]{x1D700}_{c}$) over a range of oscillation frequencies (
 $k_{0}r_{1}$), obtained from fully nonlinear simulations without viscous effects (– – –) and with viscous effects (——) and TIO’s experimental data (— ⋅ —). The symbols represent that the ring wave is stable (○) and unstable (●) from fully nonlinear simulations without the inclusion of viscous effects.

In figure 15, we compare the fully nonlinear simulation result with TIO’s experimental data for the overall threshold value of sphere oscillation amplitude  $\unicode[STIX]{x1D700}_{c}$, beyond which the ring wave is unstable, over a range of oscillation frequencies. It is seen that
 $\unicode[STIX]{x1D700}_{c}$ from the fully nonlinear simulation in the context of potential flow is approximately 50 % smaller than TIO’s experimental data.
To examine the non-potential flow effects on  $\unicode[STIX]{x1D700}_{c}$, we include the viscous effects into our fully nonlinear simulation. For wave radiation in a tank/basin, the viscous damping on surface wave motion is predominantly from the viscous boundary layer effects on the body/tank surface and free surface (Miles Reference Miles1967; Mei & Liu Reference Mei and Liu1973). To account for these viscous effects in the potential-flow-based simulation, we include a viscous damping layer on the free surface (e.g. Liu et al. Reference Liu, Xue and Yue2001) with an equivalent damping coefficient
 $\unicode[STIX]{x1D708}_{q}$. For gravity–capillary waves, the contributions to
 $\unicode[STIX]{x1D708}_{q}$ from the sphere-surface and free-surface boundary layers are of the same order of magnitude,
 $O(\unicode[STIX]{x1D700}_{v})$, where
 $\unicode[STIX]{x1D700}_{v}=k_{0}\sqrt{\unicode[STIX]{x1D708}/\unicode[STIX]{x1D714}_{0}}$ and
 $\unicode[STIX]{x1D708}$ is the kinematic viscosity of water. The details of estimating the distribution and value of
 $\unicode[STIX]{x1D708}_{q}$ from the sphere-surface and free-surface boundaries are described in appendix D.
Once the viscous effects are taken into account, the threshold value  $\unicode[STIX]{x1D700}_{c}$ predicted by the nonlinear simulation matches TIO’s experimental data excellently, as shown in figure 15. The comparison of
 $\unicode[STIX]{x1D700}_{c}$ in figure 15 is consistent with the general expectation that inclusion of viscosity to the wave making system reduces the amplitude of the ring wave (with the same sphere oscillation amplitude), and thus increases the value of
 $\unicode[STIX]{x1D700}_{c}$ for the occurrence of instability. We point out that the inclusion of viscous effects would also generally reduce the growth rate of unstable modes. This effect is of particular importance near the neutral instability as it may change the characteristic behaviour of the wave/flow stability (i.e. from being unstable to stable). The inclusion of viscous effects is known to be less important to the mode shape and frequency of unstable modes (e.g. Wu, Liu & Yue Reference Wu, Liu and Yue2006). We thus do not include the viscous effect in our study in the following two sections (§§ 8, 9).
8 Dependence of instability on other physical parameters
8.1 Initial disturbance phase effect
To understand the effect of the phase of the initial distance upon the instability, we consider the initial cross-wave disturbance with an arbitrary initial phase  $\unicode[STIX]{x1D6FA}_{0}$ with free-surface potential and elevation of the disturbance given by
 $$\begin{eqnarray}(k_{0}^{2}/\unicode[STIX]{x1D714}_{0})\overline{\unicode[STIX]{x1D719}}_{m}^{\prime }=\text{Re}(\overline{\unicode[STIX]{x1D711}}_{m}\text{e}^{-\text{i}\unicode[STIX]{x1D714}_{0}t}\text{e}^{\text{i}\unicode[STIX]{x1D6FA}_{0}});\quad k_{0}\overline{\unicode[STIX]{x1D701}}_{m}^{\prime }=\text{Re}(\overline{\unicode[STIX]{x1D702}}_{m}\text{e}^{-\text{i}\unicode[STIX]{x1D714}_{0}t}\text{e}^{\text{i}\unicode[STIX]{x1D6FA}_{0}}),\end{eqnarray}$$
where  $\overline{\unicode[STIX]{x1D711}}_{m}(r,\unicode[STIX]{x1D714}_{0})$ and
 $\overline{\unicode[STIX]{x1D702}}_{m}(r,\unicode[STIX]{x1D714}_{0})$ are obtained from appendix C. At the initial time
 $t=0$, we add small cross-wave (with
 $m=5$) disturbances with
 $\unicode[STIX]{x1D6FA}_{0}=\unicode[STIX]{x03C0}/4$,
 $\unicode[STIX]{x03C0}/2$,
 $3\unicode[STIX]{x03C0}/4$ and
 $\unicode[STIX]{x03C0}$ to the ring wave field (with
 $2\unicode[STIX]{x1D714}_{0}=40\unicode[STIX]{x03C0}~\text{rad}~\text{s}^{-1}$ and
 $a/r_{1}=0.12$) to investigate the initial disturbance phase effect on the instability development. Figure 16 compares the time evolution of the growth rate
 $\unicode[STIX]{x1D706}_{51}(r=r_{1})$ of unstable subharmonic (
 $\unicode[STIX]{x1D714}_{0}$) component of azimuthal wavenumber
 $m=5$ for different
 $\unicode[STIX]{x1D6FA}_{0}$ values. It is seen that
 $\unicode[STIX]{x1D6FA}_{0}$ apparently influences the initial evolution of
 $\unicode[STIX]{x1D706}_{51}$, but does not alter its steady state value after the initial transient effect vanishes.
This phenomenon bears a resemblance to the ‘phase-locks’ in subharmonic resonance of a simple pendulum (Bogoliubonv & Mitropolsryy Reference Bogoliubonv and Mitropolsryy1961; Minorsky Reference Minorsky1974). In the pendulum case, both the amplitude and phase of the disturbance initially vary with time and depend on each other in a complicated way. The phase will eventually diminish/increase to the locked phase, and the amplitude will exponentially grow/decay with time. In the present case, the cross-wave’s locked phase is seen to be around  $\unicode[STIX]{x1D6FA}_{0}=\unicode[STIX]{x03C0}/4$. The locked phase value, however, may depend on the base ring wave and disturbance cross-wave parameters.
The time history of the growth rate  $\unicode[STIX]{x1D706}_{51}$ of unstable subharmonic cross-wave (
 $m=5$) with different initial phases:
 $\unicode[STIX]{x1D6FA}_{0}=\unicode[STIX]{x03C0}/4$ (——),
 $\unicode[STIX]{x1D6FA}_{0}=\unicode[STIX]{x03C0}/2$ (– – –),
 $\unicode[STIX]{x1D6FA}_{0}=3\unicode[STIX]{x03C0}/4$ (— ⋅ —) and
 $\unicode[STIX]{x1D6FA}_{0}=\unicode[STIX]{x03C0}$ (— ⋅ ⋅ —). For the base ring wave,
 $2\unicode[STIX]{x1D714}_{0}=40\unicode[STIX]{x03C0}~\text{rad}~\text{s}^{-1}$,
 $k_{0}r_{1}=3.98$ and
 $a/r_{1}=0.12$.

8.2 Initial disturbance wavenumber (shape) effect
It is of interest to see whether the wavenumber (related to the spatial shape) of the initial disturbance influences the formation of unstable modes of the ring wave. To study this, we consider the base ring wave with  $2\unicode[STIX]{x1D714}_{0}=40\unicode[STIX]{x03C0}~\text{rad}~\text{s}^{-1}$,
 $k_{0}r_{1}=3.98$ and
 $a/r_{1}=0.12$. The initial disturbance corresponding to cross-wave modes (
 $m=5$) with frequency
 $0.5\unicode[STIX]{x1D714}_{0}$,
 $2\unicode[STIX]{x1D714}_{0}$ and
 $3\unicode[STIX]{x1D714}_{0}$ is added into the base ring wave, separately. Figure 17 shows the time evolution of the harmonic amplitudes of disturbance elevation at
 $r=r_{1}$ (near the waterline) during the nonlinear evolution of the disturbed ring wave field, obtained with initial disturbances of a different shape. It can be seen that, even though the initial cross-wave disturbance possesses a different shape (wavenumber or frequency), the
 $\unicode[STIX]{x1D714}_{0}$ component (that is a subharmonic to the base ring wave) is always excited, due to the non-orthogonality of the
 $\unicode[STIX]{x1D714}_{0}$ cross-wave mode with all other modes of different frequencies, and grows exponentially with time, eventually becoming a significant component comparable to the base ring wave component in the wave field. This result indicates that the (unstable) subharmonic cross-waves will be predominantly developed in the ring wave field for any initial disturbance.
We remark that without the addition of initial seeded cross-wave perturbations, the small numerical noise in the simulation would also lead to the apparent development of sub-harmonic unstable modes, but with a much longer time of simulation due to the small amplitude of the numerical noise. To reduce the computational cost associated with the long-time simulation, in this work, we choose to add seeded perturbations (with their amplitudes much larger than the numerical noise) to examine the development of dominant unstable modes of the ring wave.
The time history of the harmonic amplitudes of disturbance elevation near the waterline with the initial cross-wave ( $m=5$) disturbance frequency equal to (a)
 $0.5\unicode[STIX]{x1D714}_{0}$, (b)
 $2\unicode[STIX]{x1D714}_{0}$ and (c)
 $3\unicode[STIX]{x1D714}_{0}$. For the base ring wave,
 $2\unicode[STIX]{x1D714}_{0}=40\unicode[STIX]{x03C0}~\text{rad}~\text{s}^{-1}$,
 $k_{0}r_{1}=3.98$ and
 $a/r_{1}=0.12$. The plotted curves represent the amplitudes of harmonic components with frequency equal to
 $0\unicode[STIX]{x1D714}_{0}$ (
 $\cdots \cdots$),
 $0.5\unicode[STIX]{x1D714}_{0}$ (— —),
 $\unicode[STIX]{x1D714}_{0}$ (——),
 $2\unicode[STIX]{x1D714}_{0}$ (– – –),
 $3\unicode[STIX]{x1D714}_{0}$ (— ⋅ —) and
 $4\unicode[STIX]{x1D714}_{0}$ (— ⋅ ⋅ —).

9 Interactions of multiple unstable modes
In the case of a steep ring wave, nonlinear interactions among unstable cross-wave modes can cause the generation of new multiple unstable cross-waves that can be further developed due to the instability effect of the ring wave, leading to the formation of complex wave patterns observed in experiments. For illustration, we choose a relatively large-amplitude ring wave with frequency  $2\unicode[STIX]{x1D714}_{0}=35\unicode[STIX]{x03C0}~\text{rad}~\text{s}^{-1}$, radiated by the vertical oscillation of the sphere of radius
 $k_{0}r_{1}=3.37$ with oscillation amplitude
 $a/r_{1}=0.20$ (corresponding
 $\unicode[STIX]{x1D700}\equiv k_{0}a=0.67$). This ring wave is unstable to subharmonic cross-wave modes with azimuthal wavenumber
 $m=2$, 3, 4 and 5. We add a small initial disturbance, which is composed of two subharmonic cross-wave modes (
 $m=2$ and 5) with the slopes
 $s_{02}=s_{05}=0.04$, into the ring wave field to investigate nonlinear evolution features of the disturbed wave field.
Figure 18 displays the time history of the azimuthal mode amplitudes ( $m=2$, 3, 4 and 5) of the disturbance elevation at the waterline of the sphere during the evolution of the disturbed ring wave field. The
 $m=3$ and 4 cross-wave modes are generated by the quadratic interaction of the
 $m=5$ and 2 modes and quadratic self-interaction of the
 $m=2$ mode. As shown in figure 18, the amplitudes of the
 $m=3$ and 4 cross-wave modes are initially negligibly small and start to be noticeable after the evolution of approximately
 $10T_{0}$, and become dominant after the evolution of approximately
 $20T_{0}$ due to their growth rates being much larger than those of the
 $m=2$ and 5 cross-wave modes. The simulation then soon breaks down due to the rapid growth of the
 $m=3$ and 4 modes.
The time history of azimuthal mode amplitude of the disturbance wave elevation  $\overline{\unicode[STIX]{x1D701}}_{m}^{\prime }$ at the waterline of the sphere. For the base ring wave,
 $2\unicode[STIX]{x1D714}_{0}=35\unicode[STIX]{x03C0}~\text{rad}~\text{s}^{-1}$,
 $k_{0}r_{1}=3.37$ and
 $a/r_{1}=0.2$. The initial disturbance consists of two cross-wave modes of
 $m=2$ and 5 with frequency
 $\unicode[STIX]{x1D714}_{0}$ and initial slope
 $s_{02}=s_{05}=0.5s_{0}=0.04$. The time shown here is recounted from the moment when the disturbance is added. The plotted curves are for cross-wave modes with
 $m=2$ (— ⋅ —),
 $m=3$ (——),
 $m=4$ (– – –) and
 $m=5$ (— ⋅ ⋅ —).

Figures 19(a), 19(b), 19(c) and 19(d) show the time evolution of the modules of harmonic components ( $n=1$, 2) for azimuthal modes
 $m=2$, 5 (initially added) and
 $m=3$, 4 (generated by nonlinear interactions), respectively. The results in figures 19(c) and 19(d) show the subharmonic components (
 $n=1$) of the
 $m=3$ and 4 modes grow rapidly from very small initial values resulting from nonlinear interactions of the added
 $m=2$ and 5 cross-wave modes. We note that for the
 $m=3$ mode, the harmonic component (i.e.
 $n=2$ with frequency
 $2\unicode[STIX]{x1D714}_{0}$) is also seen to grow, but at a much slower rate than the subharmonic component. The growth of this
 $n=2$ harmonic component is a direct result of the (sum-frequency) quadratic interaction of unstable subharmonic
 $m=2$ and 5 cross-wave modes. For the
 $m=4$ mode, the growth of the
 $n=2$ harmonic component resulting from the double-frequency self-interaction of the unstable subharmonic
 $m=2$ cross-wave mode is seen to be negligibly slow.
The time variation of the harmonic component amplitudes ( $n=1$, 2) of the
 $m$th azimuthal mode amplitude of the disturbance wave elevation at the waterline of the sphere for the same case in figure 18. The results are for azimuthal modes with (a)
 $m=2$, (b)
 $m=5$, (c)
 $m=3$ and (d)
 $m=4$. The plotted curves are for harmonic components of
 $n=1$ (——) and
 $n=2$ (– – –).

Figure 20 displays the wave-field contour snapshots at four instants. The small disturbance composed of  $m=2$ and 5 cross-wave modes is added into the base ring wave at the initial time
 $t_{1}=0$. Initially the amplitudes of cross-waves are very small and it is hard to distinguish them from the ring wave, as shown in figure 20(a). At
 $t_{1}/T_{0}=19.3$, the
 $m=5$ mode can be observed clearly, as shown in figure 20(b). As evolution continues, at
 $t_{1}/T_{0}=21.8$, the cross-wave field looks more like the combination of
 $m=3$, 4, 5 modes, as shown in figure 20(c), due to the fast growth of the
 $m=3$ and
 $m=4$ modes. At
 $t_{1}/T_{0}=22.3$, the cross-wave field looks to be more dominated by the
 $m=4$ mode since it has the largest growth rate (cf. figure 19d), as shown in figure 20(d). This illustrates that for a large-amplitude ring wave, the wave field can evolve to become irregular due to nonlinear interactions of multiple unstable subharmonic cross-wave modes.
The contour snapshots of the total wave field in the presence of multiple unstable modes at the instant (a)  $t_{1}=0$, (b)
 $t_{1}/T_{0}=19.3$, (c)
 $t_{1}/T_{0}=21.8$ and (d)
 $t_{1}/T_{0}=22.3$ in the evolution. The case is the same as in figure 18.

10 Conclusions
We apply direct numerical simulations of fully nonlinear gravity–capillary wave–body interactions to investigate the instability of finite-amplitude progressive (axial-symmetric) ring waves radiated by the vertical harmonic oscillation of a half-submerged sphere (of radius  $r_{1}$) in deep water. The numerical simulation is based on the potential flow formulation with the use of a mixed Euler–Lagrangian quadratic boundary-element method. The MEL-QBEM, which was originally developed for the simulation of fully nonlinear gravity wave dynamics and interactions with floating bodies, is extended to include the surface tension effect in the present study. The numerical simulations are validated against the analytic solutions of linearized ring waves and radial cross-waves of a vertical circular cylinder (with swelling–contraction motion) and a floating sphere (with high frequency oscillation).
Through numerical nonlinear simulations, we observe that the outgoing progressive ring waves become unstable to small cross-wave disturbances when the dimensionless oscillation amplitude ( $k_{0}a$) of the sphere exceeds the threshold value
 $\unicode[STIX]{x1D700}_{c}$, where
 $k_{0}$ is the ring wave wavenumber at subharmonic frequency (
 $\unicode[STIX]{x1D714}_{0}$) and
 $a$ is dimensional oscillation amplitude. The (steady state) unstable modes are associated with the subharmonic radial cross-waves and are independent of the wavenumber (shape) and phase of the initial disturbance. The unstable mode shape is given by the linearized cross-wave profile multiplied by a slowly space-varying amplitude envelope. The growth rate generally increases with
 $k_{0}a$ for given frequency
 $k_{0}r_{1}$. The maximum growth rate is achieved for the cross-wave mode with azimuthal wavenumber
 $m^{\ast }\sim 1.2k_{0}r_{1}$. These characteristic features of the instability of ring waves obtained from direct numerical simulations are consistent with TIO’s experimental observations. Significantly, the threshold value
 $\unicode[STIX]{x1D700}_{c}$ predicted by nonlinear simulations with the inclusion of viscous effects in the body and free-surface boundary layers matches TIO’s experimental data well. Moreover, comparisons of nonlinear simulation results with the weakly nonlinear theoretical predictions indicate that viscous and nonlinear effects of finite-amplitude ring waves generally reduce the growth rates but have a negligible influence on the shapes of unstable modes. Furthermore, numerical simulations also show that peculiar free surface patterns, as observed in TIO’s experiments, can be developed through the excitation of broadbanded subharmonic unstable cross-waves by nonlinear interactions of multiple unstable modes during long-time evolution of steep ring waves.
Acknowledgement
This research is supported financially by grants from the Office of Naval Research (N00014-16-1-3105; N00014-15-1-2460).
Declaration of interests
The authors report no conflict of interest.
Appendix A. Numerical evaluation of  $\unicode[STIX]{x1D735}\boldsymbol{\cdot }\boldsymbol{n}$ on the surface

In the numerical simulation of gravity–capillary wave dynamics, it is necessary to evaluate the second-derivative term  $\unicode[STIX]{x1D735}\boldsymbol{\cdot }\boldsymbol{n}$ on the free surface,
 $z=\unicode[STIX]{x1D701}(r,\unicode[STIX]{x1D713},t)$, at any time (cf. (2.3)). In terms of two curvilinear coordinates
 $\unicode[STIX]{x1D6FC}$ and
 $\unicode[STIX]{x1D6FD}$ on the free surface, the normal direction of the free surface
 $\boldsymbol{n}$ can be expressed as,
 $$\begin{eqnarray}\boldsymbol{n}=\frac{\boldsymbol{r}_{\unicode[STIX]{x1D6FC}}\times \boldsymbol{r}_{\unicode[STIX]{x1D6FD}}}{|\boldsymbol{r}_{\unicode[STIX]{x1D6FC}}\times \boldsymbol{r}_{\unicode[STIX]{x1D6FD}}|},\end{eqnarray}$$
where  $\boldsymbol{r}=(r\cos \unicode[STIX]{x1D713},r\sin \unicode[STIX]{x1D713},y,z)$ is the position vector, and
 $\boldsymbol{r}_{\unicode[STIX]{x1D6FC}}$ and
 $\boldsymbol{r}_{\unicode[STIX]{x1D6FD}}$ represent the derivative with respect to the curvilinear coordinates
 $\unicode[STIX]{x1D6FC}$ and
 $\unicode[STIX]{x1D6FD}$. Using the expression for the divergent operator in curvilinear space (Thompson, Warsi & Mastin Reference Thompson, Warsi and Mastin1985), we have
 $$\begin{eqnarray}\unicode[STIX]{x1D735}\boldsymbol{\cdot }\boldsymbol{n}=\frac{1}{(\boldsymbol{r}_{\unicode[STIX]{x1D6FC}}\times \boldsymbol{r}_{\unicode[STIX]{x1D6FD}})\boldsymbol{\cdot }\boldsymbol{n}}\left[\frac{\unicode[STIX]{x2202}\boldsymbol{n}}{\unicode[STIX]{x2202}\unicode[STIX]{x1D6FC}}\boldsymbol{\cdot }(\boldsymbol{r}_{\unicode[STIX]{x1D6FD}}\times \boldsymbol{n})+\frac{\unicode[STIX]{x2202}\boldsymbol{n}}{\unicode[STIX]{x2202}\unicode[STIX]{x1D6FD}}\boldsymbol{\cdot }(\boldsymbol{n}\times \boldsymbol{r}_{\unicode[STIX]{x1D6FC}})\right].\end{eqnarray}$$
Using  $\boldsymbol{n}$ in (A 1) and with some simplifications based on vector identities, we have
 $$\begin{eqnarray}\frac{\unicode[STIX]{x2202}\boldsymbol{n}}{\unicode[STIX]{x2202}\unicode[STIX]{x1D6FC}}\boldsymbol{\cdot }(\boldsymbol{r}_{\unicode[STIX]{x1D6FD}}\times \boldsymbol{n})=\frac{-(\boldsymbol{r}_{\unicode[STIX]{x1D6FC}\unicode[STIX]{x1D6FC}}\boldsymbol{\cdot }\boldsymbol{n})(\boldsymbol{r}_{\unicode[STIX]{x1D6FD}}\boldsymbol{\cdot }\boldsymbol{r}_{\unicode[STIX]{x1D6FD}})+(\boldsymbol{r}_{\unicode[STIX]{x1D6FC}\unicode[STIX]{x1D6FD}}\boldsymbol{\cdot }\boldsymbol{n})(\boldsymbol{r}_{\unicode[STIX]{x1D6FC}}\boldsymbol{\cdot }\boldsymbol{r}_{\unicode[STIX]{x1D6FD}})}{|\boldsymbol{r}_{\unicode[STIX]{x1D6FC}}\times \boldsymbol{r}_{\unicode[STIX]{x1D6FD}}|}\end{eqnarray}$$
and
 $$\begin{eqnarray}\frac{\unicode[STIX]{x2202}\boldsymbol{n}}{\unicode[STIX]{x2202}\unicode[STIX]{x1D6FD}}\boldsymbol{\cdot }(\boldsymbol{r}_{\unicode[STIX]{x1D6FC}}\times \boldsymbol{n})=\frac{-(\boldsymbol{r}_{\unicode[STIX]{x1D6FD}\unicode[STIX]{x1D6FD}}\boldsymbol{\cdot }\boldsymbol{n})(\boldsymbol{r}_{\unicode[STIX]{x1D6FC}}\boldsymbol{\cdot }\boldsymbol{r}_{\unicode[STIX]{x1D6FC}})+(\boldsymbol{r}_{\unicode[STIX]{x1D6FC}\unicode[STIX]{x1D6FD}}\boldsymbol{\cdot }\boldsymbol{n})(\boldsymbol{r}_{\unicode[STIX]{x1D6FC}}\boldsymbol{\cdot }\boldsymbol{r}_{\unicode[STIX]{x1D6FD}})}{|\boldsymbol{r}_{\unicode[STIX]{x1D6FC}}\times \boldsymbol{r}_{\unicode[STIX]{x1D6FD}}|}.\end{eqnarray}$$
Substitution of (A 1), (A 3) and (A 4) into (A 2) leads to
 $$\begin{eqnarray}\unicode[STIX]{x1D735}\boldsymbol{\cdot }\boldsymbol{n}=\frac{-(\boldsymbol{r}_{\unicode[STIX]{x1D6FD}\unicode[STIX]{x1D6FD}}\boldsymbol{\cdot }\boldsymbol{n})(\boldsymbol{r}_{\unicode[STIX]{x1D6FC}}\boldsymbol{\cdot }\boldsymbol{r}_{\unicode[STIX]{x1D6FC}})+2(\boldsymbol{r}_{\unicode[STIX]{x1D6FC}\unicode[STIX]{x1D6FD}}\boldsymbol{\cdot }\boldsymbol{n})(\boldsymbol{r}_{\unicode[STIX]{x1D6FC}}\boldsymbol{\cdot }\boldsymbol{r}_{\unicode[STIX]{x1D6FD}})-(\boldsymbol{r}_{\unicode[STIX]{x1D6FC}\unicode[STIX]{x1D6FC}}\boldsymbol{\cdot }\boldsymbol{n})(\boldsymbol{r}_{\unicode[STIX]{x1D6FD}}\boldsymbol{\cdot }\boldsymbol{r}_{\unicode[STIX]{x1D6FD}})}{|\boldsymbol{r}_{\unicode[STIX]{x1D6FC}}\times \boldsymbol{r}_{\unicode[STIX]{x1D6FD}}|^{2}}.\end{eqnarray}$$
This form of  $\unicode[STIX]{x1D735}\boldsymbol{\cdot }\boldsymbol{n}$ contains the first- and second-derivatives of
 $\boldsymbol{r}$ with respect to
 $\unicode[STIX]{x1D6FC}$ and
 $\unicode[STIX]{x1D6FD}$ only, which can be effectively evaluated using the finite difference method in the parametric space in QBEM.
Appendix B. High-frequency asymptotic ring wave solution
We derive the high-frequency asymptotic linear solution of ring waves by vertical oscillation of a half-submerged sphere of radius  $r_{1}$. Let the oscillation frequency be
 $2\unicode[STIX]{x1D714}_{0}$ and the oscillation amplitude be
 $a$. The wavenumber of the ring wave is denoted as
 $k_{2}$. At high frequency,
 $k_{2}r_{1}\gg 1$, the generated ring wave is confined to a thin free surface layer and is asymptotically equivalent to the ring wave radiated by the radial oscillation of a vertical circular cylinder of radius
 $r_{1}$ in the horizontal plane with oscillation velocity amplitude equal to
 $3\unicode[STIX]{x1D714}_{0}a/k_{2}r_{1}$ (Hulme Reference Hulme1982). The cylinder wave maker problem in the context of gravity waves has been solved by Havelock (Reference Havelock1929) and extended by Rhodes-Robinson (Reference Rhodes-Robinson1971) to include the surface tension effect. From Rhodes-Robinson (Reference Rhodes-Robinson1971), we thus obtain the high-frequency asymptotic ring wave solution for the case of a sphere. The solution of the velocity potential and ring wave profile can be expressed as
 $\unicode[STIX]{x1D719}(r,z,t)=\text{Re}\{\unicode[STIX]{x1D711}(r,z)\text{e}^{-\text{i}2\unicode[STIX]{x1D714}_{0}t}\}$ and
 $\unicode[STIX]{x1D701}(r,t)=\text{Re}\{\unicode[STIX]{x1D702}(r)\text{e}^{-\text{i}2\unicode[STIX]{x1D714}_{0}t}\}$ with the amplitudes given by
 $$\begin{eqnarray}\unicode[STIX]{x1D711}(r,z)\simeq \frac{6\unicode[STIX]{x1D714}_{0}a}{k_{2}^{2}r_{1}}\text{e}^{k_{2}z}\frac{1+M_{0}k_{2}^{2}}{1+3M_{0}k_{2}^{2}}\frac{H_{0}^{(1)}(k_{2}r)}{H_{0}^{(1)^{\prime }}(k_{2}r_{1})},\quad k_{2}r\gg 1\end{eqnarray}$$
and
 $$\begin{eqnarray}\unicode[STIX]{x1D702}(r)\simeq \frac{3a}{k_{2}r_{1}}\frac{1+M_{0}k_{2}^{2}}{1+3M_{0}k_{2}^{2}}\sqrt{\frac{r_{1}}{r}}\text{e}^{\text{i}k_{2}(r-r_{1})},\quad k_{2}r\gg 1,\end{eqnarray}$$
where  $M_{0}=T_{s}/\unicode[STIX]{x1D70C}_{w}g$,
 $H_{0}^{(1)}$ is the zeroth-order Hankel function of the first kind, and the prime denotes the derivative of the function with respect to the argument.
Appendix C. Numerical solution of radial cross-waves of a half-submerged sphere
We describe a boundary-element method for solving the linearized frequency-domain boundary value problem of radial cross-waves of a half-submerged sphere under the influence of gravity and surface tension. For harmonic motion with frequency  $\unicode[STIX]{x1D714}_{0}$, the velocity potential and free-surface elevation of cross-waves takes the form
 $$\begin{eqnarray}\unicode[STIX]{x1D719}(r,\unicode[STIX]{x1D713},z,t)=\text{Re}\{\unicode[STIX]{x1D711}(r,\unicode[STIX]{x1D713},z)\text{e}^{-\text{i}\unicode[STIX]{x1D714}_{0}t}\};\quad \unicode[STIX]{x1D701}=\text{Re}\{\unicode[STIX]{x1D702}(r,\unicode[STIX]{x1D713})\text{e}^{-\text{i}\unicode[STIX]{x1D714}_{0}t}\}.\end{eqnarray}$$
The time-independent potential  $\unicode[STIX]{x1D711}$ satisfies the Laplace equation inside the fluid domain
 $$\begin{eqnarray}\frac{\unicode[STIX]{x2202}^{2}\unicode[STIX]{x1D711}}{\unicode[STIX]{x2202}r^{2}}+\frac{1}{r}\frac{\unicode[STIX]{x2202}\unicode[STIX]{x1D711}}{\unicode[STIX]{x2202}r}+\frac{1}{r^{2}}\frac{\unicode[STIX]{x2202}^{2}\unicode[STIX]{x1D711}}{\unicode[STIX]{x2202}\unicode[STIX]{x1D713}^{2}}+\frac{\unicode[STIX]{x2202}^{2}\unicode[STIX]{x1D711}}{\unicode[STIX]{x2202}z^{2}}=0.\end{eqnarray}$$
By combining the linearized kinematic and dynamic free-surface boundary conditions, we obtain the boundary condition for  $\unicode[STIX]{x1D711}$ on the mean free surface
 $\bar{S}_{F}$ (i.e.
 $z=0$)
 $$\begin{eqnarray}-K\unicode[STIX]{x1D711}+\unicode[STIX]{x1D711}_{z}+M_{0}\unicode[STIX]{x1D711}_{zzz}=0,\quad \text{on }\bar{S}_{F},\end{eqnarray}$$
where  $K=\unicode[STIX]{x1D714}_{0}^{2}/g$. On the mean body surface
 $\bar{S}_{B}$, a homogeneous boundary condition is imposed
 $$\begin{eqnarray}\unicode[STIX]{x1D711}_{n}=0\quad \text{on }\bar{S}_{B}.\end{eqnarray}$$
On deep bottom  $S_{0}$,
 $$\begin{eqnarray}\unicode[STIX]{x1D711}_{n}=0,\quad \text{on }S_{0}.\end{eqnarray}$$
At the far field of the body  $S_{\infty }$, the radiation condition needs to be satisfied
 $$\begin{eqnarray}\sqrt{r}(-\text{i}k_{0}\unicode[STIX]{x1D711}+\unicode[STIX]{x1D711}_{r})\rightarrow 0,\quad r\rightarrow \infty ,\end{eqnarray}$$
where  $k_{0}$ is the radial wavenumber given by the real, positive root of
 $K=k_{0}(1+M_{0}k_{0}^{2})$. For the
 $m$th cross-wave mode, the free-surface slope
 $\unicode[STIX]{x1D702}_{r}$ at the waterline of the sphere (
 $r=r_{1}$) is specified, which gives the forcing condition for
 $\unicode[STIX]{x1D711}$
 $$\begin{eqnarray}\unicode[STIX]{x1D711}_{zr}=-\text{i}\unicode[STIX]{x1D714}_{0}\unicode[STIX]{x1D702}_{r}=-\text{i}\unicode[STIX]{x1D714}_{0}\cos m\unicode[STIX]{x1D713},\quad r=r_{1},z=0\end{eqnarray}$$
in which  $\unicode[STIX]{x1D702}_{r}$ is specified to have unit amplitude. Once
 $\unicode[STIX]{x1D711}$ is known,
 $\unicode[STIX]{x1D702}$ can be obtained in terms of
 $\unicode[STIX]{x1D711}$ from the dynamic free-surface boundary condition (cf. (2.3)).
In the case of a vertical circular cylinder, the above boundary value problem can be solved analytically (Shen & Liu Reference Shen and Liu2019). In the case of a sphere, a numerical method must be employed. We apply a boundary-element method to solve the above boundary value problem. By the use of Green’s second identity, we can reformulate the boundary value problem as the boundary integral equation
 $$\begin{eqnarray}\unicode[STIX]{x1D6FC}(\boldsymbol{r})\unicode[STIX]{x1D711}(\boldsymbol{r})+\iint _{\bar{S}_{B}+\bar{S}_{F}+S_{\infty }+S_{0}}[\unicode[STIX]{x1D711}(\boldsymbol{r}^{\prime })G_{n}(\boldsymbol{r};\boldsymbol{r}^{\prime })-\unicode[STIX]{x1D711}_{n}(\boldsymbol{r}^{\prime })G(\boldsymbol{r};\boldsymbol{r}^{\prime })]\,\text{d}S(\boldsymbol{r}^{\prime })=0\end{eqnarray}$$
for any  $\boldsymbol{r}$ in the fluid domain bounded by
 $\bar{S}_{B}$,
 $\bar{S}_{B}$,
 $S_{\infty }$ and
 $S_{0}$. Equation (C 8) indicates that
 $\unicode[STIX]{x1D711}$ anywhere inside the fluid is completely determined by
 $\unicode[STIX]{x1D711}$ and
 $\unicode[STIX]{x1D711}_{n}$ on the boundaries. Letting
 $\boldsymbol{r}$ approach the boundaries in (C 8), we obtain a boundary integral equation for unknown boundary quantities (
 $\unicode[STIX]{x1D711}$ or
 $\unicode[STIX]{x1D711}_{n}$). We employ the quadratic boundary-element method (Liu et al. Reference Liu, Xue and Yue2001; Mei et al. Reference Mei, Stiassnie and Yue2005) to solve this boundary integral equation, as in the time domain simulation. The details on the implementation and verification of the method can be found in Shen (Reference Shen2019).
Because of (C 7), we can factor out the  $\unicode[STIX]{x1D713}$ dependence and express the solution of
 $\unicode[STIX]{x1D711}$ and
 $\unicode[STIX]{x1D702}$ in the non-dimensional form
 $$\begin{eqnarray}(k_{0}^{2}/\unicode[STIX]{x1D714}_{0})\unicode[STIX]{x1D711}(r,\unicode[STIX]{x1D713},z)=\overline{\unicode[STIX]{x1D711}}_{m}(r,z)\cos m\unicode[STIX]{x1D713};\quad k_{0}\unicode[STIX]{x1D702}(r,\unicode[STIX]{x1D713})=\overline{\unicode[STIX]{x1D702}}_{m}(r)\cos m\unicode[STIX]{x1D713}.\end{eqnarray}$$
As an example, figures 21(a) and 21(b), respectively, display the real and imaginary parts of the  $m$th cross-wave profile
 $\overline{\unicode[STIX]{x1D702}}_{m}$ for
 $m=1$, 3, 5 and 7 with
 $\unicode[STIX]{x1D714}_{0}=20\unicode[STIX]{x03C0}~\text{rad}~\text{s}^{-1}$ for the case of a half-submerged sphere with radius
 $k_{0}r_{1}=3.98$.
(a) Real part and (b) imaginary part of radial cross-wave profiles at frequency  $\unicode[STIX]{x1D714}_{0}=20\unicode[STIX]{x03C0}~\text{rad}~\text{s}^{-1}$ for a half-submerged sphere with radius
 $k_{0}r_{1}=3.98$. The plotted curves are for azimuthal wavenumber
 $m=1$ (——),
 $m=3$ (– – –),
 $m=5$ (— ⋅ —) and
 $m=7$ (
 $\cdots \cdots$).

Appendix D. Estimation of equivalent viscous damping coefficient in numerical simulation
To account for the viscous damping effect in TIO’s experiments, we add an artificial damping layer on the free surface in the numerical simulation. We here estimate the equivalent damping coefficient  $\unicode[STIX]{x1D708}_{q}$, to the leading order
 $\unicode[STIX]{x1D700}_{v}$, to be applied in the numerical simulation. For the linear boundary layer analysis, we separate the total flow velocity
 $\boldsymbol{u}$ into the wave part (
 $\unicode[STIX]{x1D735}\unicode[STIX]{x1D711}$) and the rotational part (
 $\boldsymbol{U}$):
 $\boldsymbol{u}=\unicode[STIX]{x1D735}\unicode[STIX]{x1D719}+\boldsymbol{U}$. From Mei & Liu (Reference Mei and Liu1973), the rate of viscous dissipation in the body boundary layer is given by
 $$\begin{eqnarray}\langle D\rangle _{B}=\frac{1}{2}\unicode[STIX]{x1D70C}_{w}\unicode[STIX]{x1D708}\left\langle \int _{R_{B}}e_{ij}^{2}\,\text{d}V\right\rangle ,\end{eqnarray}$$
where  $\langle \rangle$ denotes a time average over one period of the oscillation,
 $R_{B}$ is the boundary layer region and
 $e_{ij}=u_{i,j}+u_{j,i}$ is the strain rate. Since the interest of the present study is on the high frequency wave by an oscillation sphere, the active boundary layer on the sphere is within the thin layer near the free surface. The sphere can be equivalently considered as a vertical circular cylinder of the same radius
 $r_{1}$ in the estimation of the viscous dissipation effect on the wave motion. Since
 $\boldsymbol{u}=0$ on the body surface, the rotational velocity components
 $\boldsymbol{U}_{B}\equiv (U_{B},V_{B},W_{B})$ in the
 $(r,\unicode[STIX]{x1D713},z)$ directions are
 $$\begin{eqnarray}U_{B}=0,\quad V_{B}=-\frac{1}{r_{1}}\unicode[STIX]{x1D711}_{\unicode[STIX]{x1D713}}\unicode[STIX]{x1D6E4}(\unicode[STIX]{x1D709}),\quad W_{B}=-\unicode[STIX]{x1D711}_{z}\unicode[STIX]{x1D6E4}(\unicode[STIX]{x1D709}),\end{eqnarray}$$
where  $\unicode[STIX]{x1D6E4}(\unicode[STIX]{x1D709})=\exp \{-(1-\text{i})/\sqrt{2}\unicode[STIX]{x1D709}\}$ and
 $\unicode[STIX]{x1D709}=k_{0}r/\unicode[STIX]{x1D700}_{v}$ (Mei & Liu Reference Mei and Liu1973). As a result, we obtain
 $$\begin{eqnarray}\displaystyle \langle D\rangle _{B} & = & \displaystyle \frac{1}{2}\unicode[STIX]{x1D70C}_{w}\unicode[STIX]{x1D700}_{v}\frac{\unicode[STIX]{x1D714}_{0}}{k_{0}}\int _{-\infty }^{0}\int _{0}^{2\unicode[STIX]{x03C0}}\int _{0}^{\infty }\left(\left|\frac{\unicode[STIX]{x2202}V_{B}}{\unicode[STIX]{x2202}r}\right|^{2}+\left|\frac{\unicode[STIX]{x2202}W_{B}}{\unicode[STIX]{x2202}r}\right|^{2}\right)r_{1}\,\text{d}r\,\text{d}\unicode[STIX]{x1D713}\,\text{d}z\nonumber\\ \displaystyle & = & \displaystyle \frac{\sqrt{2}}{4}\unicode[STIX]{x1D70C}_{w}\unicode[STIX]{x1D700}_{v}\frac{\unicode[STIX]{x1D714}_{0}}{k_{0}}r_{1}\int _{-\infty }^{0}\int _{0}^{2\unicode[STIX]{x03C0}}\left(\left.|\unicode[STIX]{x1D711}_{z}|^{2}+\left|\frac{1}{r_{1}}\unicode[STIX]{x1D711}_{\unicode[STIX]{x1D713}}\right|^{2}\right)\right|_{r=r_{1}}\,\text{d}\unicode[STIX]{x1D713}\,\text{d}z.\end{eqnarray}$$
From Miles (Reference Miles1967), the dissipation rate in the free surface in the presence of surface tension can also be  $O(\unicode[STIX]{x1D700}_{v})$ for a contaminated water surface. The maximum possible value of the rotational velocity for a fully contaminated water surface can be
 $|\boldsymbol{U}_{F}|^{2}=2|\unicode[STIX]{x1D735}\unicode[STIX]{x1D711}|^{2}$. We thus have the dissipation rate in the free surface
 $$\begin{eqnarray}\langle D\rangle _{F}=\frac{\sqrt{2}}{2}\unicode[STIX]{x1D70C}_{w}\unicode[STIX]{x1D700}_{v}\frac{\unicode[STIX]{x1D714}_{0}}{k_{0}}\int _{0}^{2\unicode[STIX]{x03C0}}\left\{\int _{r_{1}}^{r_{1}+L_{e}}+\int _{r_{1}+L_{e}}^{\infty }\right\}\left(|\unicode[STIX]{x1D711}_{r}|^{2}+\left|\frac{1}{r}\unicode[STIX]{x1D711}_{\unicode[STIX]{x1D713}}\right|^{2}\right)_{z=0}r\,\text{d}r\,\text{d}\unicode[STIX]{x1D713},\end{eqnarray}$$
where  $L_{e}$ is the length used to separate the near- and far-fields of the body for wave motion. For the near-field contribution, the integral needs to be evaluated numerically while the integral for the far-field contribution can be carried out analytically with the use of the asymptotic wave solution of
 $\unicode[STIX]{x1D711}$.
In direct numerical simulation, we add a damping layer on the free surface with the kinematic and dynamic boundary conditions modified in the form (e.g. Mei et al. Reference Mei, Stiassnie and Yue2005)
 $$\begin{eqnarray}\displaystyle & \displaystyle \unicode[STIX]{x1D701}_{t}+\unicode[STIX]{x1D735}\unicode[STIX]{x1D701}\boldsymbol{\cdot }\unicode[STIX]{x1D735}\unicode[STIX]{x1D719}-\unicode[STIX]{x1D719}_{z}=-\unicode[STIX]{x1D708}_{q}\unicode[STIX]{x1D714}_{0}\unicode[STIX]{x1D701},\quad z=\unicode[STIX]{x1D701}, & \displaystyle\end{eqnarray}$$
 $$\begin{eqnarray}\displaystyle & \displaystyle \unicode[STIX]{x1D719}_{t}+\frac{1}{2}\unicode[STIX]{x1D735}\unicode[STIX]{x1D719}\boldsymbol{\cdot }\unicode[STIX]{x1D735}\unicode[STIX]{x1D719}+g\unicode[STIX]{x1D701}+\frac{T_{s}}{\unicode[STIX]{x1D70C}_{w}}\unicode[STIX]{x1D735}\boldsymbol{\cdot }\boldsymbol{n}=-\frac{\unicode[STIX]{x1D708}_{q}\unicode[STIX]{x1D714}_{0}}{k_{0}}\unicode[STIX]{x1D719}_{n},\quad z=\unicode[STIX]{x1D701}, & \displaystyle\end{eqnarray}$$
where the numerical damping coefficient  $\unicode[STIX]{x1D708}_{q}$ is determined from the requirement that the numerical simulation achieves the equivalent total dissipation rate in the physical experiments.
For simplicity, we use the far-field asymptotic wave solution to estimate the energy dissipation by  $\unicode[STIX]{x1D708}_{q}$ in both near-body and far-field regions in the numerical simulation. The energy in a circular strip of unit radial length of the wave field decays as
 $$\begin{eqnarray}\langle Er\rangle =\langle Er_{0}\rangle \text{e}^{-2\unicode[STIX]{x1D708}_{q}\unicode[STIX]{x1D714}_{0}t},\end{eqnarray}$$
where  $\langle Er_{0}\rangle$ is the corresponding energy of the undamped wave field, which is given by
 $$\begin{eqnarray}\langle Er_{0}\rangle =\frac{\unicode[STIX]{x1D70C}_{w}}{2\unicode[STIX]{x1D706}_{0}}\int _{0}^{2\unicode[STIX]{x03C0}}\int _{r}^{r+\unicode[STIX]{x1D706}_{0}}\text{Re}\{\unicode[STIX]{x1D711}^{\ast }\unicode[STIX]{x1D711}_{z}\}|_{z=0}r\,\text{d}r\,\text{d}\unicode[STIX]{x1D713}.\end{eqnarray}$$
The numerical dissipation rate per unit radial length of the wave field is
 $$\begin{eqnarray}\langle Dr\rangle _{q}=-\frac{\text{d}\langle Er\rangle }{\text{d}t}=(2\unicode[STIX]{x1D708}_{q}\unicode[STIX]{x1D714}_{0})\langle Er_{0}\rangle [1+O(\unicode[STIX]{x1D708}_{q})].\end{eqnarray}$$
Since the viscous body boundary layer mainly influences the wave motion close to the waterline of the body, we add the effect of  $\langle D\rangle _{B}$ to
 $\unicode[STIX]{x1D708}_{q}$ in the near-body region
 $r_{1}\leqslant r\leqslant r_{1}+L_{e}$. In order for
 $\unicode[STIX]{x1D708}_{q}$ to be continuous over
 $r$ on the free surface,
 $\unicode[STIX]{x1D708}_{q}$ is assumed to vary linearly from the maximum value at
 $r=r_{1}$ to the far-field value at
 $r=r_{1}+L_{e}$. From the equivalent damping condition, we obtain
 $$\begin{eqnarray}\unicode[STIX]{x1D708}_{q}|_{r=r_{1}}=\frac{\langle D\rangle _{B}+\langle D\rangle _{F1}}{\langle Er_{0}\rangle \unicode[STIX]{x1D714}_{0}L_{e}},\end{eqnarray}$$
where  $\langle D\rangle _{F1}$ is given by the near-field integral in (D 4). In the present study, we choose to use
 $L_{e}/r_{1}=1$ in the computations. The value of
 $\unicode[STIX]{x1D708}_{q}$ in the waterline of the body is found to be
 $O(5\unicode[STIX]{x1D700}_{v})$. In the far field, by using
 $\unicode[STIX]{x1D711}\sim \text{e}^{k_{0}(\text{i}r+z)}/\sqrt{r}$, we obtain
 $$\begin{eqnarray}\unicode[STIX]{x1D708}_{q}|_{r\geqslant r_{1}+L_{e}}=\frac{|\unicode[STIX]{x1D711}_{r}|^{2}/\sqrt{2}}{k_{0}\text{Re}\{\unicode[STIX]{x1D711}^{\ast }\unicode[STIX]{x1D711}_{z}\}}\unicode[STIX]{x1D700}_{v}=\frac{\unicode[STIX]{x1D700}_{v}}{\sqrt{2}}\end{eqnarray}$$
for a fully contaminated water surface. We remark that the threshold value  $\unicode[STIX]{x1D700}_{c}$ is found to be insensitive to the value of
 $L_{e}$ used in the simulation. Our numerical tests show that
 $\unicode[STIX]{x1D700}_{c}$ varies within a few per cent for
 $L_{e}/r_{1}$ in the range of 0.5–2.0.



