


The legality of sex work is a contentious policy issue. Besides its legal status, an additional dimension of the debate relates to the location where sex work is practiced. Both in the modern context and historically, policymakers have tried to restrict sex work to parts of cities commonly known as red-light districts. Critics of red-light districts often suggest they lead to negative externalities by harming public health, increasing crime, and causing public nuisances. This precipitates lobbying for stricter regulation on districts and sex work more generally. For example, in recent years, city officials in Amsterdam have introduced proposals to relocate the city’s famous red-light district and limit tourism to the district.Footnote 1
It is often difficult to study the public health consequences of sex work since governments rarely change the legal status of prostitution. This paper examines a historical setting in which red-light districts were closed to assess their impact on public health. At the turn of the twentieth century, red-light districts were common in U.S. cities (Keire Reference Keire2010). In most cases, sex work was not decriminalized, but cities followed a policy of tolerance known by contemporaries as “segregated vice.” City officials hypothesized that “vice”—an umbrella term for sex work, gambling, and other socially stigmatized behaviors—could not be eradicated, and, therefore, attempted to geographically segregate it into particular areas of the city. Following the language used by contemporaries, throughout this paper, I will refer to these historical red-light districts as vice districts. Starting in the early 1900s, Progressive Era reformers began lobbying local leaders to remove vice districts. Besides generally disliking sex work as an occupational choice, these reformers argued that the districts made public health worse by transmitting diseases and fostering crime. By 1918, most districts across the United States had been closed. The staggered timing of vice district closures across cities provides a unique opportunity to study the effects of criminalizing sex work.
The first part of the analysis examines the characteristics of individuals residing in vice districts and how these characteristics changed after they were closed. It is often difficult to collect data on women in sex work, given the illicit nature of the industry. I digitize directories of sex workers published for tourists visiting vice districts, as well as the U.S. Census, to provide descriptive information on the characteristics of women engaged in sex work. This provides a quantitative analysis complementing the largely qualitative history literature exploring who enters sex work. Second, I examine the characteristics of other individuals residing in vice districts by using the Census waves before and after districts were closed. Individuals residing in vice districts were more likely to be non-white, which corroborates the historical literature suggesting local officials chose to locate vice districts in minority neighborhoods. After districts were closed, the share of women residing in the neighborhood declined by approximately 9 percentage points, which is consistent with police successfully forcing sex workers out of the vice district.
The second part assesses whether red-light districts have negative effects on public health. I digitize historical records of an anti-vice organization that kept track of when cities closed their districts. These records document the closure of 284 vice districts in the 1910s. I combine the timing of district closures with city-level mortality data from the Census Mortality Statistics that reports the number of deaths by cause annually. A natural question surrounding the criminalization of sex work is whether it impacts the transmission of sexually transmitted infections (STIs). Recent studies that examine changes in the legal status of sex work in the modern context focus on how this affects STI cases (Cameron, Seager, and Shah Reference Cameron, Seager and Shah2021; Cunningham and Shah Reference Cunningham and Shah2018). While data on STI transmission is not available in the historical context, some measures of mortality might be affected if STI rates change after district closures. For example, historically, congenital syphilis was a significant issue that could cause stillbirths as well as other birth defects that could lead to infant mortality (Brandt Reference Brandt1985; Goldin and Margo Reference Goldin and Margo1989; Fung and Robles Reference Fung and Robles2016). Combining the timing of when cities closed their districts with the city-level mortality data, I use a staggered difference-in-differences empirical strategy to assess how mortality changed after district closures.
I find that vice district closures led to an approximately 7 percent increase in deaths in early infancy. This was a category defined by the Census that was a subset of total infant mortality, comprised primarily of deaths from premature births and congenital defects. If STI transmission changed due to the closure of vice districts, we would expect infant mortality to change primarily through congenital syphilis, which could cause stillbirths and congenital defects (Wozniak et al. Reference Wozniak, Cantey, Zeray, Leos, Michelow, Sheffield, Wendel and Sánchez2023). Therefore, focusing on deaths in early infancy helps ensure that changes in mortality are actually being driven by changes in STIs instead of other important drivers of infant mortality during the period, such as digestive or respiratory diseases.
The finding that deaths in early infancy increase after vice district closures is consistent with an increase in STI transmission. In many instances, closing vice districts meant forcibly removing sex workers from their homes with very little notice. Contemporary observers and historians have found that when vice districts closed, sex workers often relocated to other parts of the city (Keire Reference Keire2010). This could lead to an increase in STI transmission if sex workers began interacting with new clients in their new locations. This mechanism is similar to the literature examining how changes in sexual partners can impact the transmission of HIV in the modern context (Kremer Reference Kremer1996). A second potential mechanism relates to restricted access to medical services for sex workers after vice districts were closed. Recent work examining Indonesia in the modern context has found that criminalizing sex work led to an increase in STI rates primarily through sex workers seeking less medical treatment (Cameron, Seager, and Shah Reference Cameron, Seager and Shah2021). Some cities experimented with mandatory medical inspections for sex workers and provided medical services to those with STIs. By closing red-light districts and effectively criminalizing prostitution, sex workers might have been reluctant to seek medical services, which could also increase transmission. This finding is also consistent with theoretical work suggesting that criminalizing sex work leads to worse public health outcomes relative to an unregulated counterfactual (Immordino and Russo Reference Immordino and Russo2015).
Modern critics of red-light districts—as well as the Progressive Era reformers lobbying against vice districts—also argue these districts increase crime. It is difficult to study effects on crime because systematic crime data at the city-level does not exist historically. However, the Census Mortality Statistics report deaths due to “external causes” that combine accidents, suicides, and homicides. Following Feigenbaum and Muller (Reference Feigenbaum and Muller2016), I use external deaths as a proxy to assess whether homicides changed after vice districts were closed. In contrast to the views of reformers, the results suggest there was no reduction in homicides after closures. Different specifications suggest an increase in external deaths ranging between 4–6 percent. Not all specifications are statistically significant, yet they rule out reductions in external deaths that are greater than 1 percent. While there are caveats to this analysis, given that we are using a proxy for homicides and that homicides are only one way in which crime can change, this analysis provides some evidence that vice districts did not increase crime.
The next part of the paper provides some suggestive evidence on how the districts affected the transmission of STIs. Systematic data on STI rates are not available for the period. However, I digitize records from the New Orleans Charity Hospital that report the number of hospital admissions by disease type. This data can provide information on how vice districts affect STI transmission that does not ultimately result in death. For this analysis, I study the opposite policy: the opening of the district after sex work was decriminalized in New Orleans. I compare hospital admissions from venereal diseases to other disease types likely unaffected by the presence of a red-light district before and after New Orleans opened its vice district in 1897. I find that hospital admissions related to venereal diseases declined relative to admissions from other diseases after the vice district was opened. While it is data for only one city, this provides suggestive evidence that vice districts did not lead to an increase in STI transmission.
This paper contributes to three main strands of literature. The first is the literature examining the public health consequences of sex work (e.g., Rao et al. Reference Rao, Gupta, Lokshin and Jana2003; Gertler, Shah, and Bertozzi Reference Gertler, Shah and Bertozzi2005; Gertler and Shah Reference Gertler and Shah2011). My findings are consistent with the theoretical work of Immordino and Russo (Reference Immordino and Russo2015), which studies the public health effects of different regulatory regimes, such as prohibition, taxation, and licensing, compared to a laissez-faire counterfactual in which sex work is decriminalized. They find that health risks are worse under prohibition. A small, recent empirical part of the literature has started to use policies that change the legal status of sex work to estimate causal effects on public health. Studies looking at policies decriminalizing sex work have found that sexual violence and STI rates decline significantly (Bisschop, Kastoryano, and van der Klaauw Reference Bisschop, Kastoryano and van der Klaauw2017; Cunningham and Shah Reference Cunningham and Shah2018; Gao and Petrova Reference Gao and Petrova2022). My paper is closest to studies that have examined the opposite policy of criminalizing sex work. These studies generally find criminalization makes public health worse by increasing STIs and sexual violence (Cameron, Seager, and Shah Reference Cameron, Seager and Shah2021; Gao and Petrova Reference Gao and Petrova2022). Relative to existing work, this paper shows that infant mortality can increase after red-light districts are closed in contexts with significant syphilis infection. It also adds to the literature by examining changes in neighborhood composition after criminalizing red-light districts. This builds on the existing literature studying red-light districts that primarily focus on changes in health and crime (e.g., Bisschop, Kastoryano, and van der Klaauw Reference Bisschop, Kastoryano and van der Klaauw2017).
Second, my paper contributes to the large literature in economic history examining Progressive Era public health policies (e.g., Cain and Rotella Reference Cain and Rotella2001; Cutler and Miller Reference Cutler and Miller2005; Ferrie and Troesken Reference Ferrie and Troesken2008; Beach et al. Reference Beach, Ferrie, Saavedra and Troesken2016; Hoehn-Velasco Reference Hoehn-Velasco2018; Alsan and Goldin Reference Alsan and Goldin2019; Anderson et al. 2019; Clay et al. Reference Clay, Egedesø, Hansen, Jensen and Calkins2020; Beach Reference Beach2022; Anderson, Charles, and Rees 2022; Hoehn-Velasco and Wrigley-Field Reference Hoehn-Velasco and Wrigley-Field2022; Anderson et al. Reference Anderson, Charles, McKelligott and Rees2022). In the early 1900s, cities experimented with a host of policies aimed at improving public health. Cities implemented sewage treatment systems, water chlorination and filtration, milk quality standards, and local departments of health. Papers studying these interventions generally find that they decreased or had no effect on infant mortality and other types of contagious disease mortality. This paper finds that Progressive Era lobbying for the removal of red-light districts had negative consequences for public health.
Lastly, my paper contributes to the literature in economic history studying female employment. In recent decades, there has been extensive work examining patterns in female labor force participation, gender wage gaps, and differences in occupational sorting by gender over time (Goldin Reference Goldin1980, Reference Goldin1990, Reference Goldin2006; Horrell and Humphries Reference Horrell and Humphries1995; Burnette Reference Burnette1997, Reference Burnette2008; Costa Reference Costa2000; Humphries and Weisdorf Reference Humphries and Weisdorf2015). However, even though sex work has been an important industry that women have turned to throughout history, there is little work in economic history studying it. Recent work has examined other historical attempts to regulate sex work as well as the factors that drove women into the industry (Goehring and Hanlon 2024; Goehring Reference Goehring2025). Work by Brodeur, Lekfuangfu, and Zylberberg (Reference Brodeur, Lekfuangfu and Zylberberg2018) relates the origins of the sex work industry in Thailand to the U.S. presence during the Vietnam War. I contribute to this literature by examining attempts to regulate the industry in the historical U.S. context. By analyzing sex worker characteristics using Census data, I also contribute to the large, mainly qualitative, history literature on sex work in the United States (e.g., Rosen Reference Rosen1982; Brandt Reference Brandt1985; Gilfoyle Reference Gilfoyle1994; Keire Reference Keire2010).
The rest of the paper proceeds as follows. The next part provides additional historical background. I then analyze the characteristics of sex workers as well as other individuals residing in vice districts. The next two parts analyze the public health effects of closing the vice districts by examining changes in mortality and hospital admissions. The last two parts discuss potential mechanisms for the public health results and conclude.
HISTORICAL CONTEXT
This section provides historical background on the setting of the paper. The first part discusses how vice districts became a popular tool among city leaders, as well as their subsequent closure. The second part briefly summarizes the medical history of syphilis in the United States.
The Creation and Removal of Vice Districts
As cities became denser during industrialization in the late nineteenth century, officials began implementing policies such as water treatment and sewerage to improve public health (Alsan and Goldin Reference Alsan and Goldin2019; Cutler and Miller Reference Cutler and Miller2005). Many of these city leaders were also concerned with prostitution taking place in residential neighborhoods in urban areas. Local officials began adopting a policy known as segregated vice, where sex workers, as well as socially stigmatized establishments such as LGBT bars and bath houses, were confined to particular areas within a city (Chauncey Reference Chauncey1994). The rules adopted by local leaders to regulate vice districts varied across cities.Footnote 2 For example, some cities like New Orleans went as far as explicitly decriminalizing indoor prostitution within the district (Rose Reference Rose1974). However, most cities preferred the less radical approach of tolerating sex work within the district and cracking down harshly on prostitution outside its boundaries. Some cities required sex workers to be regularly tested for STIs. Others created registries listing the sex workers at particular brothels and charged licensing fees. Despite these differences in implementation, vice districts became a common tool leaders used to ensure prostitution was not scattered throughout the expanding U.S. cities of the late nineteenth century. Many of these leaders believed “vice” could not be fully eradicated, and considered segregating it to one area of a city as the best feasible alternative.Footnote 3
Maintaining vice districts remained a popular policy among city officials until the first two decades of the twentieth century when various groups of Progressive Era reformers began arguing against segregated vice. These reformers argued to city officials that tolerating sex work was condoning illegal activity and wanted vice districts to be eliminated. Besides generally disliking the lifestyle choices of sex workers, reformers argued vice districts should be removed for concerns related to public health and crime. They argued vice districts made it less costly to acquire sex work, which led to greater transmission of STIs and other diseases. Furthermore, they argued vice districts fostered criminal activity by giving unsavory groups that committed crimes a place to congregate. The American Social Hygiene Association (ASHA) was one such organization arguing for the end of segregated vice districts. Figure 1 displays an excerpt from an ASHA report published in 1920 that illustrates the reformist stance. In the first column, the report lists common contemporary arguments in favor of segregated vice, and in the second column, it provides rebuttals. The first argument suggests that crime is lower when prostitution is contained in a vice district because police can effectively monitor a known location where crime is likely. The ASHA report responds that vice districts “increase crime by fostering viciousness and disease, providing a meeting-place for the idle and vicious.” Similar arguments are made, suggesting that vice districts increase STI cases. The empirical section of this paper aims to test these arguments.
EXAMPLE OF PROGRESSIVE ERA REFORMERS’ ARGUMENTS AGAINST VICE DISTRICTS
Notes: This figure displays an excerpt from a report published by the American Social Hygiene Association (ASHA) in 1920 titled “Social Hygiene Legislation Manual,” 1920, p. 43. The ASHA was a prominent anti-vice organization that advocated for the removal of vice districts. The report describes contemporary arguments “for” segregated vice districts and then responses by the ASHA regarding why segregated vice was, in fact, detrimental. Some of the reasons pertain to crime, health, and moral considerations.
Source: Report published by the ASHA titled “Social Hygiene Legislation Manual,” 1920, p. 43.

By 1920, most vice districts in the United States had been closed, primarily for two main reasons. First, reformers successfully lobbied local governments to remove districts. Second, districts that managed to survive this lobbying were closed by the U.S. military during WWI. In the period before the closure of districts by the U.S. military, reformers followed a standard strategy to get city leaders to close their districts. The process would start with local reformers organizing committees to study the state of vice in their cities. These committees would generally be composed of prominent leaders from local businesses, churches, and other social organizations. In many instances, the committees would receive guidance from the ASHA or other national anti-vice organizations lobbying for the removal of vice districts. Committee members would investigate activity in the vice district and often conduct surveys of sex workers and brothel owners. After their investigations, they would issue a public report detailing the prevalence of prostitution and other vices, which they would use to pressure local leaders to close the district. Oftentimes, city officials were portrayed by vice commissions as implicitly tolerating or benefiting from illegal activity by receiving bribes from brothel owners. Facing public criticism, many mayors and police departments would respond by closing their vice districts (Keire Reference Keire2010, pp. 89–95).
Most vice districts that managed to stay open during the period of reform lobbying were subsequently closed by the U.S. Army during WWI. As part of the war effort, soldiers were stationed in camps located in U.S. cities. Military leaders soon realized that vice districts were a common attraction of Army recruits, and worried that soldiers frequenting brothels would contract STIs. Congress responded by passing legislation giving the Secretary of War broad powers to close vice districts in the vicinity of Army camps (Keire Reference Keire2010, pp. 105–07). This led to the closure of over 130 vice districts between 1917–18 (see Online Appendix Figure C2a). By the end of the decade, most segregated vice districts in U.S. cities were eliminated.
Closing vice districts had significant costs for sex workers. It often meant the police forcibly removing sex workers from their homes and shutting down brothels. As we will see later, closures led to large reductions in the number of women in surrounding neighborhoods, likely reflecting sex workers relocating after being forced to move. In most cases, little support was provided to sex workers displaced by district closures (Rosen Reference Rosen1982, p. 32). A common argument made by supporters of vice districts was that many sex workers had few other options, and closing the district would only make their lives more difficult. Many reformers advocating removal dismissed these arguments. For instance, when discussing this issue, the Louisville, Kentucky vice commission report suggested, “Why should a community hesitate or consider as to what will become of a few women when the greater question, of the moral and physical health of the larger body of the community and of the children that are yet to be born, is the problem that actually confronts us?”Footnote 4 Reformers argued that the externalities to public health associated with vice districts outweighed the costs borne by sex workers who were dislocated.
Medical History of Syphilis in the United States
Many of the reformers advocating for the removal of vice districts wanted to suppress prostitution as a means to curtail syphilis, which was a significant public health problem during the period. This section presents a brief overview of the consequences of syphilis as well as a summary of the existing medical knowledge and available treatments for the disease in the early twentieth century.
Untreated syphilis in adults can lead to death, yet it generally takes years or decades as it slowly causes other complications (Alsan and Wanamaker Reference Alsan and Wanamaker2018). The health consequences are much more acute for infants and unborn children who contract the disease from their mothers. Congenital syphilis can lead to stillbirths, low birth weight, and other birth defects that result in infant mortality. Even today, congenital syphilis is a significant cause of infant mortality in the developing world, where syphilis testing during pregnancy is sometimes scarce. Studies have found that the transmission rate from mother to fetus can be as high as 70 percent and that pregnancies where the mother remains untreated can result in stillbirth or infant death 31 percent of the time (Fung and Robles Reference Fung and Robles2016; Wozniak et al. Reference Wozniak, Cantey, Zeray, Leos, Michelow, Sheffield, Wendel and Sánchez2023).
Medical understanding of syphilis changed dramatically in the first decade of the twentieth century.Footnote 5 In 1905, German researchers identified the bacteria that cause syphilis. A year later, the Wassermann test was invented, which became the most common way to identify syphilis infection. In 1909, an arsenic-based treatment known as Salvarsan became the first effective treatment for the disease. However, the drug was toxic and led to complications for early patients. A safer version of the drug was invented in 1912. However, use of this drug was hampered by the fact that patients needed repeated intravenous doses. Many patients would not complete the full sequence of doses necessary to cure the syphilis. Treatment became substantially easier and more effective in the 1940s with the invention of penicillin.
Syphilis was a significant public health issue in the United States in the early twentieth century (Brandt Reference Brandt1985; Goldin and Margo Reference Goldin and Margo1989). The negative effects of syphilis, especially for infants, were discussed in local health reports. For instance, in 1915, the Massachusetts State Department of Health wrote, “the incidence of congenital syphilis with its high infant mortality and a large number of premature births due to syphilis are preventable if physicians or institutions in charge of pregnant women would have the Wassermann test made on every woman during the first months of pregnancy.”Footnote 6 Available data for the period suggest infants were much more likely to die of syphilis relative to older people. Online Appendix Figure C3 shows the age distribution of all syphilis deaths reported to the Census from 1910 to 1917. Approximately 40 percent of syphilis deaths during the period were infants under one year of age. This helps motivate the study of effects on infant mortality in the empirical section. While health officials understood syphilis was a significant issue, governments were just starting to address it in the 1910s. For instance, states had only recently begun mandating that physicians report syphilis cases to health agencies in a manner similar to that of other contagious diseases. There was also stigma associated with seeking treatment or testing for syphilis, which hampered progress toward eradicating it (Brandt Reference Brandt1985). After the period of this study, states began taking a more proactive role in addressing congenital syphilis. In the 1930s, states began adopting mandatory antenatal testing of pregnant mothers for syphilis, and some states also required couples to be tested for syphilis before marriage (Fung and Robles Reference Fung and Robles2016).
CHARACTERIZING VICE DISTRICTS
Before turning to the public health consequences of district closures, this section aims to present a descriptive analysis characterizing vice districts. First, it uses historical sources and the U.S. Census microdata to provide information on the sex workers in vice districts. The second part examines the characteristics of the neighborhoods where districts were located and assesses how they changed in response to closures.
Sex Worker Characteristics
Collecting information on sex workers is difficult, especially in contexts where the industry is illegal. This makes it difficult to estimate the number of women working in vice districts or to examine their characteristics. Many of the vice commissions attempted to survey sex workers in the district. However, the reliability of their data is questionable, given that reformers likely had incentives to overstate the size of districts to support their cause for closure. Furthermore, sex workers may have been hesitant to talk to investigators given their intentions. Potentially more accurate data come from newspaper articles discussing district closures, which gave estimates of the number of sex workers forced to relocate. These articles suggest vice districts were quite large, containing hundreds of sex workers. For example, articles in Peoria, Kansas City, and Detroit—three medium-sized cities with populations ranging from 100,000 to 400,000 in 1910—state that 200, 400, and 500 women were removed from the respective districts.Footnote 7
To obtain more information on the women working in the vice districts, I try to identify sex workers in the 1910 Census, which is the last decadal census before the wave of closures in the 1910s.Footnote 8 This section will present characteristics of the women in three cities—Chicago, New Orleans, and San Antonio—where other historical primary sources and idiosyncrasies in the Census enumeration allow me to credibly identify sex workers.
Tracking sex workers using the Censuses is often infeasible because enumerators rarely provide accurate occupational status information for sex workers. However, I have identified that in the 1910 Census, the enumerator for the Chicago vice district recorded sex workers and brothel owners using distinct and informative occupations. Specifically, sex workers were enumerated as “inmates,” and brothel owners were referred to as “resort keepers,” which were common terms used during the period. Online Appendix A.2 provides more detail on how sex workers were identified in the 1910 Census.
Unlike Chicago, the 1910 Census does not provide informative occupation data for the vice districts in New Orleans and San Antonio. However, it is possible to obtain information on sex workers because these cities created directories known as Blue Books that listed sex workers and brothels in the district. The practice of publishing sex worker directories started in Storyville—the name of the district in New Orleans—as a means to advertise to potential clients and tourists visiting the area. The Blue Books were advertised as a way to solve information asymmetries between businesses in the vice district and tourists who had little knowledge of Storyville. The directory listed supposedly reputable brothels where clients could feel safe and know they would not be scammed or tricked. San Antonio followed the example of New Orleans and began publishing its own Blue Book for its vice district. Overall, publishing directories listing the women working in the vice districts was rare. I could only find examples for these two cities. The fact that sex work was decriminalized in New Orleans probably made publishing the directories less risky since women would not face retaliation from police if they restricted their work within the district.
I digitize editions of the Blue Books from New Orleans and San Antonio that list individual sex workers and brothels, as well as the addresses where they were located. Online Appendix Figure A1 panel (b) shows an example from the New Orleans directory that contains the entry for Lulu White—a prominent black brothel keeper in Storyville—who owned a brothel at 235 N. Basin Street.Footnote 9 To obtain more information on the women working in the districts, I match the listed brothel addresses in the Blue Books to households in the 1910 Census. This yields a set of likely women sex workers since they resided at known brothels. I chose to link addresses to the Census instead of individual names for two main reasons. First, many women reported nicknames in the directories that do not correspond to their real names, which may cause inconsistencies between the directory and the Census. Furthermore, there are many cases of Census enumeration errors that make linking names difficult. For example, the brothel owner “Hilma Burt” in New Orleans was transcribed as “Helmer Burt” in the Census. Matching addresses of brothels found in the directories to the Census does not suffer from these issues. Online Appendix A.2 provides more detail on identifying sex workers in the 1910 Census for New Orleans and San Antonio using this process.
Table 1 displays summary statistics of the sex workers identified in the 1910 Census. A defining characteristic of the industrial organization of prostitution during this period was the distinct brothel, or “house of ill fame,” where a madam oversaw multiple sex workers (Rosen Reference Rosen1982). In the Chicago district, the average brothel had 7 sex workers, yet there was significant variation in brothel size. For example, the largest brothel in the district, owned by the Everleigh Sisters, two nationally famous brothel owners, had 27 women residing at the location in the Census. In contrast, New Orleans and San Antonio had approximately three reported women per brothel (address), significantly fewer than Chicago. The average age of sex workers varied between 25 and 28 in the three districts. This is quite similar to the age found in a variety of studies surveying sex workers in the modern context (e.g., Gertler and Shah Reference Gertler and Shah2011; Li, Lang, and Leong Reference Li, Lang and Leong2018). The Chicago sample, where it is possible to distinguish between brothel owners and sex workers, indicates that madams were five years older on average than sex workers.
CHARACTERISTICS OF SEX WORKERS IN SELECT VICE DISTRICTS IN THE 1910 CENSUS

Table 1 Long description
A table comparing characteristics of sex workers in three vice districts in the 1910 Census. The table has 10 rows and 5 columns. The columns are labeled Chicago, New Orleans, and San Antonio. The rows are labeled Age (total), Age (sex workers), Age (brothel keepers), White, Literate, U.S. born, Born in-state, Sex workers per address, and Observations. Row 1: Age (total), 25.920, 28.781, 25.318. Row 2: Age (sex workers), 25.049, 28.781, 25.318. Row 3: Age (brothel keepers), 30.712, 28.781, 25.318. Row 4: White, 0.958, 0.633, 0.974. Row 5: Literate, 1, 0.880, 0.831. Row 6: U.S. born, 0.802, 0.852, 0.786. Row 7: Born in-state, 0.252, 0.350, 0.351. Row 8: Sex workers per address, 7.120, 2.246, 3.500. Row 9: Observations, 591, 283, 154.
Notes: This table displays descriptive statistics from the 1910 Census for the sample of sex workers in the Chicago, New Orleans, and San Antonio vice districts. Online Appendix A.2 provides details on how sex workers were identified in the Census. Age (total) reports the average age of all identified sex workers. For Chicago, it is feasible to distinguish between sex workers and brothel owners. The other rows report the share of the total sex workers who are white, literate, U.S. born, and born in-state.
Sources: 1910 U.S. Census; New Orlean’s Blue Book; The Blue Book for Visitors, Tourists, and Those Seeking a Good Time while in San Antonio, Texas.
Furthermore, literacy rates range from 81 percent in San Antonio to 100 percent in Chicago; however, the fact that the Census enumerator reported all sex workers as literate in Chicago is likely an enumeration error. Literacy is broadly similar to a survey of sex workers in modern Singapore, which found that 79 percent were literate (Li, Lang, and Leong Reference Li, Lang and Leong2018). Across the three cities, approximately 80 percent of sex workers were born in the United States. The fact that the majority of sex workers were native born contradicts the fears of many Progressive Era reformers who worried that migrant women were coming to the United States and engaging in sex work. Lastly, the racial composition of sex workers varied significantly across the districts and largely represents racial differences in the underlying population of the city. For example, 96 percent of sex workers were white in Chicago’s vice district, whereas only 63 percent were white in New Orleans.Footnote 10
Overall, these results provide quantitative data on the characteristics of sex workers that complements the qualitative history literature on sex work in the early twentieth-century United States (Rosen Reference Rosen1982; Gilfoyle Reference Gilfoyle1994; Keire Reference Keire2010). The data also suggest vice districts were large, often containing hundreds of sex workers. Given the size of districts, it is reasonable that changes in how sex work was regulated may have had broader effects on public health.
Neighborhood Characteristics
While the previous section focused specifically on sex workers, this section examines the neighborhood characteristics of vice districts and how they changed after districts were closed. As discussed earlier, reformers argued that vice districts should be closed because they harmed public health. While many of these arguments concerned disease transmission, others related to the fact that vice districts fostered crime (see Figure 1). The arguments of these reformers are similar to the mid-century slum clearance movement that sought to revitalize American cities by displacing individuals and rebuilding poorer neighborhoods (Collins and Shester Reference Collins and Shester2013; LaVoice Reference LaVoice2024). The literature studying the creation of red-light districts has not examined how the characteristics of neighborhoods change when sex work is tolerated (Bisschop, Kastoryano, and van der Klaauw Reference Bisschop, Kastoryano and van der Klaauw2017). The removal of vice districts and the detailed U.S. census data provide an opportunity to examine this question.
Conducting this analysis requires data on neighborhood characteristics over time, as well as information on where vice districts were located within cities. I use the individual-level decadal census data from 1900 to 1930 to measure demographic and socioeconomic outcomes. To identify where vice districts were located, I consult primary sources and work by historians. The boundaries of some districts are easily identifiable. For example, the boundaries of Storyville in New Orleans were defined by legal statute. However, most cities did not formally create vice districts, which makes identifying the boundaries more difficult. The following analysis will be restricted to five cities—Chicago, New Orleans, Philadelphia, Denver, and San Antonio—where the boundaries can be determined from credible sources such as vice commission reports, other contemporary sources, or work by historians. Online Appendix A.1 provides additional details on the locations of the vice districts in these cities and the sources used to identify them.
A final important step is to identify whether individuals in a particular city resided in the location of the historical vice district. To do this, I match the boundaries of the vice districts to census enumeration districts.Footnote 11 Given that the boundaries of enumeration districts can change each decade, I identify the enumeration districts overlapping with the vice district boundaries for each Census year from 1900 to 1930.
To assess how closing vice districts affected neighborhood composition, I estimate the following equation where the sample contains all individuals in the five selected cities for the census years 1900 to 1930:

where y idt is an outcome for individual i in enumeration district d in census year t; Vice d is an indicator for whether the individual resides in an enumeration district containing the historical vice district; Post t is an indicator equal to one for census years after the closure of vice districts (i.e., 1920 and 1930); and α t and α c are census year and city fixed effects, respectively. The city fixed effects ensure that we are comparing the characteristics of individuals in the location of the historical vice district to those in other areas of the same city. β 1 and β 2 are the variables of interest. β 1 captures differences in the characteristics of individuals living in vice districts relative to other areas of the city. β 2 captures any potential changes in these characteristics after the closure of the vice district. It is worth noting that since enumeration district boundaries change each decade, this specification is not a conventional difference-in-differences specification containing enumeration district fixed effects. Instead, the specification uses repeated cross-sections comparing individuals in enumeration districts where the vice district was located to other areas of the city over time.
Table 2 presents the main results for several different individual-level characteristics.Footnote 12 The first row of coefficients captures any differences in the individuals living in the historical vice district relative to other parts of cities. Columns (1) to (3) suggest vice districts had slightly fewer women, were significantly more likely to contain minority individuals, and less likely to contain children. The fact that vice districts contained more minorities confirms observations made by historians. For example, Mara Keire writes “In the years preceding the abolition of the districts, however, municipal officials unequivocally responded by situating districts in the poorest neighborhoods, inhabited by ghettoized and racialized populations” (Keire Reference Keire2010, p. 52). Column (4) shows that vice districts were not more likely to contain immigrants relative to other parts of cities, in contrast to the views of many contemporaries during the time who argued immigrants comprised a large share of both the supply and demand for sex work. Lastly, Column (5) suggests individuals in vice districts were slightly less likely to be considered literate by Census enumerators, although the coefficient is only statistically significant at the 10 percent level.
THE EFFECT OF CLOSING VICE DISTRICTS ON NEIGHBORHOOD CHARACTERISTICS

Table 2 Long description
A table with five columns and six rows, including a header row. The columns are labeled ‘Dependent Variable’, ‘Female’, ‘White’, ‘Child’, ‘U.S. Born’, and ‘Literate’. The rows include data for ‘Vice_a’ and ‘Vice_a x Post_t’, along with ‘Dep. var. mean’, ‘Observations’, and ‘R-squared’. The table presents coefficients and standard errors for different individual-level characteristics. For ‘Vice_a’, the coefficients are -0.039 for Female, -0.131 for White, -0.134 for Child, -0.001 for U.S. Born, and -0.027 for Literate. For ‘Vice_a x Post_t’, the coefficients are -0.094 for Female, -0.050 for White, 0.022 for Child, -0.089 for U.S. Born, and -0.018 for Literate. The ‘Dep. var. mean’ values are 0.499 for Female, 0.927 for White, 0.32 for Child, 0.75 for U.S. Born, and 0.948 for Literate. The ‘Observations’ values are 19,487,488 for Female, White, Child, and U.S. Born, and 13,253,777 for Literate. The ‘R-squared’ values are 0.001 for Female, 0.060 for White, 0.003 for Child, 0.031 for U.S. Born, and 0.007 for Literate.
Notes: This table presents the results of estimating Equation (1) for each of the Census characteristics. The unit of observation in all regressions is an individual. The sample combines all individuals in Chicago, New Orleans, Philadelphia, Denver, and San Antonio from 1900 to 1930. The outcome in Column (1) is an indicator of whether the individual is female. In Column (2), it is an indicator of whether the individual is white. In Column (3), it is an indicator of whether the individual is under age eighteen. In Column (4), it is an indicator of whether the individual was born in the United States. In Column (5), it is an indicator of whether the person was reported as literate by the Census enumerator. In Column (5) the sample is restricted to adults. Standard errors are clustered at the enumeration district-by-year level. *p<0.1; **p<0.05; ***p<0.01.
Sources: 1900 to 1930 U.S. Censuses. See text for details.
The second row of coefficients assesses whether the characteristics of individuals living in the area where the vice district was located changed after the wave of closures in the 1910s. None of the coefficients are statistically significant except for the specification in Column (1), which implies that individuals in the historical vice district were much less likely to be women after closure. This finding is notable for two reasons. First, it verifies that closing vice districts successfully forced sex workers out of the area. Second, the fact that women left the vice district can potentially explain the public health effects studied later in the paper. If sex workers had a high probability of being infected with STIs, closing the vice district could have precipitated the transmission of STIs throughout the city as sex workers relocated elsewhere. I will return to this fact when discussing potential mechanisms of the public health results. Overall, aside from the reduction in women, there are no other significant changes in the characteristics of individuals living in vice districts. This suggests little evidence of neighborhood revitalization or gentrification following district closures, in contrast to the mid-century slum clearance efforts (Collins and Shester Reference Collins and Shester2013; LaVoice Reference LaVoice2024).
VICE DISTRICT CLOSURES & MORTALITY
This section presents the main results on how vice district closures affect infant mortality and external deaths, a proxy for homicides. The first part discusses the data. The second part describes the empirical strategy and presents summary statistics. The third part presents the main public health results. The last part provides a series of robustness checks.
Data
TIMING OF VICE DISTRICT CLOSURES
To study the effects of removing red-light districts, it is necessary to collect information on when districts were closed. As discussed in the historical context section, most vice districts were closed by 1918 either through lobbying efforts by reformers or by the U.S. military to deter soldiers from interacting with sex workers during WWI. To identify the timing of closures, I digitize records from the American Social Hygiene Association detailing the year a district was closed. The ASHA was a prominent reform organization lobbying for the end of segregated vice districts, and it published various reports on the topic to communicate with supporters and convince policymakers. Online Appendix Figure C1 displays contents from a pamphlet it published in 1919 titled Standard Statistics of Prostitution, Gonorrhoea, Syphilis, documenting the year cities closed their vice districts. I digitize this list and use it to define treatment status in the empirical sections.
The pamphlet reports 284 cities that closed their vice districts between 1906 and 1919. Online Appendix Figure C2a displays the timing of these closures. Nearly 90 cities closed districts between 1906 and 1916 during the period in which closures were mainly driven by reformist lobbying efforts. In 1917, there was a large increase in the number of closures precipitated by the intervention of the U.S. military in shutting down districts during WWI. In 1917 and 1918, over 130 vice districts were closed.
Figure 2 displays the cities where vice districts were closed between 1906 and 1919. There were many closures in the south and southwestern parts of the United States. For example, Texas had 44 reported closures in the ASHA pamphlet. Establishing vice districts was a common policy among cities in Texas, and many of them developed systems where sex workers underwent medical inspections to ensure they did not have STIs (Humphrey Reference Humphrey1995). However, the map demonstrates that vice districts were common across most of the United States. Forty-four states contain cities with at least one closure, and almost all large cities in the United States had a district that was closed during the period.
LOCATION AND TIMING OF VICE DISTRICT CLOSURES
Source: This figure displays the cities with vice district closures reported in the American Social Hygiene Association pamphlet titled “Standard Statistics of Prostitution, Gonorrhoea, Syphilis,” published in 1919 (see Online Appendix Figure C1).

MORTALITY STATISTICS
To assess whether closing vice districts had implications for public health, the main outcome I will focus on is city-level mortality. To study the health effects of closing districts, the ideal data might be STI transmission rates within a city. However, detailed city-level data of this sort does not exist historically. An attractive feature of focusing on mortality is that, starting in the early twentieth century, the Census Bureau began aggregating this data annually for a set of causes of death for a large number of U.S. cities. I will use the mortality data from the Census Bureau from 1900–1930, which encompasses the period when vice districts were closed.Footnote 13 The number of cities reported in the mortality data increases over time. To ensure the results are not being driven by changing composition over time, the main analysis considers the balanced panel of cities that reported data yearly from 1900–1930.
The empirical analysis will focus on two main categories of death that can assess the public health and crime consequences of closing red-light districts. The main health outcome is deaths in early infancy. This is a category included in the Census Mortality Statistics that is a subset of total infant deaths. Online Appendix A.3 provides additional details on the causes of death that comprise deaths in early infancy, as well as how much this category accounts for total infant deaths. Online Appendix Figure A4 shows that approximately 75 percent of deaths in early infancy are related to premature births and congenital defects. This makes deaths in early infancy a particularly useful set of deaths for my analysis because the primary way in which changes in STI transmission leads to mortality is through congenital syphilis. When syphilis is passed in-utero from mother to fetus, this can cause premature birth, stillbirth, and congenital defects (Wozniak et al. Reference Wozniak, Cantey, Zeray, Leos, Michelow, Sheffield, Wendel and Sánchez2023). Online Appendix Table A1 shows that deaths in early infancy make up approximately a fifth of total infant deaths. The main drivers of infant mortality, such as digestive and respiratory diseases, are excluded from deaths in early infancy, which helps ensure that the results are not driven by other shocks or policies that influence infant mortality more broadly.Footnote 14
The main proxy for crime is reported external deaths, a category used by the Census that combines deaths from accidents, suicides, and homicides. Given that external deaths combine several different causes, it is a noisy measure of total homicides. However, given the lack of separately reported homicide data before 1921, as well as a general lack of data on other types of violent crime, it has been used as a proxy in other work (Feigenbaum and Muller Reference Feigenbaum and Muller2016). With these caveats in mind, if closing vice districts reduced crime, as many Progressive Era reformers believed, we may expect external deaths to decrease as homicides decline. Lastly, it is unlikely that closing vice districts would affect the other categories (accidents and suicides), implying changes in external deaths are likely due to homicides.
To calculate mortality rates, I combine the annual mortality statistics with population data from the censuses for 1900, 1910, 1920, and 1930. For cities that are too small to be categorized separately in the census, I use the Census Place Project (CPP) to obtain the city’s population (Berkes, Karger, and Nencka Reference Berkes, Karger and Nencka2023). The main advantage of this data is that it geolocates households in the Census, which allows population to be calculated for smaller towns and cities. Annual city-level population is linearly interpolated between census-year observations.
Empirical Strategy
To assess whether vice districts affected public health, I use an event study design that combines the timing of district closures with city-level mortality statistics. Specifically, I estimate the following equation:

where rate ct is total deaths per 100,000 people in city c in year t. There are a few cities with zero deaths for a specific cause in a given year, so we add one before calculating the log rate; 1{s = t – Y c } is an indicator equal to one for city c in the s’th year relative to the vice district closure in year Y c , and zero otherwise. The estimated values of β s are the variables of interest, and estimates prior to closure will allow us to assess pretrends; α c and α t are city and year fixed effects, and some regressions will contain a vector of city-level time-varying controls X′ ct . Standard errors are clustered at the city-level.
A recent literature has identified issues with using the common two-way fixed effects approach when treatment timing is staggered, and treatment effects are heterogeneous across groups (Baker, Larcker, and Wang Reference Baker, Larcker and Wang2022). Because of these issues, I will use the estimation strategy in Callaway and Sant’Anna (2021).
As discussed in the previous section, I restrict to the balanced panel of cities which are reported in the Census Mortality Statistics from 1900 to 1930. Online Appendix Figure C2b shows the timing of treatment for cities in the mortality data. The pattern of treatment timing in this sample is broadly consistent with the overall sample of closures in the ASHA pamphlet reported in Online Appendix Figure C2a. In the ASHA pamphlet (Online Appendix Figure C1), there are cities that closed vice districts, but a specific year of closure is not reported. I manually search newspapers.com, an online historical newspaper database, to identify the year of closure for these cities. There are six remaining cities in the panel of mortality data identified as treated in the ASHA pamphlet for which a year of closure cannot be identified through newspaper searches. Since these cities were presumably treated sometime during the period, I remove them from the sample, resulting in a balanced panel of 266 cities from 1900 to 1930 (Goehring 2026).
Another potential concern is that the ASHA pamphlet is not comprehensive and has missed potential district closures. However, this would likely attenuate our results if treated cities are incorrectly labeled as control since they are not included on the ASHA list.
Online Appendix Table A2 presents summary statistics for the main data used in the analysis for the full sample and separately by treatment status. Treated and never-treated cities are broadly similar across death rates from different causes. However, treated cities are much larger than never-treated cities, which is consistent with the fact that creating vice districts was a policy tool to address problems associated with urbanization. In the Callaway and Sant’Anna (2021) estimation framework, the researcher can specify the “not yet treated,” which combine never treated units and those that have not yet been treated, or only “never-treated” units as the control group. Given the observed differences in city size between cities with vice district closures and those without, I will include the not-yet-treated cities in the control group. However, results are robust to restricting to only never-treated cities instead.Footnote 15 Overall, the identifying assumption is one of parallel trends: that mortality in control cities would trend similarly to treated cities in the absence of vice district closures.
Results
Figure 3 shows the estimated effects over time of vice district closures on deaths in early infancy. I estimate Equation (2) for ten years before and after closure since all treated cities have at least ten years of post-treatment data. This ensures that changes in the effects are not being driven by changes in the composition of treated units over time. In the years prior to closure, the estimated differences between treatment and control cities are close to zero, suggesting the parallel trends assumption is not violated. After vice districts are closed, the estimated effects become positive. Table 3 shows the average treatment effect using the procedure in Callaway and Sant’Anna (2021), which constructs a weighted average of the dynamic treatment effects. The first column (which corresponds to Figure 3) implies the early infancy death rate increased by approximately 7 percent after districts were closed.
EVENT STUDY FIGURE FOR EARLY INFANCY MORTALITY
Notes: This figure shows the estimated effects over time of vice district closures on the log early infancy mortality rate, defined as total deaths in early infancy per 100,000 people. The event study corresponds to the baseline regression in which Equation (2) is estimated using Callaway and Sant’Anna (2021) with no controls (the average effect is reported in Column (1) of Table 3).
Sources: Census Mortality Statistics. See text for details.

THE EFFECT OF CLOSING VICE DISTRICTS ON DEATHS IN EARLY INFANCY

Table 3 Long description
A table showing the effect of closing vice districts on deaths in early infancy. The table has four columns and four rows. Column headers are labeled as (1), (2), (3), and (4). Row labels are ATT, Dep. var. mean, Observations, and Sample. Row 1: ATT, 0.069**, 0.071**, 0.078*, 0.103**. Row 2: Dep. var. mean, 4.419, 4.419, 4.409, 4.439. Row 3: Observations, 8,246, 8,246, 7,254, 6,851. Row 4: Sample, Full, Full, Exclude WW1, Large cities. The table presents the estimated effects over time of vice district closures on deaths in early infancy, with different columns representing different conditions or subsets of data.
Notes: This table presents the estimates for the effect of vice district closures on the log early infancy mortality rate, defined as total deaths in early infancy per 100,000 people. The ATT column provides the average of the dynamic treatment effects using the procedure in Callaway and Sant’Anna (2021). Column (1) presents the results for the full sample of cities from 1900–1930 with no controls. Column (2) presents the results for the full sample and controls for the influenza mortality rate. Column (3) excludes from the analysis cities that are treated in 1917 or 1918. Column (4) excludes from the analysis cities that have a population of less than 100,000 in 1910. All regressions contain city fixed effects, year fixed effects, and control for the influenza mortality rate unless stated otherwise. Standard errors are clustered at the city-level. *p<0.1; **p<0.05; ***p<0.01.
Sources: Census Mortality Statistics. See text for details.
Column (2) of Table 3 shows the effect when controlling for the influenza death rate. The vice district closures late in our sample coincide with the 1918 Influenza Pandemic. So one potential concern is whether vice district closures occur in cities that experienced relatively worse flu outbreaks during the pandemic. Online Appendix Table B8 Column (5) provides evidence that this is indeed the case. It estimates Equation (2) where the outcome is the influenza death rate. Cities with vice district closures experienced more influenza-related deaths afterward. It is unlikely that influenza deaths are driving the result because early infancy deaths mostly comprise deaths from premature birth and congenital defects, which are two causes unlikely to be affected by influenza. Regardless, when controlling for the influenza death rate, the effect of closures on early infancy deaths is similar and slightly larger.
A separate concern related to the vice district closures that occur late in our sample is that they also coincide with WWI. The closures in 1917 and 1918 were primarily carried out by military leaders to ensure Army recruits stationed in cities would not frequent vice districts. Thus, there may be channels through which having a large number of troops stationed in a city could affect infant mortality and public health more broadly. Column (3) of Table 3 addresses this concern by dropping from the sample cities with closures that occur in 1917 and 1918, and estimating Equation (2) only using closures prior to the war. The effect is similar to using the full sample of closures.
The final column of Table 3 addresses potential concerns related to the choice of cities used as the control group. As discussed earlier, vice districts were used to address issues related to urban crowding as cities grew, and local officials did not want prostitution spreading through residential neighborhoods. Therefore, cities with vice districts are larger relative to cities without. This would only be an issue if the smaller, never-treated cities were trending differently than the larger treated cities, which seems unlikely given the small estimated effects before treatment in the event study plot (Figure 3). However, Column (4) tries to more directly create a better control group by restricting the sample to cities with populations larger than 100,000 in 1910. This uses a set of never-treated cities that are closer to treated cities in terms of urbanization. When using this restricted sample, the estimated effect is similar to the baseline results in Columns (1) and (2), which use a larger set of never-treated cities that are smaller as controls.
Before examining changes in crime, Online Appendix Table B6 assesses potential heterogeneity in the effect on infant mortality with respect to city characteristics. I use the 1910 Census to construct proxies for a city’s medical infrastructure, police capacity, and socioeconomic status. Specifically, I calculate the number of medical practitioners per capita, police per capita, and the average occupational income score. Then, I estimate Equation (2), splitting the sample above or below the median value of the respective measure. Columns (1) and (2) reveal notable heterogeneity related to a city’s medical infrastructure. Specifically, the impact on early infancy deaths is much larger in cities with fewer medical practitioners. In cities with more medical practitioners, there is no statistically significant increase in early infancy deaths following closures (Column (1)). In contrast, cities with below-median practitioners experience an approximately 9 percent increase in deaths (Column (2)). This finding is consistent with higher STI transmission in cities with weaker medical infrastructure after vice district closures. Columns (3)–(6) show no significant heterogeneity in effects based on police capacity or socioeconomic status.
Reformers also argued for removal based on concerns related to crime (see Figure 1). Table 4 presents the effect of vice district closures on external deaths, a proxy for homicides. Online Appendix Figure B2 shows the event study plot for the specification corresponding to Column (1), which uses the full sample with no controls. Across all specifications in Table 4, the effect is positive, ranging from approximately 4 to 7 percent. The effect is only statistically significant in the last two specifications. Overall, the results rule out the possibility of large reductions in homicides after vice districts were closed. In all specifications, the 95 percent confidence intervals exclude reductions in external deaths larger than 1 percent, suggesting district closures did not lead to large declines in homicides. While homicides are a particularly severe form of crime, this provides suggestive evidence that vice districts did not promote crime, in contrast to what many Progressive Era reformers argued.
THE EFFECT OF CLOSING VICE DISTRICTS ON EXTERNAL DEATHS

Table 4 Long description
A table showing the effect of vice district closures on external deaths. The table has four columns and four rows. Column headers are labeled as (1), (2), (3), and (4). Row labels are ATT, Dep. var. mean, Observations, and Sample. Row 1: ATT, 0.042* (0.023), 0.039* (0.023), 0.055** (0.027), 0.075** (0.038). Row 2: Dep. var. mean, 4.677, 4.677, 4.656, 4.679. Row 3: Observations, 8246, 8246, 7254, 6851. Row 4: Sample, Full, Full, Exclude W W I, Large cities. The table presents the effect of vice district closures on external deaths, with the effect being positive across all specifications, ranging from approximately 4 to 7 percent. The effect is statistically significant in the last two specifications.
Notes: This table presents the estimates for the effect of vice district closures on the log external death rate, defined as total external deaths per 100,000 people. External deaths is a category reported in the Census Mortality Statistics that combines deaths due to accidents, suicides, and homicides. The ATT column provides the average of the dynamic treatment effects using the procedure in Callaway and Sant’Anna (2021). Column (1) presents the results for the full sample of cities from 1900–1930 with no controls. Column (2) presents the results for the full sample and controls for the influenza mortality rate. Column (3) excludes from the analysis cities that are treated in 1917 or 1918. Column (4) excludes from the analysis cities that have a population of less than 100,000 in 1910. All regressions contain city fixed effects, year fixed effects, and control for the influenza mortality rate unless stated otherwise. Standard errors are clustered at the city-level. *p<0.1; **p<0.05; ***p<0.01.
Sources: Census Mortality Statistics. See text for details.
Robustness
This section provides additional robustness checks related to the analysis of the public health effects of vice district closures.
First, Online Appendix Table B7 presents robustness to several alternative functional forms of the outcome variable when estimating the effect of district closures on early infancy deaths. Across the various alternative specifications—that use the death rate in levels, normalize differently when calculating the death rate, or use the number of deaths as the outcome—closures consistently lead to an increase in deaths. Online Appendix B.2 provides additional details related to how the outcomes were calculated.
The analysis in Table 3 addressed two primary threats to identification: potential confounding effects related to the 1918 Influenza Pandemic and troops stationed in U.S. cities during WWI. However, an additional concern is that closing vice districts was correlated with other Progressive Era policies that affected public health. During the Progressive Era, cities adopted a series of policies aimed at improving public health (Alsan and Goldin Reference Alsan and Goldin2019; Anderson, Charles, and Rees 2022; Beach Reference Beach2022; Beach et al. Reference Beach, Ferrie, Saavedra and Troesken2016; Ferrie and Troesken Reference Ferrie and Troesken2008; Cutler and Miller Reference Cutler and Miller2005). A potential concern is that these other health interventions might be driving the results. This is unlikely for two reasons. First, many of these interventions focused on making water, milk, and food safer, which would affect infant mortality through deaths related to digestive diseases that are unlikely to be captured in early infancy deaths. Second, in the context of vice districts, I find that closures lead to an increase in early infancy deaths. Since the literature finds that these other policies normally reduce infant mortality, if they were correlated with district closures, it would likely attenuate the results.
However, for a sample of cities, it is possible to assess whether the timing of other public health reforms coincides with district closures. I focus on the sample of cities studied by Anderson, Charles, and Rees (2022). They consider the 25 cities with a population of at least 150,000 in 1900 and document when these cities adopted various public health reforms related to water quality, milk quality, and sewage treatment. For each public health reform considered in Anderson, Charles, and Rees (2022), Online Appendix Figure C4 displays when these reforms occurred relative to district closures. Overall, there is no clear pattern suggesting these other public health reforms coincided with district closures.
Next, Online Appendix Table B8 provides the results of estimating Equation (2) for several placebo causes of death that address two additional concerns. The first concern is that the Progressive Era reformers who were lobbying for the closure of vice districts might have also been pushing for other changes to local governments that could improve the reporting of the death records in the Census Mortality Statistics. If this were the case, the increase in infant mortality (or external deaths) that we observe might be due to better measurement of deaths caused by changes within the bureaucracy. Two placebos address this potential concern. First, I consider the cancer death rate. The closing of vice districts should not have an effect on cancer deaths; thus, if we observe changes in the cancer death rate, it could be capturing changes in data reporting that coincide with district closures. Online Appendix Figure B1 panel (A) presents the event study results for the cancer death rate. Before and after district closures, there are no observable changes in the cancer death rate, and the average effect is close to zero (Online Appendix Table B8 Column (1)).
The second placebo that addresses potential changes in data reporting uses the fact that some deaths in the mortality data have an unknown cause. This captures how effective city governments were at recording and reporting accurate death information to the Census. In our sample, 2 percent of deaths are reported with no cause (see Online Appendix Table A2). If vice districts closures coincide with better data reporting, we would expect the share of deaths with an unknown cause to decline after closures. Online Appendix Figure B1 panel (D) displays the event study estimating Equation (2) with the share of deaths with an unknown cause as the outcome. There is no change in the unknown share of deaths before and after closures. If anything, the average effect in Online Appendix Table B8 Column (4) suggests there is a small increase after districts are closed. Overall, these two placebos help rule out that the increase in infant mortality we observe is being driven by changes in data reporting that could have occurred due to other Progressive Era reforms.
The last two placebos address a second concern: the observed increase in early infancy deaths could be due to higher levels of infectious disease mortality more broadly, which could be driven by health shocks that happen to coincide with vice district closures. As discussed earlier, many vice district closures coincided with the 1918 Influenza Pandemic, prompting me to control for the influenza death rate in some specifications. Columns (2) and (3) of Online Appendix Table B8 present the effect of closures on two other infectious diseases, tuberculosis and measles, respectively. Panels (B) and (C) of Online Appendix Figure B1 present the associated event studies. The results suggest there are no changes in deaths associated with these two infectious diseases after districts were closed. This helps rule out that the effect on early infancy deaths is being driven by other coinciding shocks that could influence infectious diseases more broadly.
Finally, in Online Appendix B.2.1, I perform a back-of-the-envelope calculation to help understand whether the observed increase in infant deaths is consistent with the number of men demanding sex work and the likelihood of syphilis transmission. I perform the calculation for the city of Baltimore because the Maryland Vice Commission collected remarkably detailed information on the vice district, including the share of sex workers with syphilis and the number of men frequenting brothels. I supplement this historical information with probabilities from the medical literature related to the likelihood of contracting syphilis, in-utero syphilis transmission, and the likelihood of infants dying from syphilis. Out of a population of over 550,000 in 1910, the calculation implies approximately 2,000 married men must be demanding sex work annually to rationalize the observed increase in mortality.
VICE DISTRICTS & STI TRANSMISSION
One of the most natural questions related to the public health consequences of red-light districts is how they affect the transmission of STIs. Many recent papers studying the criminalization or legalization of sex work have focused on STI transmission (Gertler and Shah Reference Gertler and Shah2011; Cunningham and Shah Reference Cunningham and Shah2018; Cameron, Seager, and Shah Reference Cameron, Seager and Shah2021). Studying this question using the empirical strategy used to analyze effects on mortality is not feasible, given that systematic city-level STI transmission data has not been available historically. However, this section examines how vice districts affected STI transmission by digitizing detailed records from the turn of the century from a hospital in New Orleans. The Charity Hospital in New Orleans produced detailed annual reports on the patients it treated, as well as the reasons for their admission to the hospital. Using this data, it is possible to assess how vice districts affected STI transmission that did not ultimately result in mortality.
The vice district in New Orleans was one of the most notorious in the United States. In contrast to many other cities, New Orleans fully decriminalized indoor prostitution within the district boundaries. The district was formally established in 1897 by the New Orleans city council and was nicknamed Storyville after one of the council members who advocated for its creation (Landau Reference Landau2013; Arceneaux Reference Arceneaux1987). Storyville covered roughly 13 city blocks northwest of the French Quarter. A unique feature of Storyville, relative to other vice districts during the period, is that directories known as Blue Books, listing the addresses of brothels and sex workers, were produced by members of the community as a way to reach potential clients. While the district was formally recognized by the local government in 1897, there is evidence that the district started forming prior to decriminalization. For example, historical newspapers suggest Blue Books for the district started to circulate in 1895 (Rose Reference Rose1974, p. 136). Indoor prostitution continued to be decriminalized in Storyville until 1917, when the U.S. Army closed the district (see Online Appendix Figure C1).
In their annual reports, the New Orleans Charity Hospital recorded detailed information on the reasons why patients were admitted to the hospital. Online Appendix Figure C5 provides an example of the digitized data. Before 1906, the annual reports include a section that aggregates the cause of admission into broader categories. Crucially, for the purposes of this study, the hospital reports admissions due to venereal diseases. Since the report is only available until 1905, it is not possible to study how hospital admissions change after Storyville is closed in 1917. However, it is possible to assess how admissions change after the opening of the district in the late nineteenth century. For this purpose, I digitize the hospital admissions data from 1887 to 1905.
Figure 4 shows how hospital admissions due to venereal diseases vary before and after the opening of Storyville relative to admissions from other disease types. For each disease type, observations are normalized to the 1895 admissions level. The gray bar corresponds to the period from 1895 to 1897, which covers when historical newspapers began reporting the existence of directories of sex workers for the district, as well as the formal opening of Storyville in 1897. The graph compares admissions from venereal diseases to three other disease categories: circulatory, digestive, and respiratory diseases. The idea is that these other categories serve as an effective comparison group since it is unlikely that the creation of a vice district would affect these diseases. The hospital treated a significant number of people for venereal diseases. Across the sample period, the hospital treated 414 individuals for STIs on average annually. This was approximately half the number treated for respiratory (874) and digestive (872) diseases, and similar to the number treated for circulatory diseases (314). Before the opening of Storyville, hospital admissions were increasing across all disease categories. After the opening of the district, admissions from circulatory diseases continued to increase while, admissions from digestive and respiratory diseases remained relatively constant. Venereal diseases declined initially and remained relatively unchanged through 1905.
HOSPITAL ADMISSIONS BEFORE AND AFTER THE VICE DISTRICT OPENING IN NEW ORLEANS
Notes: The figure displays hospital admissions by disease type at the New Orleans Charity Hospital from 1887–1905. Observations represent the total number of admitted patients, regardless of patient status or race (see Online Appendix Figure C5). The data are normalized relative to the 1895 total admissions. The gray region covers 1895 to 1897 and represents the period in which the vice district opens. Storyville formally opens in 1897, yet historical sources suggest the district started to form in 1895 (Rose Reference Rose1974, p. 136).
Source: New Orleans Charity Hospital annual reports, various editions.

If red-light districts led to the transmission of STIs, as Progressive Era reformers argued, after Storyville was established, we would expect an increase in hospital admissions due to venereal diseases relative to other disease types. However, we do not observe such an increase after the opening of the district. While there are important caveats, given this is an analysis of a single city, it provides additional evidence that vice districts did not lead to an increase in STI transmission.
DISCUSSION
This section briefly discusses potential mechanisms that might explain the results from the last two sections, where STI prevalence increased after red-light district closures.
The first potential mechanism relates to the fact that some cities required medical inspections for sex workers in the vice district, as well as other types of medical services that sex workers could access. By the early 1900s, there were tests and treatments for syphilis that had some effectiveness. By removing the vice district and criminalizing prostitution, sex workers might have had less access to these services, which could increase STI transmission. Some historians studying prostitution during the period argue that American cities were reluctant to adopt the European system of “reglementation,” in which sex workers were licensed, required to undergo frequent medical inspections for STIs, and received cards after inspections signaling they were free of STIs (Mackey Reference Mackey1984, p. 213).Footnote 16 However, many cities in the United States experimented with systems of licensing sex workers, providing them with medical services, and requiring medical inspections. St. Louis was the first city to adopt this system in the 1870s (Burnham Reference Burnham1971). Humphrey (Reference Humphrey1995) discusses how the process of inspecting sex workers was common in many vice districts in Texas. In Salt Lake City’s vice district, police would routinely arrest women in the district and charge them a fine. In practice, this served a purpose similar to licensing by allowing the police to keep track of the women. Before being released, the women would undergo medical examinations (McCormick Reference McCormick1982 pp. 173–74)
The system in San Francisco provides a useful illustration. From 1911 to 1913, the city managed a Municipal Clinic that worked with the police department to license and frequently test sex workers for STIs. Under the system, sex workers were required to appear at the clinic every four days to be inspected by doctors. If the sex worker was free of STIs, they were given a certificate stating they were free to continue their work for the next four days. Physicians could have a Wassermann test conducted if they thought a sex worker might have contracted syphilis. If a sex worker was found to have an STI, they were given free medical care at a local hospital. The Municipal Clinic notified the police department if a sex worker did not appear for testing, and police were sent to the sex worker’s address. The program was paid for by a $1.50 weekly fee paid by the sex workers (Shumsky Reference Shumsky1978).
While systems like the one in San Francisco were often short-lived, they familiarized sex workers with what medical services were available. Criminalizing sex work by closing vice districts likely reduced access to medical services since seeking medical treatment might put the sex worker at legal risk. This is consistent with research in the modern context showing STI transmission increases after sex work is criminalized because sex workers seek medical services less frequently (Cameron, Seager, and Shah Reference Cameron, Seager and Shah2021).
A related mechanism concerns the industrial organization of sex work in vice districts. Most sex work in vice districts occurred within brothels managed by madams, as opposed to less formal locations such as on the street, in pubs, or in rented hotel rooms. Brothel owners often had incentives to ensure their sex workers did not have STIs. For example, when Salt Lake City established its vice district, they reached out to a famous madam in the city, Dora B. Topham, urging her to locate her brothel in the district. When discussing operating the brothel with the local newspaper, she states, “I know, and you know, that prostitution has existed since the earliest ages, and if you are honest with yourselves, you will admit that it will continue to exist… I believed that I could segregate the evil, that I could control it, and that I could decrease disease by an intelligent management, and while profiting financially myself, do some good” (McCormick Reference McCormick1982, p. 176). Topham mentions explicitly having incentives to “decrease disease” in her brothel. The Maryland Vice Commission, which studied sex work in Baltimore’s district, also mentions that many madams employed physicians to conduct physical examinations of sex workers.Footnote 17 As vice districts were closed and sex workers began operating on their own more discreetly, they may not have had access to medical services to the same degree as when working directly for madams.
The last possible mechanism relates to the location of sex workers and how this might have changed sexual interactions after vice districts were closed. By restricting sex workers to a particular area, potential clients would have higher transportation costs if they lived far from the district. This could lead to an equilibrium in which most clients who bought sex work were those near the vice district and STI transmission was highest in this part of the city. After vice districts closed, sex workers might have tried to discreetly relocate to other parts of the city and continue engaging in sex work. In this scenario, sex workers might spread STIs to clients in their new locations, leading to broad STI spread within the city.
Local leaders who supported “segregated vice” often argued that closing vice districts would lead to prostitution simply relocating within the city, making it harder to regulate (see row 3 of Figure 1). Some historians have argued that sex workers often relocated within the city and continued engaging in sex work (Keire Reference Keire2010, p. 98). Contemporary newspaper accounts also suggest that some cities had difficulty eliminating sex work when they closed vice districts. Online Appendix Figure C6 displays an excerpt from an article titled “Vice Suppression Fails” in the Pittsburgh Post-Gazette on 30 November 1914, discussing the vice district in Gary, Indiana. City officials in Gary had closed the vice district earlier in the year, but “found it impossible to prevent disorderly places [from] springing up in residence sections…and decided the protection of the community demanded a segregated district under police regulation.”
While it is likely that closing vice districts caused some sex workers to either move out of the city or move into other types of occupations, these historical accounts suggest many sex workers simply relocated to other parts of the city and tried to evade detection by the police. This could have increased STI transmission as new clients began interacting with sex workers in their new locations. This mechanism is similar to the literature studying how partner changes among people with different HIV risk can affect overall transmission of HIV (Kremer Reference Kremer1996).
CONCLUSION
The consequences of different sex work regulations are generally hard to assess due to data constraints and limited policy variation. This study examines a historical episode in the United States where red-light districts were closed by local governments. Infant deaths from premature birth and congenital defects rose after districts were closed, consistent with increased syphilis transmission. Additionally, homicide rates did not decline, suggesting districts did not promote crime. The increase in infant mortality is consistent with recent empirical and theoretical work showing that criminalizing sex work leads to an increase in STI transmission (Cameron, Seager, and Shah Reference Cameron, Seager and Shah2021; Immordino and Russo Reference Immordino and Russo2015). These results may have implications for policies criminalizing sex work in developing countries where STI testing is scarce and the risk of in utero syphilis transmission is high.
The Progressive Era reformers who lobbied for the closure of vice districts argued that the districts worsened public health outcomes. The results in this study suggest these concerns were likely overstated. These results stand in contrast to other policies advocated by Progressive Era reformers, such as sewage treatment and water filtration, which previous literature has shown to reduce infant mortality. While it is hard to quantify, in addition to these negative public health consequences, closing vice districts had significant economic costs for the sex workers who were forced to relocate.
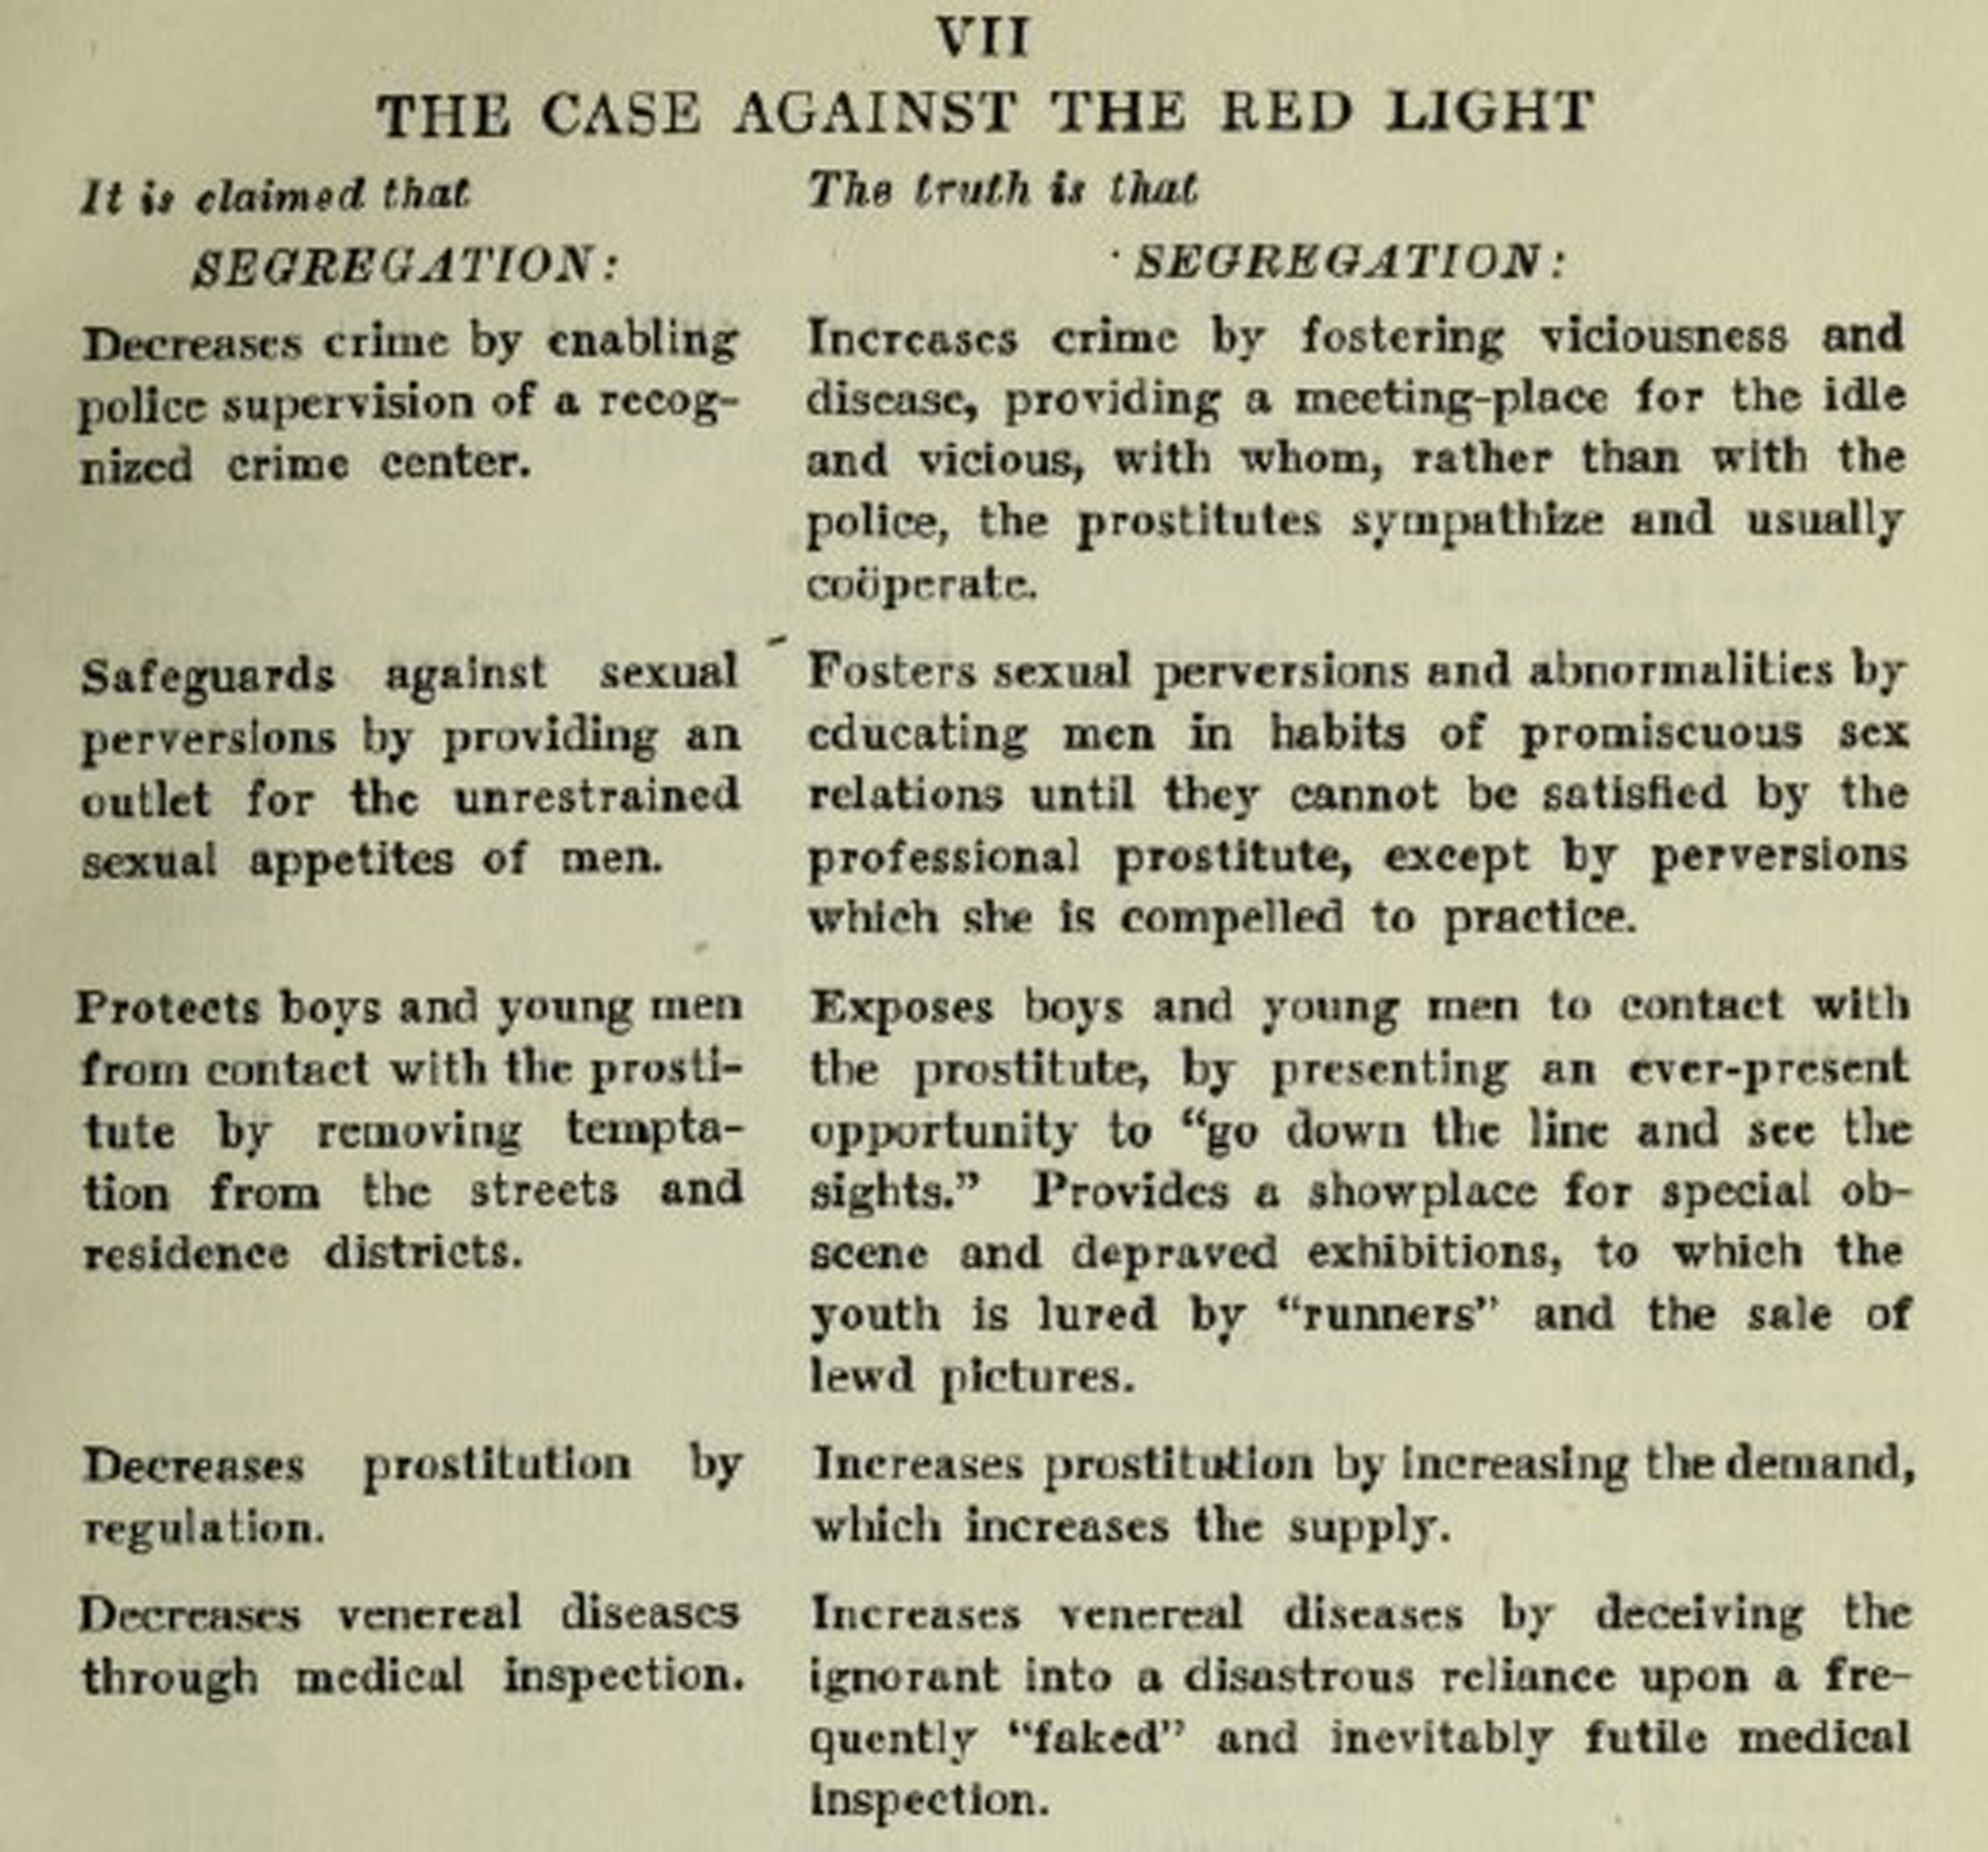
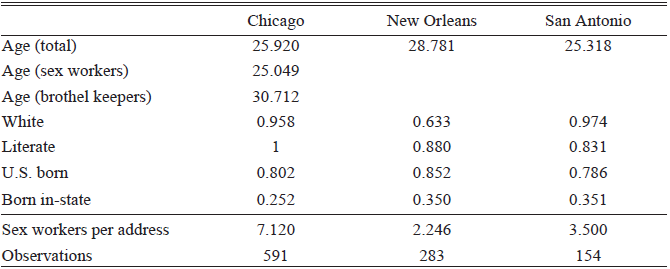
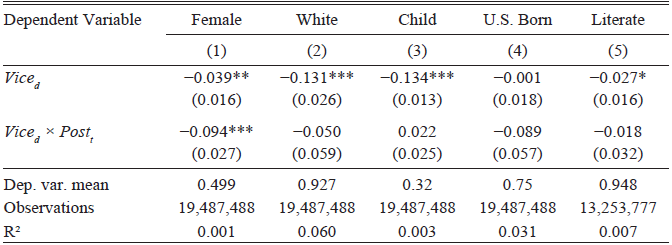
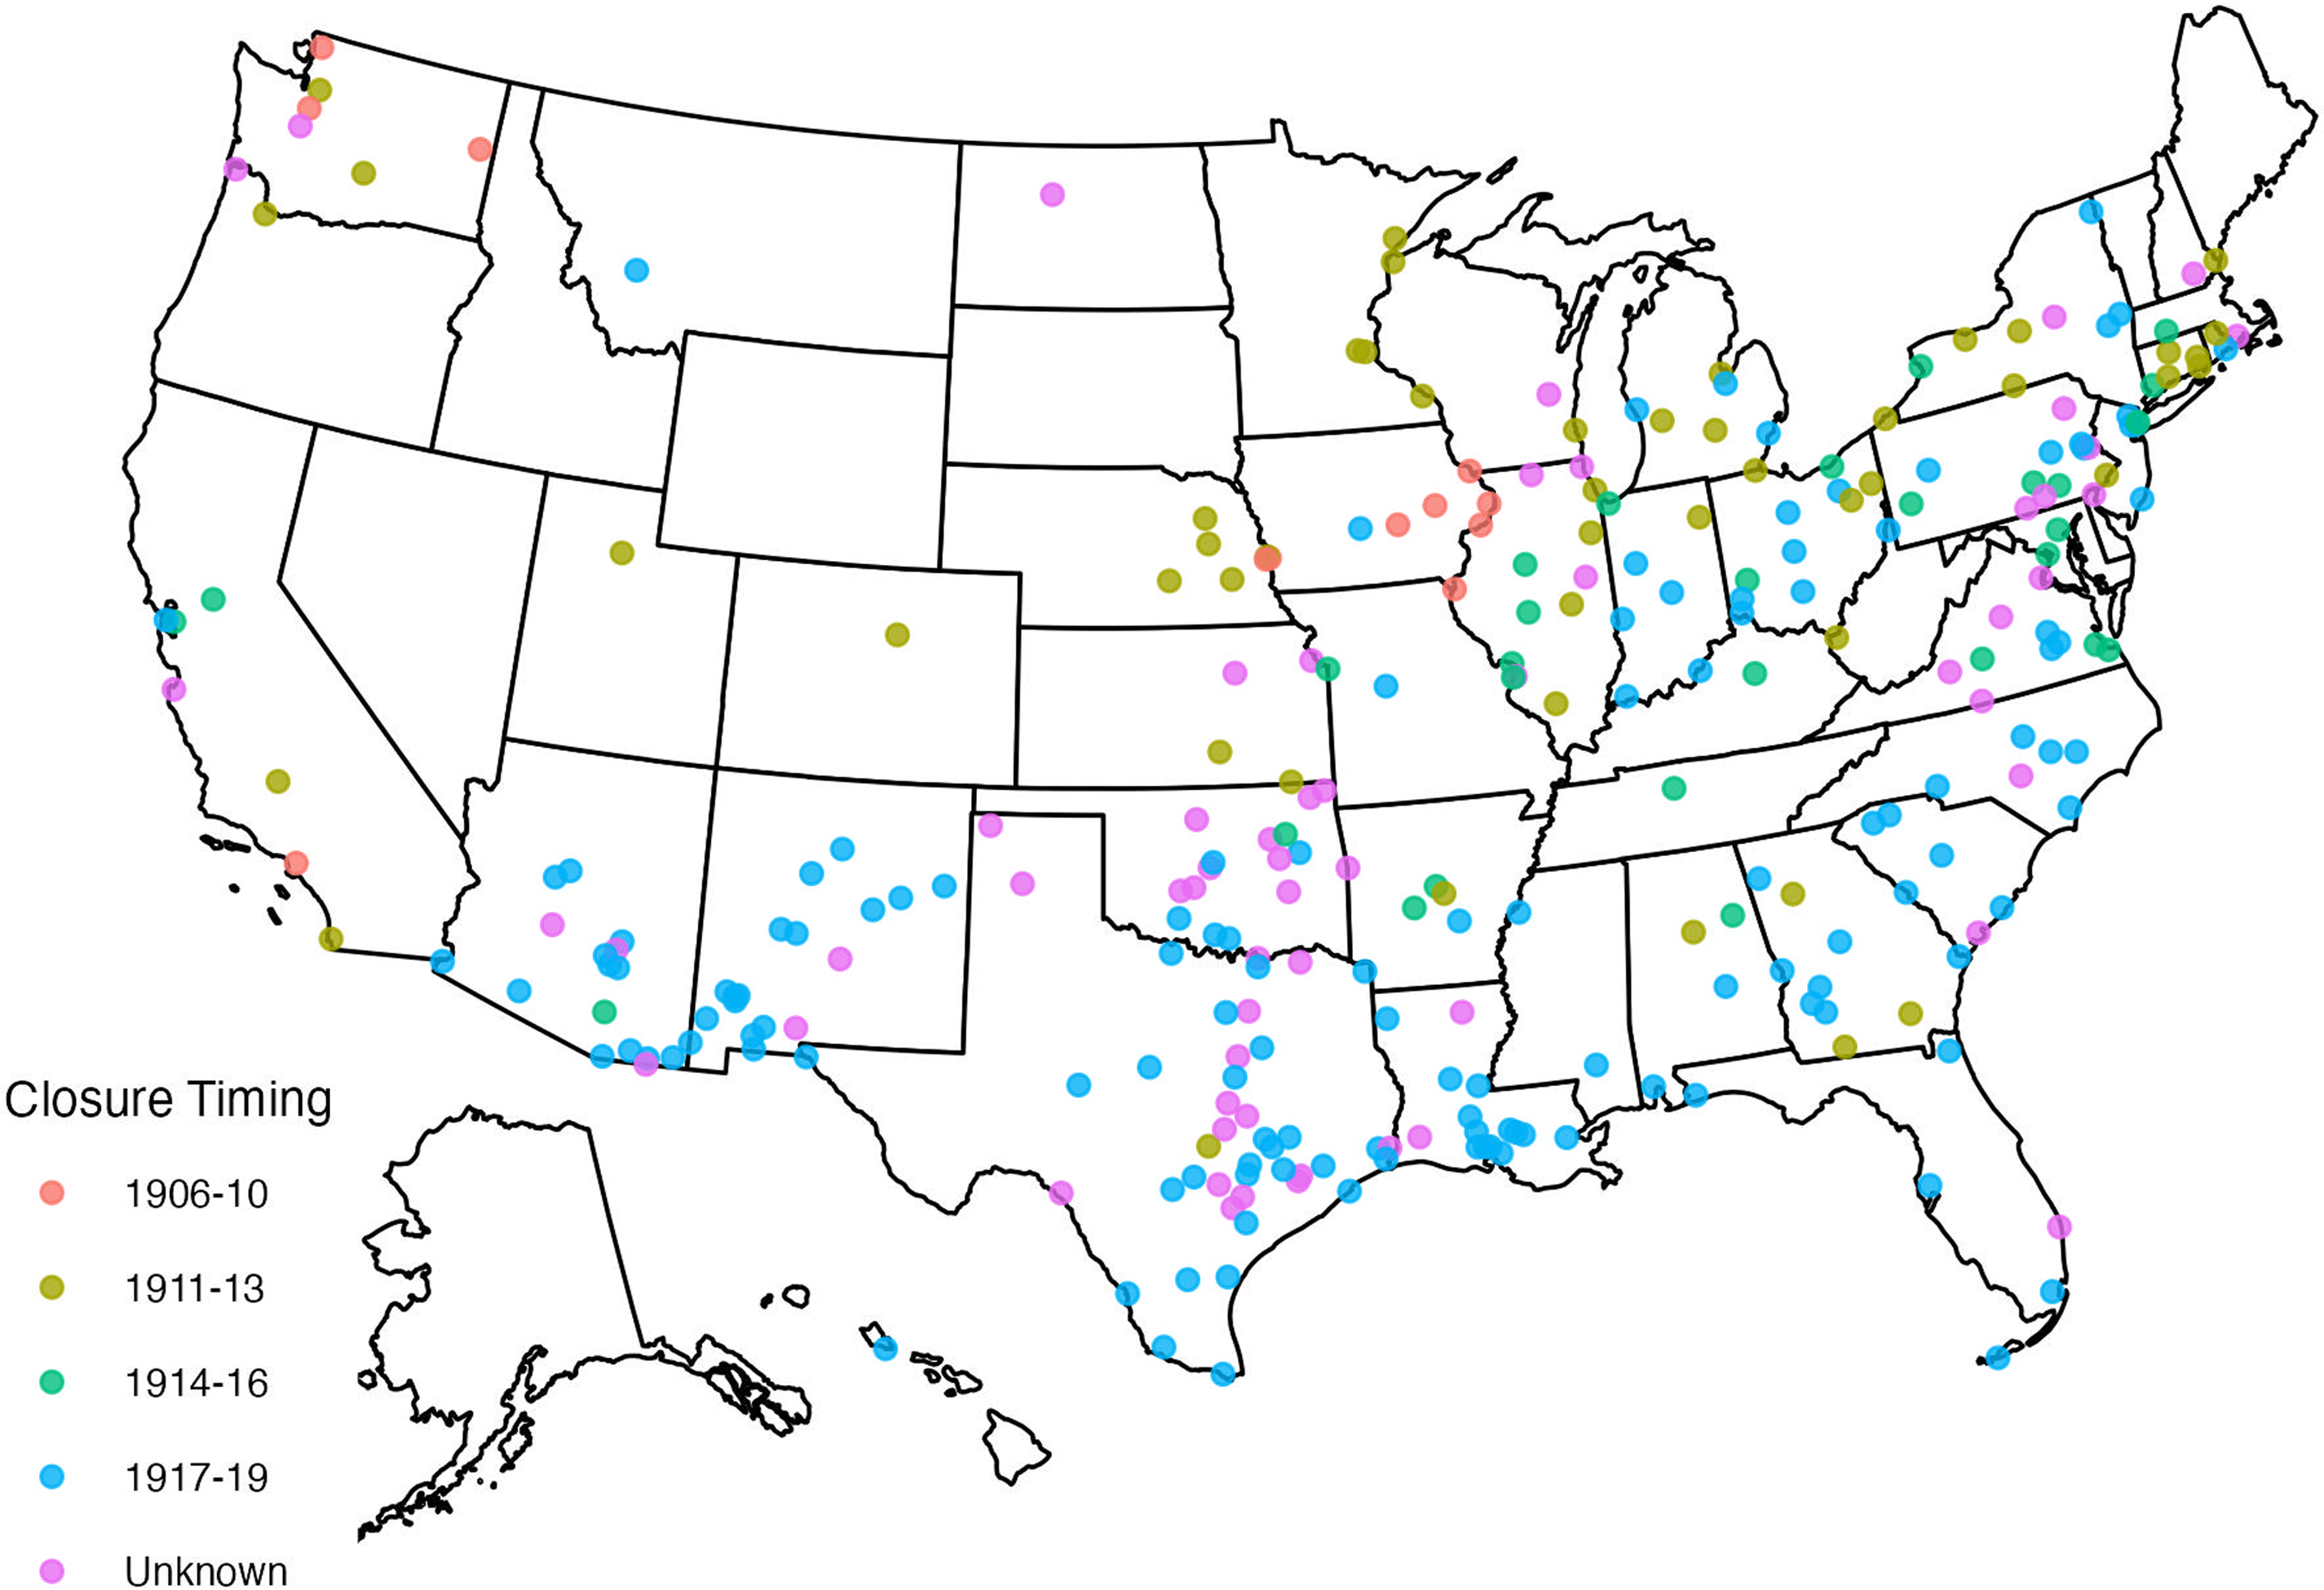
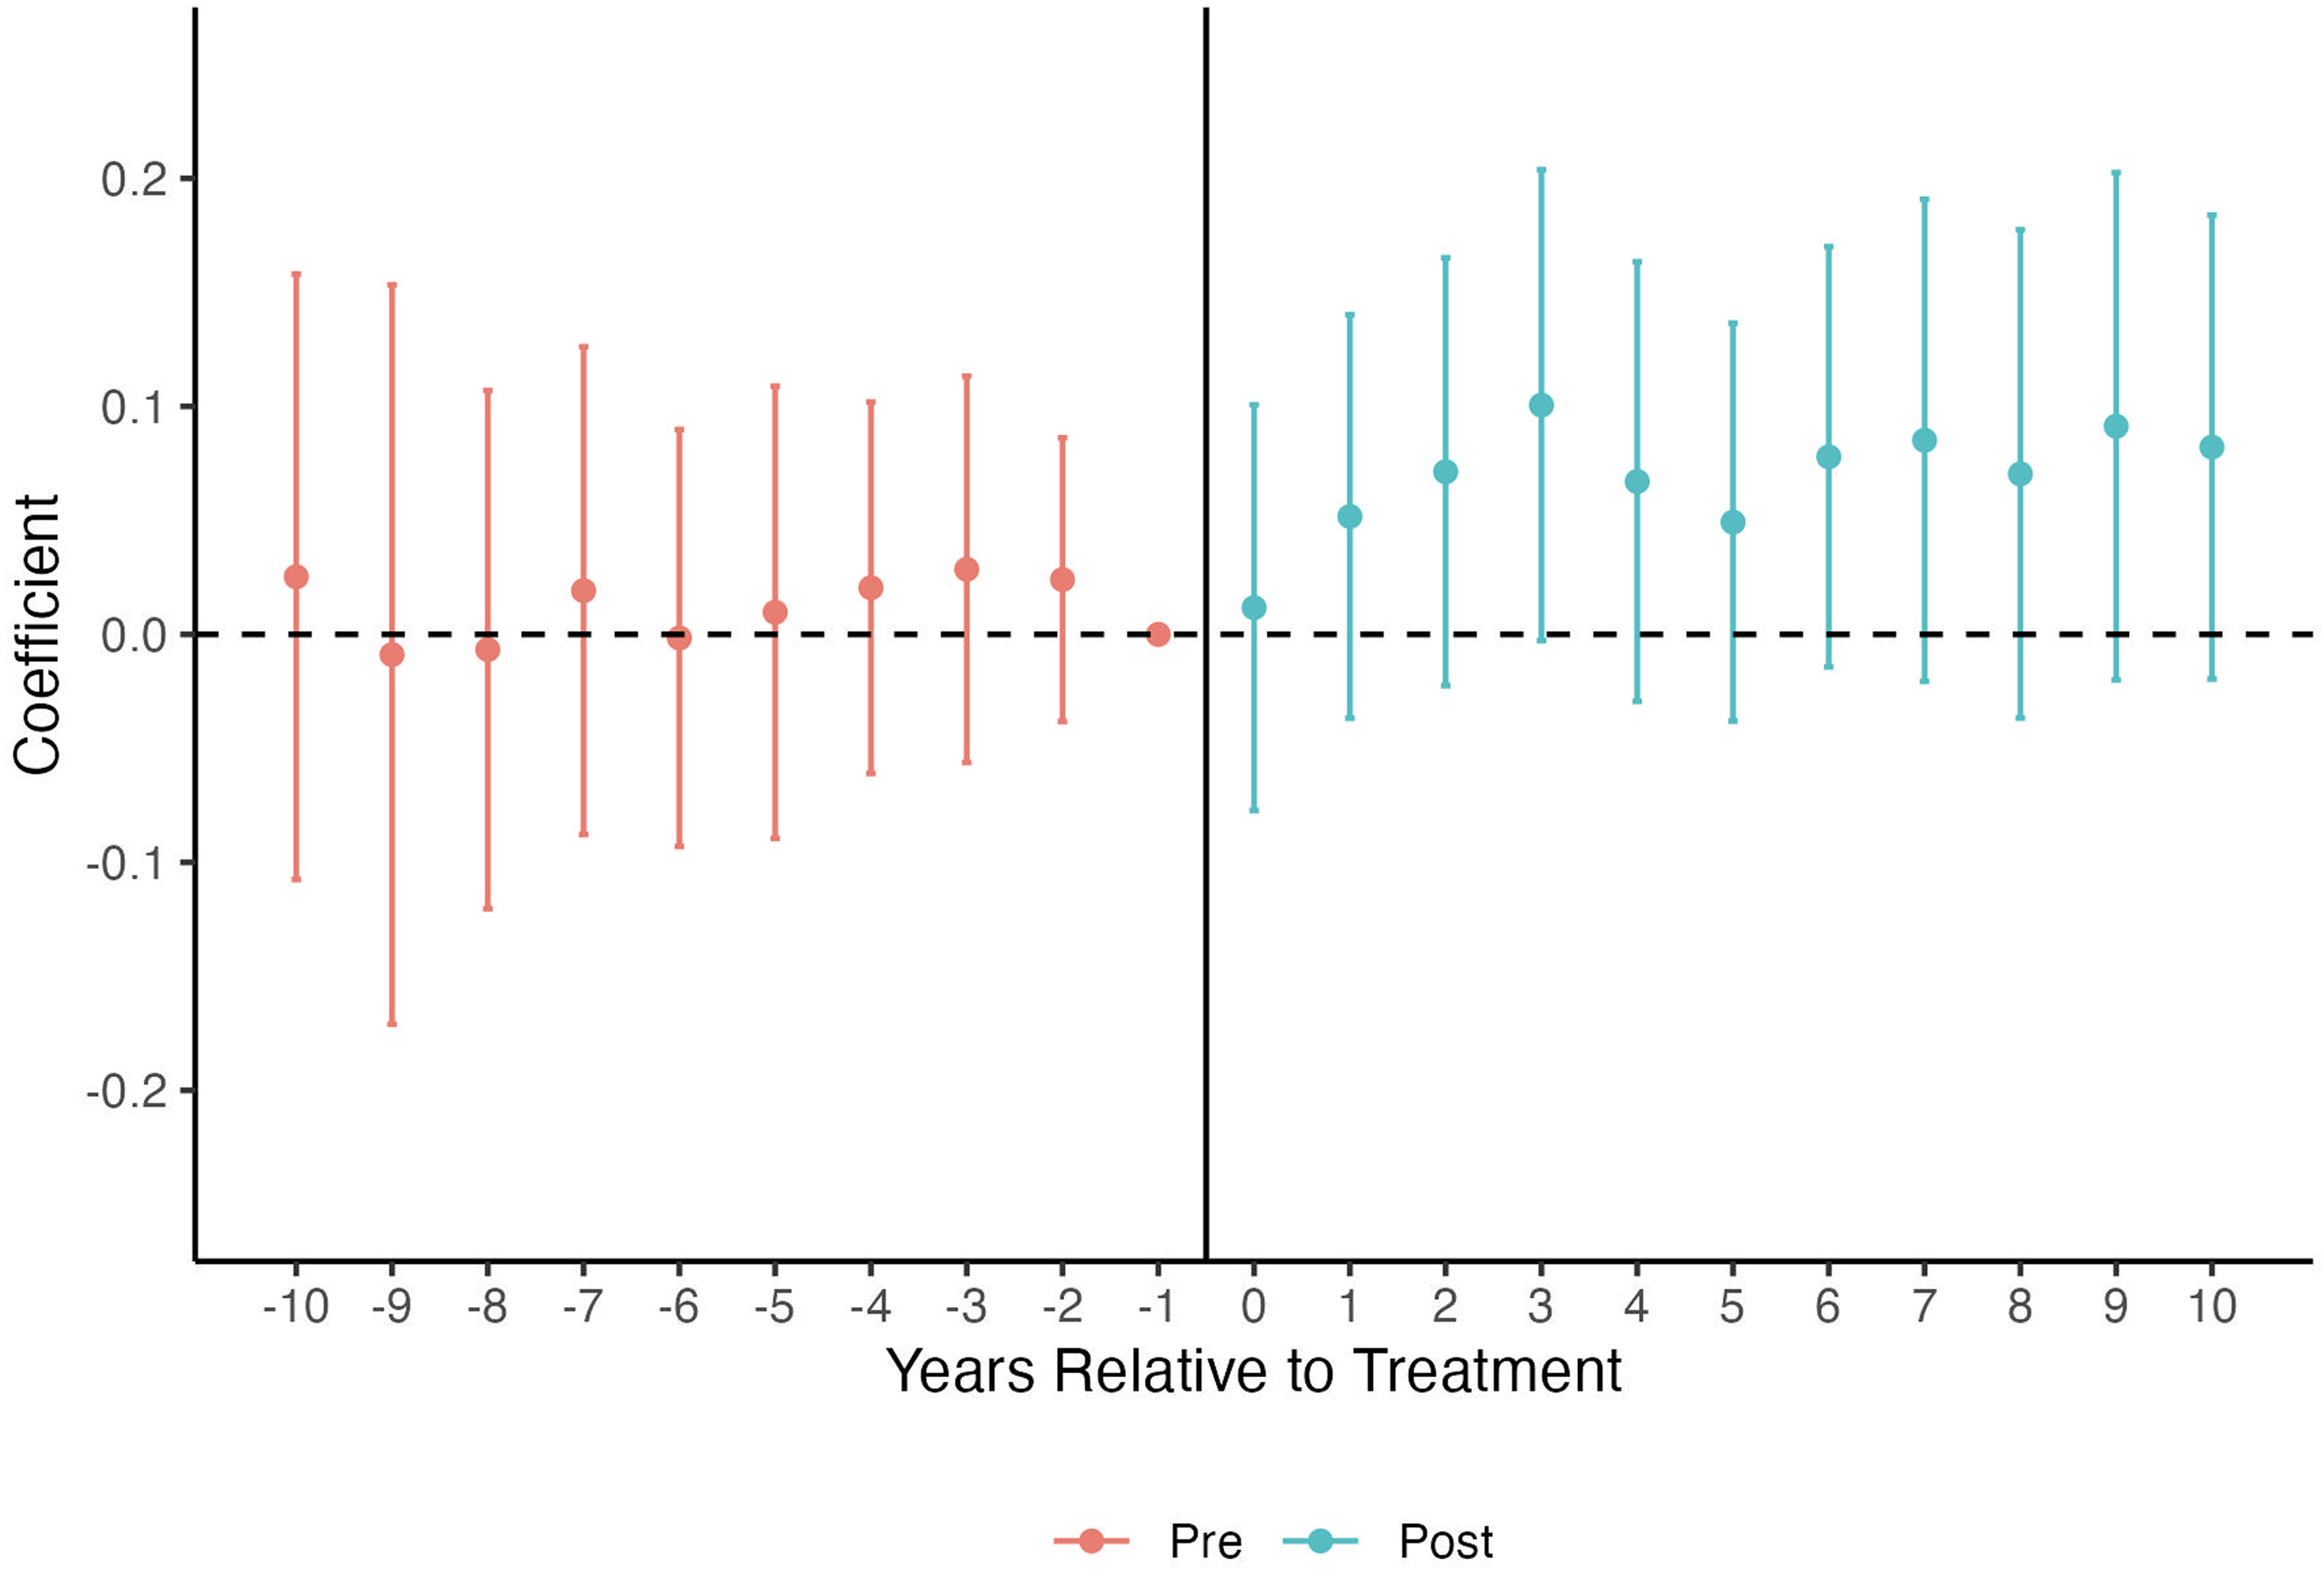
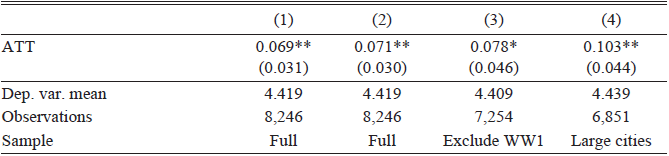
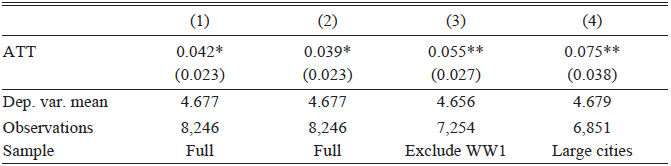
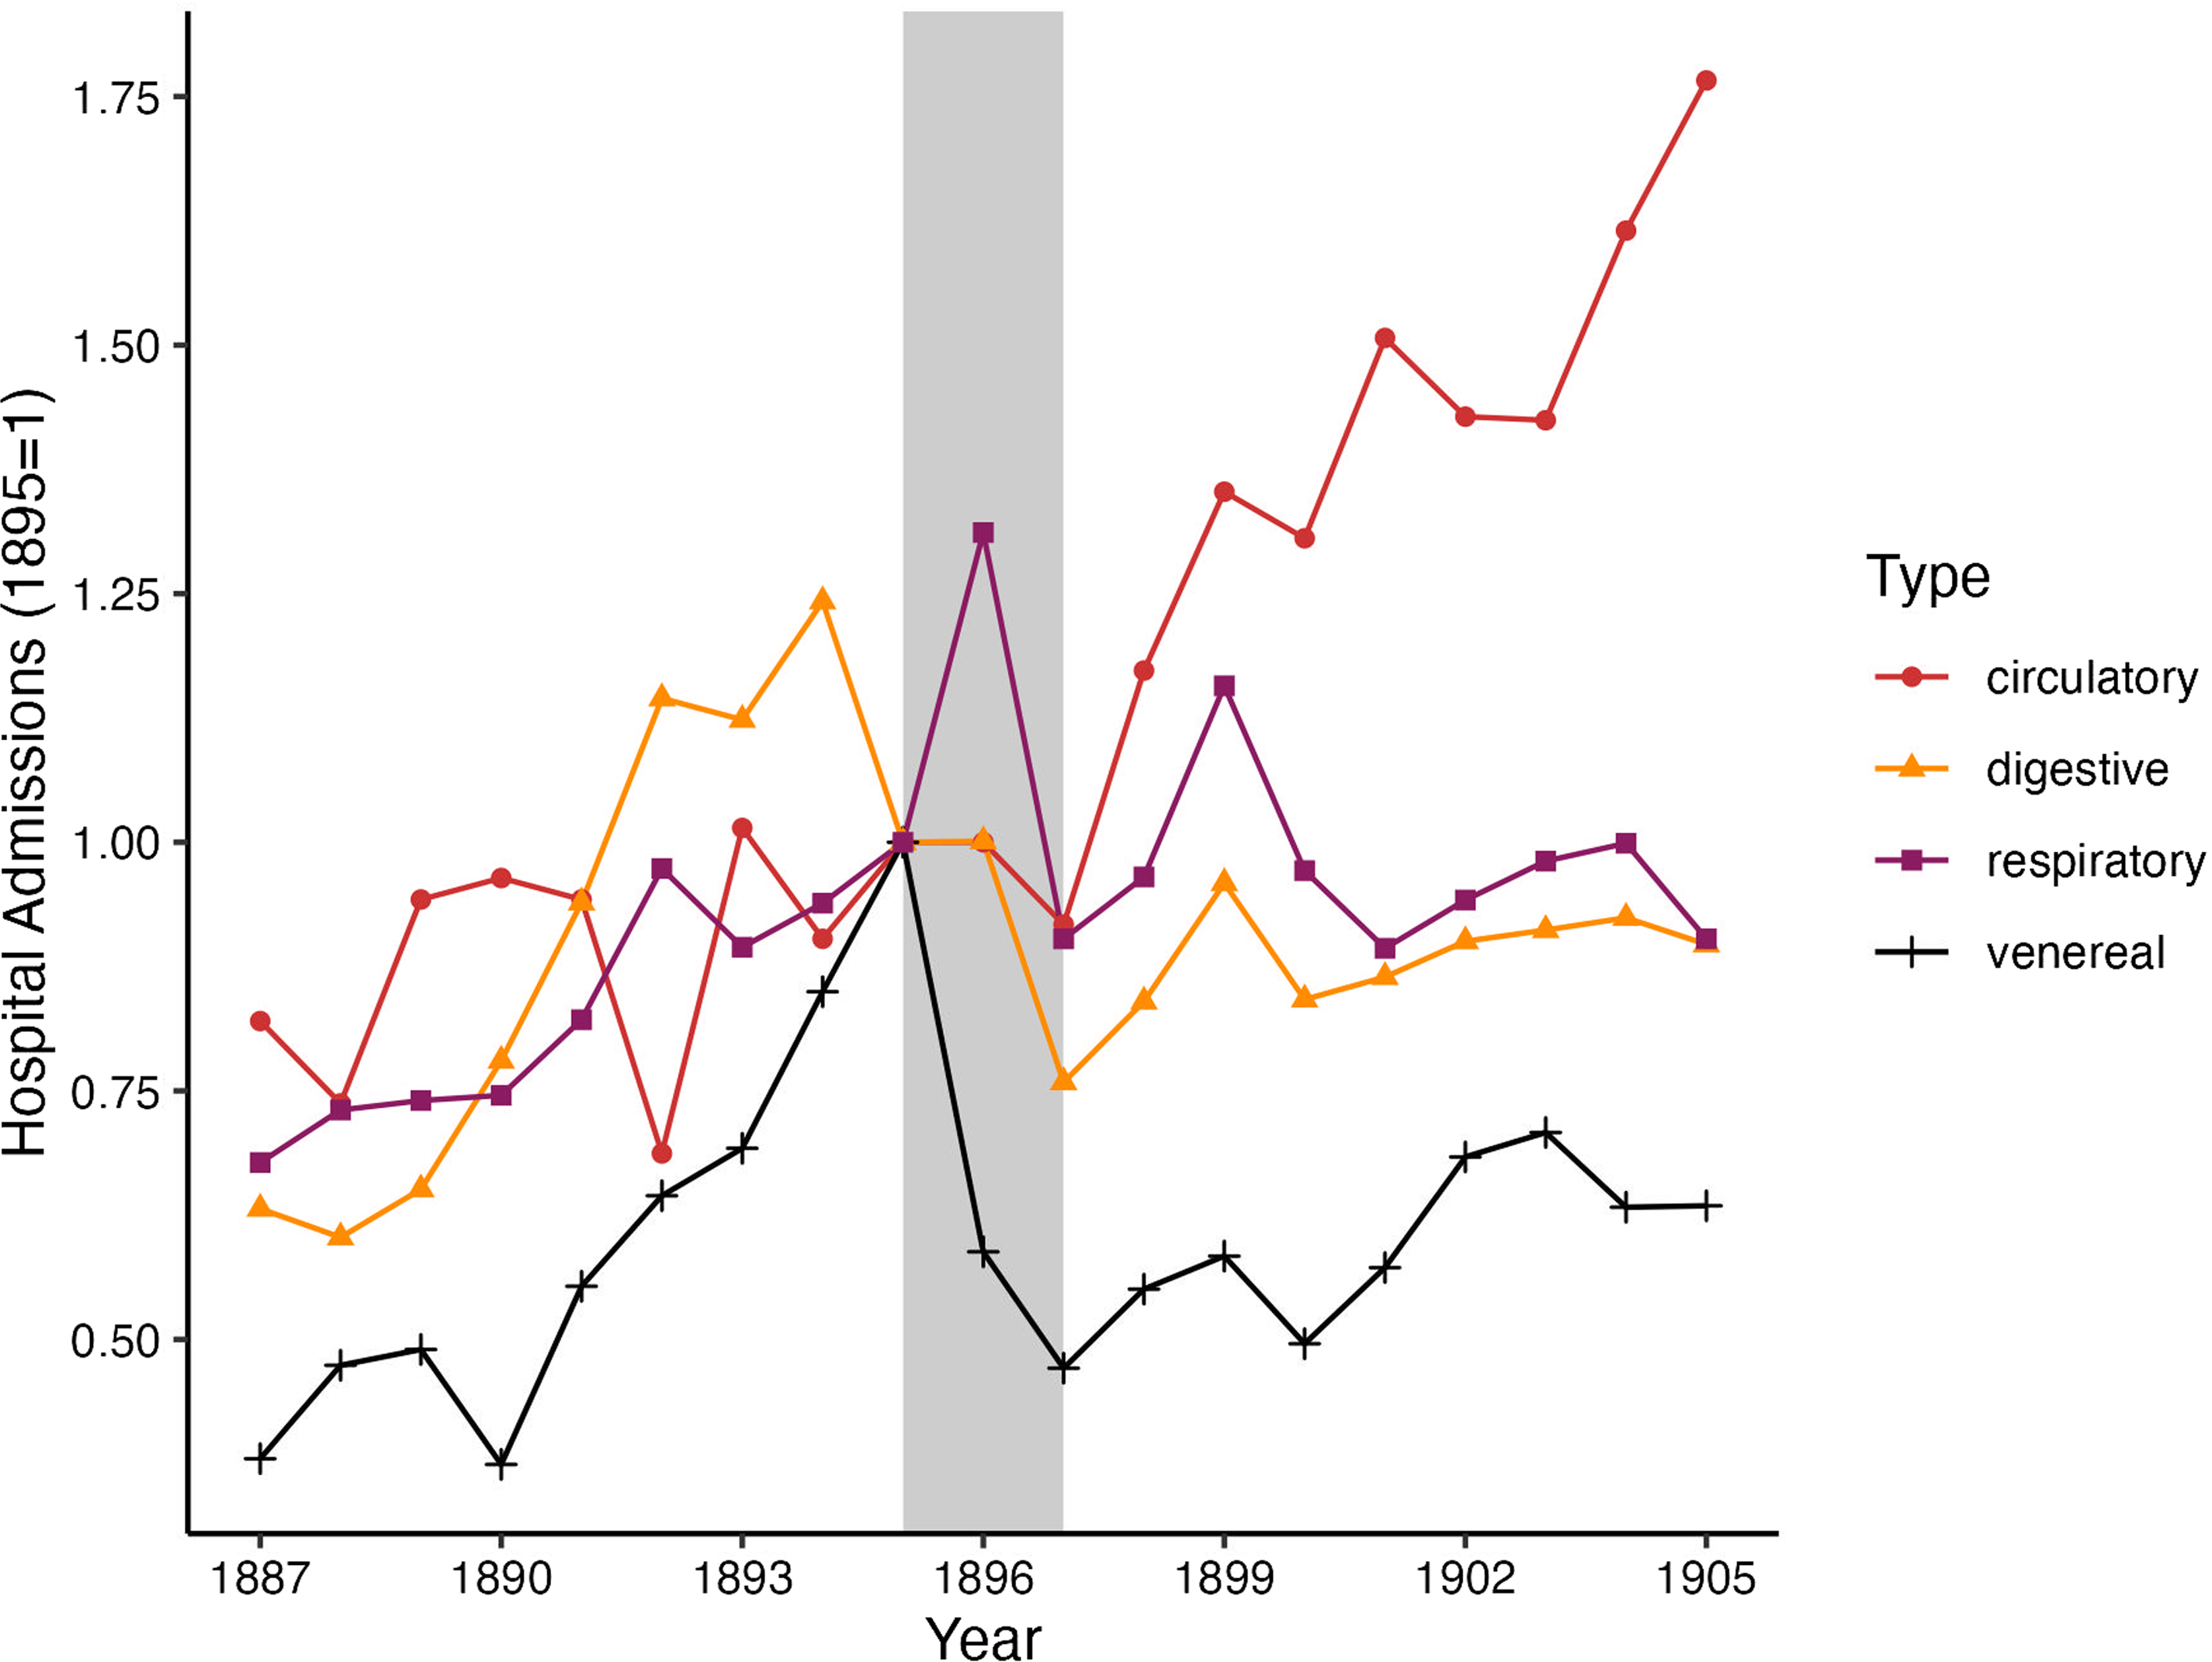


 Open access

