INTRODUCTION
Heinrich events were identified during the last glacial period as enhanced ice-rafted debris (IRD) that were found in marine deep sea sediments from the North Atlantic as a result of massive iceberg calving (Heinrich, Reference Heinrich1988; Hemming, Reference Hemming2004). The icebergs led to huge volumes of ice rafting across the North Atlantic, leading to important changes in oceanic circulation, such as the reduction in the North Atlantic Deep Water formation (Hemming, Reference Hemming2004) and the consequent slowdown of the Atlantic Meridional Overturning Circulation (AMOC). In the 1990s, the slowdown of the AMOC during Heinrich events and the associated cooling in the Northern Hemisphere were attributed to the meltwater pulses from the events themselves (Broecker, Reference Broecker1994; Paillard and Labeyrie, Reference Paillard and Labeyrie1994; Rahmstorf, Reference Rahmstorf1994). However, in the 2000s, an increasing number of studies suggested that the AMOC disruption occurred before the iceberg discharges (Roche et al., Reference Roche, Paillard and Cortijo2004; Hall et al., Reference Hall, Moran, Zahn, Knutz, Shen and Edwards2006). The relationship between the North Atlantic Deep Water, the AMOC, and the oceanic changes responsible for destabilizing grounded ice shelves remained elusive until the findings of Marcott (Reference Marcott, Clark, Padman, Klinkhammer, Springer, Liu and Otto-Bliesner2011) and Álvarez-Solas et al. (Reference Álvarez-Solas, Montoya, Ritz, Ramstein, Charbit, Dumas, Nisancioglu, Dokken and Ganopolski2011). Since these studies, a marine subsurface warming occurring at the same time as large reductions in the AMOC was identified more than 1 ka prior to a Heinrich event (Marcott et al., Reference Marcott, Clark, Padman, Klinkhammer, Springer, Liu and Otto-Bliesner2011). Here, it is worth noting the clear distinction between Heinrich stadials and Heinrich events. A Heinrich stadial, characterized by low Northern Hemisphere temperatures linked to a weak AMOC, precedes a Heinrich event, which is limited to the IRD from iceberg calving recorded in the North Atlantic sediments. Recognizing that the icebergs arrived too late to trigger the initial cooling, this paradigm implies that while fresh water derived from melting ice provides a positive feedback system to prolong stadial conditions, it is not a trigger for a stadial event (Álvarez-Solas et al., Reference Álvarez-Solas, Robinson, Montoya and Ritz2013; Barker et al., Reference Barker, Chen, Gong, Jonkers, Knorr and Thornalley2015).
Together with Heinrich events, the global picture of abrupt climate changes during the last glacial cycle cannot be completed without mentioning the Dansgaard-Oeschger oscillations. Contrary to Heinrich events, which are identified in marine records, Dansgaard-Oeschger cycles are identified in Greenland ice cores and are characterized by abrupt warmings (interstadials) followed by more gradual coolings (stadials) (Dansgaard et al., Reference Dansgaard, Clausen, Gundestrup, Hammer, Johnsen, Kristinsdottir and Reeh1982, Reference Dansgaard, Johnsen, Clausen, Dahl-Jensen, Gundestrup, Hammer and Hvidberg1993). Dansgaard-Oeschger variations in the North Atlantic sea surface temperatures are well correlated with Greenland temperatures, although Heinrich events are not seen with extreme low temperatures in the ice cores (Bond et al., Reference Bond, Showers, Elliot, Evans, Lotti, Hajdas, Bonani, Johnson, Alley, Clark, Keigwin and Webb1999; Hemming, Reference Hemming2004).
The climatic response of Iberia and its surroundings to Heinrich events has been identified in several paleorecords in the last two decades (e.g., Cacho et al., Reference Cacho, Grimalt, Pelejero, Canals, Sierro, Flores and Shackleton1999; Sánchez Goñi et al., Reference Sánchez Goñi, Turon, Eynaud and Gendreau2000; Moreno et al., Reference Moreno, Cacho, Canals, Prins, Sánchez Goñi, Grimalt and Weltje2002). Marine records analyzing such oscillations are abundant in the Bay of Biscay, the Iberian margin, the Alborán Sea, and the western Mediterranean (Combourieu Nebout et al., Reference Combourieu Nebout, Turon, Zahn, Capotondi, Londeix and Pahnke2002; Sánchez Goñi et al., Reference Sánchez Goñi, Cacho, Turon, Guiot, Sierro, Peypouquet, Grimalt and Shackleton2002; Roucoux et al., Reference Roucoux, de Abreu, Shackleton and Tzedakis2005; Sierro et al., Reference Sierro, Hodell, Curtis, Flores, Reguera, Colmenero-Hidalgo and Bárcena2005; Voelker et al., Reference Voelker, Lebreiro, Schonfeld, Cacho, Erlenkeuser and Abrantes2006; Beaudouin et al., Reference Beaudouin, Jouet, Suc, Berné and Escarguel2007; Naughton et al., Reference Naughton, Sánchez Goñi, Desprat, Turon, Duprat, Malaize, Joli, Cortijo, Drago and Freitas2007; Fletcher and Sánchez Goñi, Reference Fletcher and Sánchez Goñi2008; Frigola et al., Reference Frigola, Moreno, Cacho, Canals, Sierro, Flores and Grimalt2008; Toucanne et al., Reference Toucanne, Zaragosi, Bourillet, Naughton, Cremer, Eynaud and Dennielou2008). In contrast, the terrestrial response is not well constrained owing to the lack of good records and the problems associated with obtaining a reliable chronology (see the review of Moreno et al., Reference Moreno, González-Sampériz, Morellón, Valero-Garcés and Fletcher2012). Focusing on the last deglaciation, it should be noted the dearth of speleothems in Europe, specifically in Iberia (Atsawawaranunt et al., Reference Atsawawaranunt, Comas-Bru, Amirnezhad Mozhdehi, Deininger, Harrison, Baker and Boyd2018; Lechleitner et al., Reference Lechleitner, Amirnezhad-Mozhdehi, Columbu, Comas-Bru, Labuhn, Pérez-Mejías and Rehfeld2018). The OD, corresponding to the counterpart of Heinrich Stadial 1 (HS-1) on the continent (Naughton et al., Reference Naughton, Sánchez Goñi, Desprat, Turon, Duprat, Malaize, Joli, Cortijo, Drago and Freitas2007), has been identified as the last cold event before deglaciation, and was even colder than the last glacial maximum according to some Iberian records (Cacho et al., Reference Cacho, Grimalt, Canals, Sbaffi, Shackleton, Schönfeld and Zahn2001).
Regionally, records covering the OD are scarce and offer only a sparse view of cold/dry conditions (Valero-Garcés et al., Reference Valero-Garcés, Zeroual, Kelts, Benito, Baker and Gregory1998; González-Sampériz et al., Reference González-Sampériz, Valero-Garcés, Moreno, Jalut, García-Ruiz, Martí-Bono, Delgado-Huertas, Navas, Otto and Dedoubat2006; Millet et al., Reference Millet, Rius, Galop, Heiri and Brooks2012). Such records from the Pyrenees in northeastern Iberia exhibit rather homogeneous climate conditions during the OD, which are explained either by the location at high altitude with persistent cold conditions or by the low temporal resolution. Likewise, a stalagmite record from northern Iberia that was growing during the last glacial maximum records a hiatus in the OD (Moreno et al., Reference Moreno, Stoll, Jiménez-Sánchez, Cacho, Valero-Garcés, Ito and Edwards2010). Notably, an advance of the glaciers has been recorded during the OD in many mountains in Iberia (Palacios et al., Reference Palacios, de Andrés, Gómez-Ortiz and García-Ruiz2017a, Reference Palacios, García-Ruiz, Andrés, Schimmelpfennig, Campos, Léanni, Aumaître, Bourlès and Keddadouche2017b), entailing the most remarkable readvance since the last glacial maximum. Therefore, while the dominance of cold conditions is certain during the OD, inferring predominant dryness remains controversial. Because of such contradictory results, new records are needed to test the hypothesis of widespread dryness during the OD.
Some studies suggest a multiphase evolution in the hydrology in this regard; a transition from humid to dry conditions throughout the OD has been inferred by means of salinity in Lake Estanya in the Pyrenees (Morellón et al., Reference Morellón, Valero-Garcés, Vegas-Vilarrúbia, González-Sampériz, Romero, Delgado-Huertas, Mata, Moreno, Rico and Corella2009). Furthermore, the most illustrative and detailed insights about the complex structure of the OD in Iberia throughout several hydroclimate phases have been pointed out by Naughton et al., (Reference Naughton, Sánchez Goñi, Desprat, Turon, Duprat, Malaize, Joli, Cortijo, Drago and Freitas2007, Reference Naughton, Sánchez Goñi, Kageyama, Bard, Duprat, Cortijo and Desprat2009, Reference Naughton, Sanchez Goñi, Rodrigues, Salgueiro, Costas, Desprat and Duprat2016), using pollen assemblies in marine cores from the Iberian margin. A tri-phase pattern was established in a few sequences with extremely high sedimentation rates, whereas two phases were detected in lower resolution sequences (Naughton et al., Reference Naughton, Sanchez Goñi, Rodrigues, Salgueiro, Costas, Desprat and Duprat2016). A pattern of wet conditions during the first (older) phase and dry conditions in the second (followed by another relatively wet phase in the case of three-folded records) is common in these records. Similar complex patterns during that period have also been reported from lake sequences and speleothems from other regions outside Iberia (Broecker and Putnam, Reference Broecker and Putnam2012; Stríkis et al., Reference Stríkis, Chiessi, Cruz, Vuille, Cheng, de Souza Barreto and Mollenhauer2015). Reconstructing the hydrological evolution during the OD in terrestrial Iberia is important to understanding the response on land to the complex climatic patterns during this event and the teleconnections established with atmospheric and oceanic processes.
Here, we present a new speleothem record from Meravelles cave in northeastern Iberia that extends across the OD. Chronologically well-resolved, the outstanding resolution reached on the stable isotopes enables the identification of decadal abrupt events in the last deglaciation. Our data suggest a heterogeneous pattern in the hydrology, with generally wetter conditions than shown in many other reconstructions of the OD in Iberia. Notably, this record shows clear shifts in δ18O and δ13C that are attributed to two key events: (1) the onset of the cold conditions of the OD ascribed to HS-1, and (2) the iceberg discharge in the Atlantic Ocean due to Heinrich Event 1 (HE-1) (sensu stricto). Such findings confirm the hypothesis of Álvarez-Solas et al. (Reference Álvarez-Solas, Montoya, Ritz, Ramstein, Charbit, Dumas, Nisancioglu, Dokken and Ganopolski2011) on a terrestrial European record.
STUDY AREA
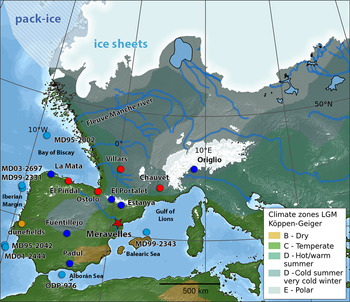
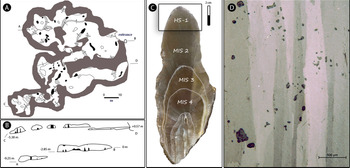
Meravelles cave (40°56′55.62″N, 0°30′45.59″E, 125 m asl) (Fig. 1) is located in northeastern Spain, near the village of Benifallet, Tarragona. It is in the Serra de Cardó mountainous system, next to the Ebro River and 25 km from the Mediterranean Sea. It formed in lower Jurassic limestone, dolostone, and breccia, and has 510 m of mainly flat galleries, reaching a maximum depth of only 10 m (Fig. 2). Surrounding the cave is sclerophyll vegetation composed mainly of calcicole shrublands of Rosmarino-Ericion multiflorae and other taxa, including Fabaceae (Anthyllis cytisoides), Poaceae (Phlomido lychnitidis-Brachypodietum retusi), and sparse Pinus halepensis forests.
Paleoenvironmental reconstruction of western Europe prior to deglaciation. The sea level is -120 m compared to the modern level, according to reconstructions of the last glacial maximum. Meravelles cave (this study, red star) and other records cited in the text are indicated by the following colors: red (cave), sky blue (marine core), navy blue (lake), and yellow (dune fields, including the Caparica clifftop dune, the inland extension of the Aeolian system, and the Apostica transgressive dune field) (modified from Becker et al., Reference Becker, Verheul, Zickel and Willmes2015). (For interpretation of the references to color in this figure legend, the reader is referred to the web version of this article.)

(color online) (A) Plan view of Meravelles cave. (B) Cross section of the cave. (C) Polished half of the MAAT record; the square at the top indicates the part of the stalagmite used in this study; some main hiatus throughout the record (gray lines) are also marked. (D) Photomicrograph showing columnar calcite fabrics.

The local climate is typical Mediterranean (Csa following Köppen-Geiger). From 2000 to 2015, the weather station belonging to the Global Network of Isotopes in Precipitation in nearby Tortosa measured a mean annual rainfall of 520 mm and a mean annual temperature of 18.3°C (Rodríguez-Arévalo et al., Reference Rodríguez-Arévalo, Díaz-Teijeiro and Castaño2011). Seasonally, mean temperatures reach 26.8°C during summer and 12.0°C during winter. The hydroclimate is characterized by equinoctial rains during autumn and spring, generally dry summers, and relatively dry winters. However, it is worth noting the recurrence of episodes of high rainfall in short intervals of time, associated with cutoff lows and mesoscale convective systems that occur mainly at the end of summer and the onset of autumn. Such episodes of extreme rainfall lead to unusually humid late summers in the year of occurrence. This was the case in 2006, 2009, and 2014 in Tortosa, where >100 mm of rainfall was recorded in September of each year. Such an amount represents 38, 45, and 21% of the total rainfall in 2006, 2009, and 2014, respectively. It must be noted that the mean rainfall during September represents only 13% of the total in the same period (Rodríguez-Arévalo et al., Reference Rodríguez-Arévalo, Díaz-Teijeiro and Castaño2011). There is thus a subdecadal occurrence of such extreme events.
A previous study have linked the rainfall in Tortosa with the Western Mediterranean Oscillation, a low-frequency index of pressure differences between Padua (northern Italy) and San Fernando (southern Iberia) (Martin-Vide and Lopez-Bustins, Reference Martin-Vide and Lopez-Bustins2006). In that study, rainfall data from 1951 to 2000 were compared with the Western Mediterranean Oscillation index and showed that 69.8% of rainfall events occurred under negative values in the index. This relationship is much stronger if we take into account the episodes of torrential rainfall: 96.1% of daily rainfall >50 mm coincided with a negative Western Mediterranean Oscillation index, and 100% coincided with amounts >100 mm for the same period (Martin-Vide and Lopez-Bustins, Reference Martin-Vide and Lopez-Bustins2006).
METHODS
The stalagmite studied here (dubbed MAAT) from Meravelles cave is 15 cm long (in the present work, we focused on the top 2.5 cm, covering early deglaciation) and was collected in situ and cut along the growth axis with a diamond saw and then polished (Fig. 2). A total of 250 samples were drilled along the extension axis at 0.1-mm increments for stable isotope analysis; 26 samples were taken at 1-mm increments for trace-metal analysis, and 14 samples were taken for 230Th dating at different intervals, mainly every 1–2 mm, to identify any potential change in growth rate. A thin section covering the whole area of MAAT was examined using transmitted light microscopy.
Stable isotopes analysis was performed at the Isotope Laboratory of Xi'an Jiaotong University, using a ThermoFisher Delta V Plus mass spectrometer coupled with a Kiel-IV. Values are reported as δ18O (‰) and δ13C (‰) with respect to the Vienna Pee Dee Belemnite (VPDB) standard. Long-term precision for δ13C and δ18O (1σ) was 0.03 and 0.06‰, respectively. Calibration of the raw results versus the VPDB scale was achieved using TTB-1 and NBS 18 reference materials. Trace metal analysis was performed at the Pyrenean Institute of Ecology, using inductively coupled plasma-optical emission spectrometry (ThermoFisher iCAP DUO 6300). An approximate 1-mg sample was dissolved in 2% HNO3. The results were expressed as molar ratios against Ca. 230Th dating was performed using a Thermo Neptune multicollector inductively coupled plasma mass spectrometer at Xi'an Jiaotong University and the University of Minnesota, following the methodology described in Cheng et al. (Reference Cheng, Edwards, Hoff, Gallup, Richards and Asmerom2000). The decay constants are reported in Cheng et al. (Reference Cheng, Edwards, Shen, Polyak, Asmerom, Woodhead and Hellstrom2013).
The depth-age model was constructed using COPRA (Breitenbach et al., Reference Breitenbach, Rehfeld, Goswami, Baldini, Ridley, Kennett and Prufer2012), tracing the confidence interval (95%) through Monte Carlo simulations by the PHCIP method with the 2σ deviation from the median trajectory of the proxy. The ages are expressed in years before present (BP). Spectral analyses were run in REDFIT (Schulz and Mudelsee, Reference Schulz and Mudelsee2002) and Morlet continuous wavelet in Matlab (Grinsted et al., Reference Grinsted, Moore and Jevrejeva2004), with time series interpolated at equal steps. All the correlations used in this study were calculated with Spearman's rank correlation coefficient (ρ).
RESULTS
Petrography, age model, and growth rate
Focusing on the top 2.5 cm of MAAT, long and thin crystals parallel to the growth axis were identified, with a length/width ratio >6:1 and flat regular borders (Fig. 2). Thin-section observation suggests that the sample is entirely composed of calcite. The fabric corresponds to “columnar,” following the nomenclature of Frisia (Reference Frisia2015). Neither macro- nor microlamination was recognized in the sample.
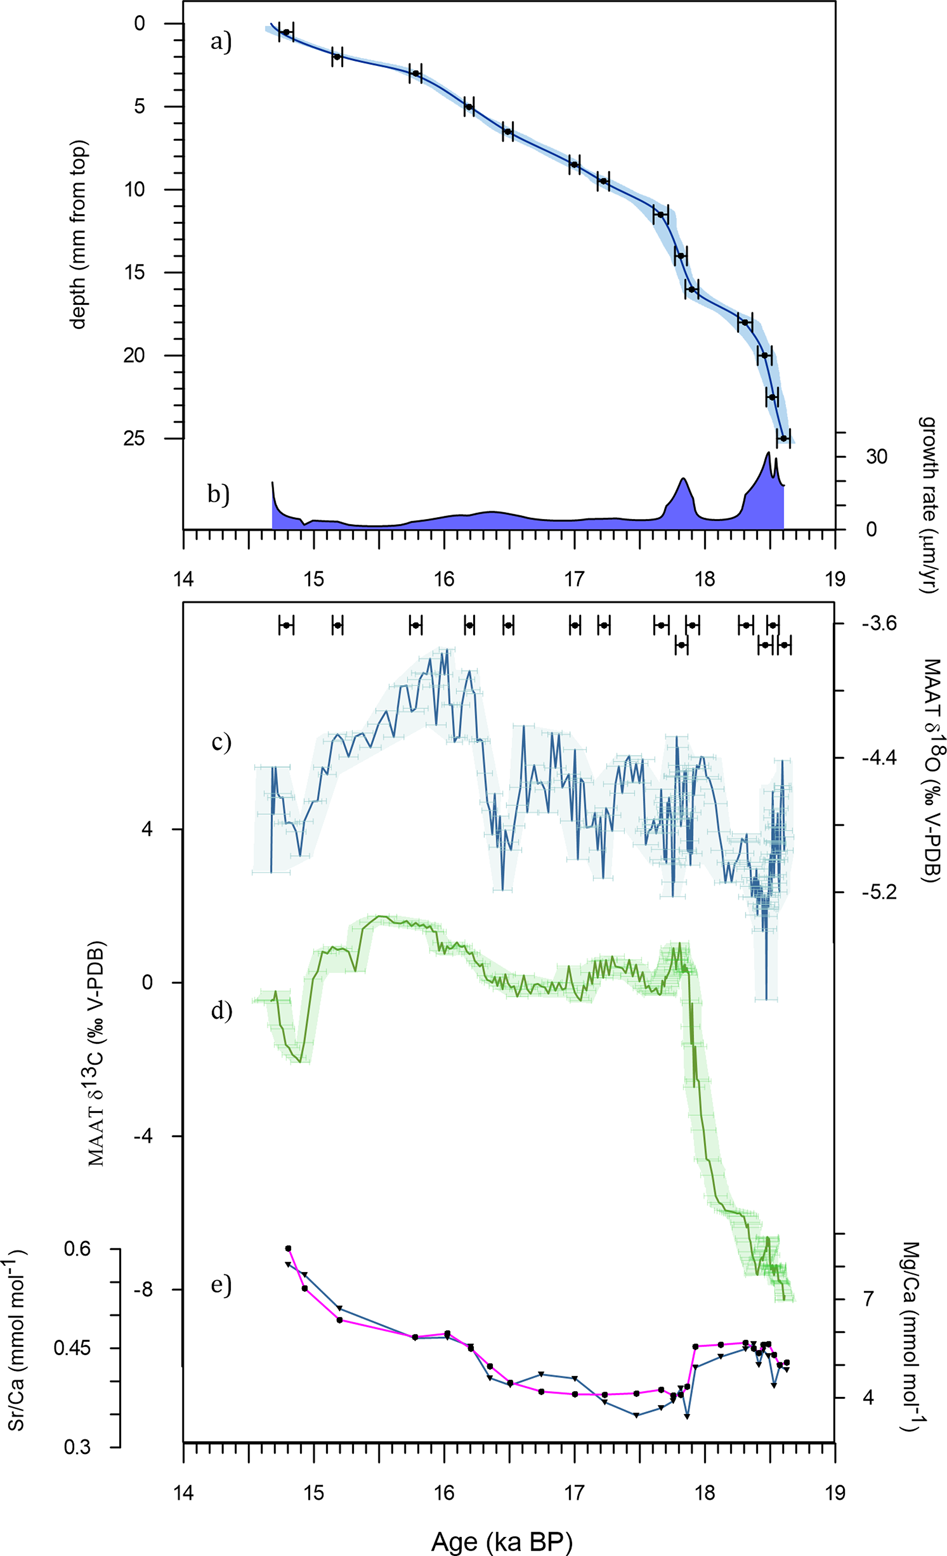
A total of 14 230Th dates (Table 1) extracted from the top 2.5 cm of MAAT were used to build the chronological record (Fig. 3a), showing mean analytical uncertainties of 3‰. Samples are genuinely clean, reaching consistent and high 230Th/232Th ratios between 2000 and 25,000 (Table 1). 238U content is approximately 460 parts per billion (ppb), whereas δ234Uinitial is approximately 400 (Table 1).
Results from the MAAT record. (a) Age model. (b) Growth rate. (c) δ18O. (d) δ13C. (e) Mg/Ca (= pink) and Sr/Ca (= blue) trace-metal ratios. 230Th dates with uncertainties are also indicated. (For interpretation of the references to color in this figure legend, the reader is referred to the web version of this article.)

230Th dating results.

Note: The error is 2σ. Sample name numbers refer to the distance in millimeters from the top.
a ppb = parts per billion..
b ppt = parts per trillion.
c δ234U = ([234U/238U]activity – 1) ×1000.
d δ234Uinitial was calculated based on the 230Th age (T); i.e., δ234Uinitial = δ234Umeasured × eλ234×T.
e Corrected 230Th ages assume the initial 230Th/232Th atomic ratio of 4.4 ± 2.2 × 10⁻⁶. Those are the values for a material at secular equilibrium, with the bulk earth 232Th/238U value of 3.8. The errors are arbitrarily assumed to be 50%.
Growth rate ranges from 1 to 2 μm/yr (15.71–15.27 ka), 31 to 32 μm/yr (18.49–18.47 ka), and 20 to 21 μm/yr (17.85–17.81 ka) (Fig. 3b). Mean growth rate is 12 μm/yr. Focusing on key events, growth rates are approximately 4 μm/yr during the onset of the OD (18.13 ka), whereas 6–4 μm/yr are reached during the δ18O negative anomaly in the main part of the OD (16.17–15.89 ka). The continuous growth of MAAT during the OD is remarkable, given other regional cave records, such as Villars cave (Genty et al., Reference Genty, Blamart, Ghaleb, Plagnes, Causse, Bakalowicz, Zouari, Chkir, Hellstrom and Wainer2006) and El Pindal (Moreno et al., Reference Moreno, Stoll, Jiménez-Sánchez, Cacho, Valero-Garcés, Ito and Edwards2010), exhibit hiatus during this event.
Isotope and trace-metal geochemistry
The δ18O record of MAAT shows values between −5.84 and −3.75‰ (mean = −4.70 ± 0.02‰). The lowest δ18O values are reached in the bottom part of the record (18.47 ka), while the maximum occurred at 16.02 ka (Fig. 3c). The δ13C values range from −8.27 to + 1.74‰ (mean = −2.30 ± 0.22‰). Similar to δ18O, the lowest δ13C values are found in the oldest part of the record (18.61 ka), while the highest are reached at 15.49 ka (Fig. 3d). The absolute δ13C variability is notably high, reaching a 10.01‰ in a 4-ka-long record. Interestingly, δ18O and δ13C are well correlated (ρ = 0.66, p-value <0.001) throughout the record. The temporal resolution reached on the stable isotope data varies between 4 and 71 years, with an average resolution of 16 years. The subdecadal resolution is reached during 18.6–18.3 and 17.9–17.7 ka.
The trace-metal ratios analyzed, namely Mg/Ca and Sr/Ca, show a statistically significant strong positive correlation (ρ = 0.9, p-value <0.001) throughout the record. The lowest values in both stable isotope and trace-metal ratios are reached in the oldest part of the record; the highest values are seen in the youngest section.
DISCUSSION
Interpretation of proxies
δ18O
The columnar fabric of MAAT, considered a primary fabric, is likely associated with near-equilibrium conditions during the formation of the speleothem (Frisia et al., Reference Frisia, Borsato, Fairchild and McDermott2000, Reference Frisia, Borsato and Hellstrom2018). The correct stratigraphic order of the 230Th dates and the absence of diagenetical evidence support the primary origin of the fabric.
When a positive correlation between δ18O and δ13C is found in speleothems, it might be considered evidence of isotopic disequilibrium (Mickler et al., Reference Mickler, Stern and Banner2006). Kinetic effects, such as rapid CO2 degassing, and evaporative effects in the cave, would lead to an enrichment of speleothem 18O and 13C (Wiedner et al., Reference Wiedner, Scholz, Mangini, Polag, Mühlinghaus and Segl2008). However, some recent reviews highlight the existence of positive correlations between speleothem δ18O and δ13C in many paleoclimate studies (Fairchild et al., Reference Fairchild, Smith, Baker, Fuller, Spötl, Mattey and McDermott2006; Mickler et al., Reference Mickler, Stern and Banner2006). Indeed, such correlation may respond to environmental factors when δ18O and δ13C variability is controlled by rainfall amount and vegetation activity, respectively. In the Mediterranean, many examples of stalagmites sensitive to changes in rainfall amount also show positive correlation between δ18O and δ13C without their respective paleoclimate relevance being compromised (e.g., Drysdale, Reference Drysdale2006; Columbu et al., Reference Columbu, Drysdale, Capron, Woodhead, De Waele, Sanna, Hellstrom and Bajo2017; Regattieri et al., Reference Regattieri, Zanchetta, Isola, Bajo, Perchiazzi, Drysdale, Boschi, Hellstrom, Francke and Wagner2018).
Once diagenetic processes are discarded, δ18O of speleothems from mid-latitudes are driven by several factors that in turn control the δ18O of the precipitation, such as cloud condensation temperature (Dansgaard, Reference Dansgaard1964; Fricke and O'Neil, Reference Fricke and O'Neil1999), storm track pathways (Sturm et al., Reference Sturm, Vimeux and Krinner2007), variations in the ocean water δ18O (Schrag et al., Reference Schrag, Adkins, McIntyre, Alexander, Hodell, Charles and McManus2002), changes in the vapor source (Charles et al., Reference Charles, Rind, Jouzel, Koster and Fairbanks1994), changes in seasonality (Denton et al., Reference Denton, Alley, Comer and Broecker2005), and amount of rainfall (Rozanski et al., Reference Rozanski, Araguás-Araguás, Gonfiantini, Swart, Lohmann, Mckenzie and Savin1993). In the present record, changes in the vapor source are not expected owing to the orography of the study area, leeward of the Atlantic influence and hydrologically controlled by rainfall of Mediterranean origin. Different storm track pathways might occasionally affect δ18O at event—or even monthly—scale, but it is unlikely at the millennial scale of this study with a prevalent zonal atmospheric circulation that characterized glacial stages (Li and Battisti, Reference Li and Battisti2008; Beghin et al., Reference Beghin, Charbit, Kageyama, Combourieu-Nebout, Hatté, Dumas and Peterschmitt2015).
The meltwater discharges mainly during spring and summer decrease the AMOC and preclude the northward oceanic heat transfer, expanding sea-ice cover in the North Atlantic, including the Bay of Biscay (Zaragosi et al., Reference Zaragosi, Eynaud, Pujol, Auffret, Turon and Garlan2001), and setting the climate in a winter-centric mode (Denton et al., Reference Denton, Alley, Comer and Broecker2005, Reference Denton, Anderson, Toggweiler, Edwards, Schaefer and Putnam2010; Toucanne et al., Reference Toucanne, Soulet, Freslon, Silva Jacinto, Dennielou, Zaragosi, Eynaud, Bourillet and Bayon2015). In a deglaciation in “apparent” cold conditions (Toucanne et al., Reference Toucanne, Soulet, Freslon, Silva Jacinto, Dennielou, Zaragosi, Eynaud, Bourillet and Bayon2015), halfway through the precession cycle, changes in rainfall seasonality are unlikely to exert an important role on δ18O variability.
An isotopic analysis of rainfall samples from the Tortosa weather station (Rodríguez-Arévalo et al., Reference Rodríguez-Arévalo, Díaz-Teijeiro and Castaño2011) establishes a δ18O-T relationship of 0.27‰ °C-1. This slope is slightly higher than the cave fractionation factor, of negative sign (Kim and O'Neil, Reference Kim and O'Neil1997; Tremaine et al., Reference Tremaine, Froelich and Wang2011), but clearly not of enough amplitude to offer a good signal-to-noise ratio. Besides, in the same dataset, the relationship between the δ18O of the precipitation and amount of rainfall is –1.6‰ per 100 mm/month. Similar gradients in temperature and amount effect have been reported from the central and western Mediterranean (Regattieri et al., Reference Regattieri, Zanchetta, Isola, Bajo, Perchiazzi, Drysdale, Boschi, Hellstrom, Francke and Wagner2018), but the calculated gradients are site- and time-specific. Its use should be taken with care, and direct inferences of such values in the deglaciation are controversial.
Looking in more detail at the MAAT record, the trend to a lower δ18O through the end of the OD to the onset of the Bølling (Fig. 3) is unlikely to be explained by changes in air temperature, that would be attributed to cold conditions if that would be the interpretation of the δ18O. At the same time, the apparent sensitivity of δ13C to changes in temperature (see “δ13C and trace-metal ratios” section below) would not be followed by any interpretation of δ18O variability as representative of such temperature changes. In this regard, especially illustrative is the jump in δ13C at ~18 ka that would be marked by contradictory warm conditions with such δ18O interpretation. On the contrary, high growth rates are accompanied by low δ18O as well as low trace-metal ratios, suggesting a variability controlled mainly by hydrological availability. Despite that δ18O variability might reflect a mixing of factors that cannot be totally ruled out, and taking into consideration the above-mentioned reasons, we suggest that the amount of rainfall drives the δ18O variability in this record, being also sensitive to changes in ocean water δ18O. The amount of rainfall as a main control of δ18O variability has been commonly reported from speleothems in the Mediterranean area; for example, in Italy (Zanchetta et al., Reference Zanchetta, Drysdale, Hellstrom, Fallick, Isola, Gagan and Pareschi2007; Drysdale et al., Reference Drysdale, Hellstrom, Zanchetta, Fallick, Sanchez Goni, Couchoud, McDonald, Maas, Lohmann and Isola2009; Columbu et al., Reference Columbu, Drysdale, Capron, Woodhead, De Waele, Sanna, Hellstrom and Bajo2017), Macedonia (Regattieri et al., Reference Regattieri, Zanchetta, Isola, Bajo, Perchiazzi, Drysdale, Boschi, Hellstrom, Francke and Wagner2018), and Israel (Bar-Matthews et al., Reference Bar-Matthews, Ayalon and Kaufman2000). In this regard, MAAT is the first speleothem reported from Spain with such an unambiguous “Mediterranean pattern” in δ18O.
δ13C and trace-metal ratios
The carbon in speleothems has two main sources: (1) soil CO2 controlled by atmospheric CO2, plant respiration, and organic matter degradation (usually 80–90% of the total in most temperate caves); and (2) bedrock carbonate that is dissolved during seepage (Genty et al., Reference Genty, Baker, Massault, Proctor, Gilmour, Pons-Branchu and Hamelin2001, Reference Genty, Blamart, Ghaleb, Plagnes, Causse, Bakalowicz, Zouari, Chkir, Hellstrom and Wainer2006). In other latitudes, δ13C variability has been suggested as a proxy of changes in C4/C3 vegetation types (Dorale et al., Reference Dorale, Edwards, Ito and González1998), but we hypothesize this is unlikely for our study area because of the lack of proper climate conditions for C4 plants to develop (Collatz et al., Reference Collatz, Berry and Clark1998). Other speleothems in southern France and northeastern Spain have proved to be powerful records of change in vegetation productivity, soil, and microbial activity (Genty et al., Reference Genty, Blamart, Ghaleb, Plagnes, Causse, Bakalowicz, Zouari, Chkir, Hellstrom and Wainer2006; Pérez-Mejías et al., Reference Pérez-Mejías, Moreno, Sancho, Bartolomé, Stoll, Cacho, Cheng and Edwards2017).
The overall covariation between δ13C and alkaline earth metal ratios is strong in the present record and suggests a common control, probably climate-related. Correlation of Mg/Ca and Sr/Ca may be explained by prior calcite precipitation, when the infiltration waters through the epikarst reached voids or areas with lower pCO2 than that which they had previously equilibrated (Fairchild et al., Reference Fairchild, Borsato, Tooth, Frisia, Hawkesworth, Huang, McDermott and Spiro2000; Fairchild and Treble, Reference Fairchild and Treble2009). In addition, prior calcite precipitation favors the release of 12C into degassed CO2, thus increasing 13C in the dripwaters (Johnson et al., Reference Johnson, Hu, Belshaw and Henderson2006). In MAAT, δ13C reaches positive values during the main phase of the OD, so a minimal contribution of pedogenic carbon or extreme CO2 degassing during that time is expected on account of the cold conditions.
We propose that the spike of 6.1‰ in δ13C from 18.13 to 17.88 ka is due to the decay of vegetation and soil productivity in a context of extremely cold temperatures, thus reflecting the onset of the OD. Whereas the hydrological proxies (δ18O and trace metals) suggest a turn into dry conditions at that time, it seems that it is not of enough magnitude to explain such a dramatic decay into high δ13C. Hence, the most likely interpretation for such decay is the drop in temperature, in agreement with the arrival of cold conditions in oceanic records (Sierro et al., Reference Sierro, Hodell, Curtis, Flores, Reguera, Colmenero-Hidalgo and Bárcena2005; Martrat et al., Reference Martrat, Grimalt, Shackleton, de Abreu, Hutterli and Stocker2007). It is worth noting that in semiarid regions, precipitation is usually expected to be a major factor limiting vegetation productivity (see Ait Brahim et al., Reference Ait Brahim, Cheng, Sifeddine, Wassenburg, Cruz, Khodri and Sha2017); during the OD, the MAAT record seems mostly conditioned by the cold temperatures instead.
Atlantic versus Mediterranean influences in Iberia: two sides of the same coin
The multiple factors influencing δ18O in the hydrological cycle (Lachniet, Reference Lachniet2009) usually complicate an unambiguous interpretation of its climatic significance in stalagmites (Genty et al., Reference Genty, Blamart, Ghaleb, Plagnes, Causse, Bakalowicz, Zouari, Chkir, Hellstrom and Wainer2006, Reference Genty, Combourieu-Nebout, Peyron, Blamart, Wainer, Mansuri and Ghaleb2010; Fleitmann et al., Reference Fleitmann, Cheng, Badertscher, Edwards, Mudelsee, Göktürk and Fankhauser2009; Scholz et al., Reference Scholz, Frisia, Borsato, Spötl, Fohlmeister, Mudelsee, Miorandi and Mangini2012; Moreno et al., Reference Moreno, Pérez-Mejías, Bartolomé, Sancho, Cacho, Stoll, Delgado-Huertas, Hellstrom, Edwards and Cheng2017; Pérez-Mejías et al., Reference Pérez-Mejías, Moreno, Sancho, Bartolomé, Stoll, Cacho, Cheng and Edwards2017; Lechleitner et al., Reference Lechleitner, Amirnezhad-Mozhdehi, Columbu, Comas-Bru, Labuhn, Pérez-Mejías and Rehfeld2018). This fact acquires particular relevance in Iberia, a territory with a great diversity of climates close to one another and under the influence of two different regimes: the Atlantic and Mediterranean. Hence, some concrete geographical constraints might tilt the balance favoring a determinate parameter (e.g., temperature, amount of rainfall, changes in seasonality) to be dominant in δ18O variability. Studies of stalagmites from Iberia reveal that the role of such parameters influencing δ18O vary temporally as a response to long-term processes (e.g., ice volume, insolation) as well as abrupt ones (e.g., meltwater outburst during a glacial termination) (Pérez-Mejías et al., Reference Pérez-Mejías, Moreno, Sancho, Bartolomé, Stoll, Cacho, Cheng and Edwards2017, Reference Pérez-Mejías, Moreno, Sancho, Martín-García, Spötl, Cacho, Cheng and Edwards2019).
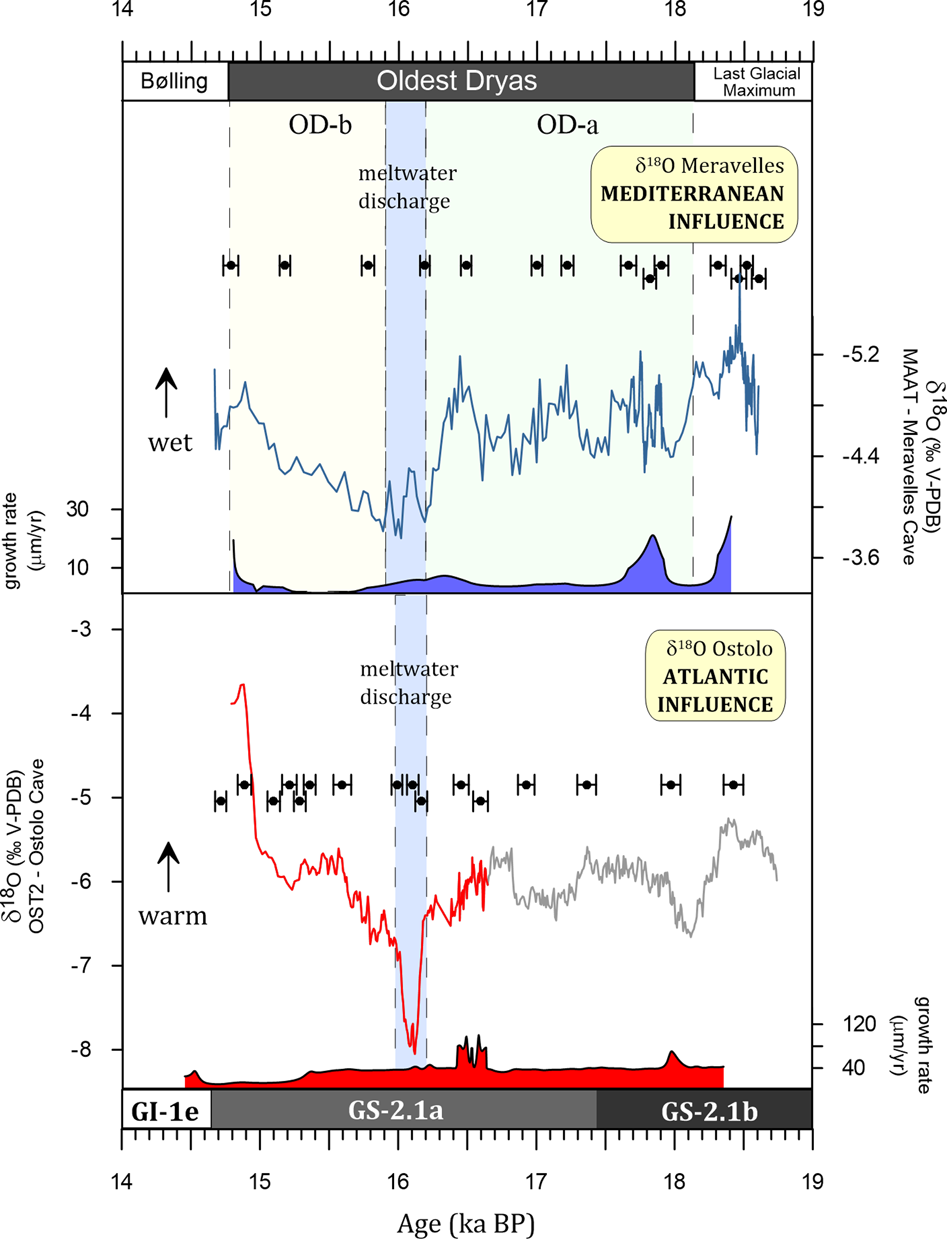
In an attempt to disentangle Atlantic versus Mediterranean influences in Iberian records, it is helpful to compare MAAT with the contemporary speleothem record of OST-2 from Ostolo cave in northern Spain, which is under clear Atlantic influence (Figs. 1, 4). For instance, while hydrological availability is the factor that seems to drive the δ18O variability of MAAT, it contrasts with the dominance of surface air temperature changes in the δ18O of OST-2, as seen in the pronounced jump to higher δ18O at the onset of the Bølling period (Fig. 4). OST-2 and MAAT records are inversely correlated (note the reversal axis in MAAT, Fig. 4), suggesting coeval changes related to temperature in the former and hydrology in the latter. A clear trend toward a cold (OST-2) and dry (MAAT) climate from 16.4 to 16.0 ka is noteworthy, whereas mild (OST-2) and more humid (MAAT) conditions are inferred from 15.9 to 14.7 ka. This example illustrates the complexities inherent in δ18O interpretation in speleothems from this area; Meravelles and Ostolo caves are only about 325 km apart but are in different geographical settings and thus have a different δ18O response to climatic parameters.
Comparison of MAAT (Meravelles cave; this study) (top) and OST-2 (Ostolo cave) (bottom) records showing δ18O of MAAT (reversed axis) and growth rate (blue) and δ18O of OST-2 and growth rate (red) (Bernal-Wormull et al., Reference Bernal-Wormull, Moreno, Pérez-Mejías, Bartolomé, Aranburu, Arriolabengoa and Iriarteunder review). 230Th dates with uncertainties are also indicated. The chronology of Oldest Dryas (OD)-a and OD-b is based on MAAT; Greenland Interstadial (GI)-1e and Greenland Stadial (GS)-2.1a and GS-2.1b are based on INTIMATE chronology (Rasmussen et al., Reference Rasmussen, Bigler, Blockley, Blunier, Buchardt, Clausen and Cvijanovic2014). The onset of OD-a is established at 18.13 ka, since it represents the beginning of the pronounced trend into higher δ13C values. (For interpretation of the references to color in this figure legend, the reader is referred to the web version of this article.)

Therefore, the present data suggest that the OD signal in terrestrial Iberia follows a pattern of mild temperatures in locations under Atlantic influence, while wet conditions are seen in Mediterranean areas. Likewise, when cold temperatures prevail in Atlantic areas, a trend to dryness spreads in the Mediterranean. It should be noted the heterogeneity of both climate regimes during the OD regarding to temperature and hydrology. Thus, the global picture of a homogeneous cold-dry OD throughout Iberia is not valid. Such a differentiation in the signals of speleothems may be of interest to other studies covering the last deglaciation in Iberia.
Furthermore, evidence of the change in δ18O of Atlantic seawater inferred from the δ18O of OST-2 at 16.2–15.9 ka (Fig. 4) is noticeable as a response to the iceberg discharge of HE-1. Similarly, we hypothesize that the excursion to lower values seen in the δ18O of MAAT at that time is also the consequence of such a dramatic event. The location of Meravelles cave near the Mediterranean Sea shows that the isotopic change seen in MAAT could respond to the propagation of 18O-depleted melting water through the Strait of Gibraltar to the western Mediterranean. Discarding other sources of freshwater fluxes, such as hypothetical enhanced river runoffs that are unlikely during this time, the peaks of low δ18O of MAAT are presumably explained by the entrance of freshened Atlantic water. Previous records from the Mediterranean Sea suggest the arrival of such fresh water during HE-1 (Sierro et al., Reference Sierro, Hodell, Curtis, Flores, Reguera, Colmenero-Hidalgo and Bárcena2005) and few millennia before with enhanced fluvial discharges from northern European glaciers (Bazzicalupo et al., Reference Bazzicalupo, Maiorano, Girone, Marino, Combourieu-Nebout and Incarbona2018; Ausín et al., Reference Ausín, Hodell, Cutmore and Eglinton2020). Likewise, taking into account the main assumption of δ18O controlled by hydrological availability, any hypothetical increase in humid conditions at that time is unlikely to explain such δ18O excursion, since it cannot be supported by trace-metal ratios or any other hydrological proxy.
The decrease of 0.42‰ in the δ18O of MAAT compared to the pronounced decrease of 1.65‰ in OST-2 attributed to meltwater discharge may be explained by the latter's geographical location near the Atlantic Ocean. Hence, it is less affected by fractionation processes that might increase with distance to the source area, and it is directly influenced by changes in the water composition of the ocean. Moreover, the change in the isotopic composition of Mediterranean seawater is mitigated by the mixing of preexisting waters between different seas, with the particularity that the Mediterranean is generally 18O-enriched because of higher evaporation. Quite illustrative in this respect is the higher δ18O in MAAT throughout the OD compared to OST-2 (Fig. 4), suggesting different origins of the main vapor source(s) besides the contrasted air temperature between both source areas, a factor inherent in the dissimilarities between the Atlantic and Mediterranean (Pérez-Mejías et al., Reference Pérez-Mejías, Moreno, Sancho, Bartolomé, Stoll, Osácar, Cacho and Delgado-Huertas2018).
Two stages in the Oldest Dryas
Based on the results of the MAAT record, we detect two different stages in the OD (OD-a from 18.13 to 16.17 ± 0.08 ka and OD-b from 15.89 to 14.81 ± 0.08 ka), supported by: (a) δ18O variability, (b) trace-metal profile, (c) changes in growth rate, and (d) statistical remarks and spectral analysis. The discharge of meltwater into the Atlantic associated with HE-1 exerts as a key event delimitating the transition between both stages.
During OD-a, the mean value for δ18O was −4.66‰, lower than −4.43‰ during OD-b. Likewise, alkaline earth metal ratios (Mg/Ca and Sr/Ca) exhibit lower values during OD-a and a subsequent clear trend to higher values (Fig. 3). Both δ18O and metal ratios suggest a common mechanism of hydrological changes behind the variability, with relatively humid conditions in OD-a and dryness during OD-b. This hypothesis is supported by the carbonate precipitation rate, with faster growth rates when water availability is higher.
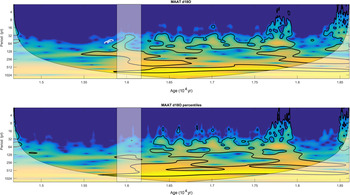
Statistical insights into the MAAT δ18O time series show a stationary behavior (i.e., with no trend) during OD-a, turning to nonstationary behavior after the change in oceanic δ18O due to the arrival of meltwater. Analyses of the frequencies show that the end of the multidecadal and multicentennial periodicities are found after the meltwater outburst (Fig. 5), these cycles were notably intense in frequencies of ~500 to 800 years. Similar ~500-year-cycles played an important role in the eastern Mediterranean and Asian summer monsoon intensity during the Holocene (Cheng et al., Reference Cheng, Sinha, Verheyden, Nader, Li, Zhang and Yin2015; Xu et al., Reference Xu, Lu, Chu, Liu, Shen, Li, Wang and Wu2019). Likewise, the frequencies in the range of ~250–350 years, intense during late OD-a, also came to an end (Fig. 5). If we convert the time series into percentiles, the end of the frequencies is rather abrupt, suggesting a linear response to climate (Grinsted et al., Reference Grinsted, Moore and Jevrejeva2004). Therefore, a reorganization of the oceanic currents and air masses in the Mediterranean seems to impact the cadence of rainfall in this area.
(color online) Analysis of frequencies of the MAAT δ18O record through the Morlet continuous wavelet using absolute values (top) and percentiles (bottom). The cone of influence and the period of meltwater discharge following the chronology of the present record are also indicated.

In the absence of a clear delimitation between phases, other records in northern Iberia suggest cold/dry conditions during the OD, but some of them lack a resolution good enough to explore any heterogeneous pattern and/or are under persistent climatic conditions due to the high altitude. Some examples of such conditions can be found in lake sequences from northern Iberia, with the development of steppic communities dominated by Artemisia and a decrease in Pinus percentages that characterizes La Mata sequence, Cantabrian range (Jalut et al., Reference Jalut, Turu i Michels, Dedoubat, Otto, Ezquerra, Fontugne and Belet2010), whereas a replacement of Juniperus by Artemisia was detected in El Portalet in the Pyrenees (González-Sampériz et al., Reference González-Sampériz, Valero-Garcés, Moreno, Jalut, García-Ruiz, Martí-Bono, Delgado-Huertas, Navas, Otto and Dedoubat2006).
In central Iberia, Fuentillejo maar—also a lacustrine record—was characterized by much detrital input and erosion, low lake level, low organic productivity, and high Juniperus content (Vegas et al., Reference Vegas, Ruiz-Zapata, Ortiz, Galán, Torres, García-Cortés, Gil-García, Pérez-González and Gallardo-Millán2010). The retreat of tree species and the development of nonarboreal species is clearly also seen in southern Iberia, inferred from the Padul sequence (Ortiz et al., Reference Ortiz, Torres, Delgado, Llamas, Soler, Valle, Julià, Moreno and Díaz-Bautista2010). In addition, pollen recovered from Mediterranean marine cores offers additional evidence of the rise in steppe taxa and reduction in arboreal communities in this area, such as the Alborán Sea (Sánchez Goñi et al., Reference Sánchez Goñi, Eynaud, Turon and Shackleton1999, Reference Sánchez Goñi, Cacho, Turon, Guiot, Sierro, Peypouquet, Grimalt and Shackleton2002; Combourieu Nebout et al., Reference Combourieu Nebout, Turon, Zahn, Capotondi, Londeix and Pahnke2002, Reference Combourieu Nebout, Peyron, Dormoy, Desprat, Beaudouin, Kotthoff and Marret2009; Fletcher and Sánchez Goñi, Reference Fletcher and Sánchez Goñi2008) and the Gulf of Lions (Beaudouin et al., Reference Beaudouin, Jouet, Suc, Berné and Escarguel2007). The replacement of tree species by steppe taxa has been used to model climate conditions at that time (Kageyama et al., Reference Kageyama, Combourieu Nebout, Sepulchre, Peyron, Krinner, Ramstein and Cazet2005), and it has also resulted in modeling studies of vegetation types covering the whole of Iberia during the OD (Ludwig et al., Reference Ludwig, Shao, Kehl and Weniger2018). Interestingly, the model of Ludwig et al. (Reference Ludwig, Shao, Kehl and Weniger2018) infer dry conditions in southern Iberia in contraposition to the north, a hypothesis going in the same line of proxy data and results presented here.
A close comparison with the absolute-dated speleothem record from Ostolo cave prevents any consideration about two stages in that cave with the present data (Fig. 4). Firstly, the growth rate declines in OST-2 at ~15.3 ka, which is later than the decline seen in MAAT δ18O just after the meltwater discharge. Secondly, the OST-2 chronology is not well constrained prior to 16.6 ka (corresponding mostly to OD-a; see Fig. 4, gray color), so it is not possible to assess comparisons during that period. More illustrative in discerning two phases is Estanya Lake in the Pre-Pyrenees (Fig. 1), where a significant change into a more positive water balance was identified from 17.3 to 16.2 ka (Morellón et al., Reference Morellón, Valero-Garcés, Vegas-Vilarrúbia, González-Sampériz, Romero, Delgado-Huertas, Mata, Moreno, Rico and Corella2009), in agreement with more water availability identified in MAAT during OD-a. Besides, the demise of the positive water balance is rather abrupt, coinciding with HE-1 (Morellón et al., Reference Morellón, Valero-Garcés, Vegas-Vilarrúbia, González-Sampériz, Romero, Delgado-Huertas, Mata, Moreno, Rico and Corella2009) and matching the expansion of Artemisia in the Pyrenees (González-Sampériz et al., Reference González-Sampériz, Valero-Garcés, Moreno, Jalut, García-Ruiz, Martí-Bono, Delgado-Huertas, Navas, Otto and Dedoubat2006).
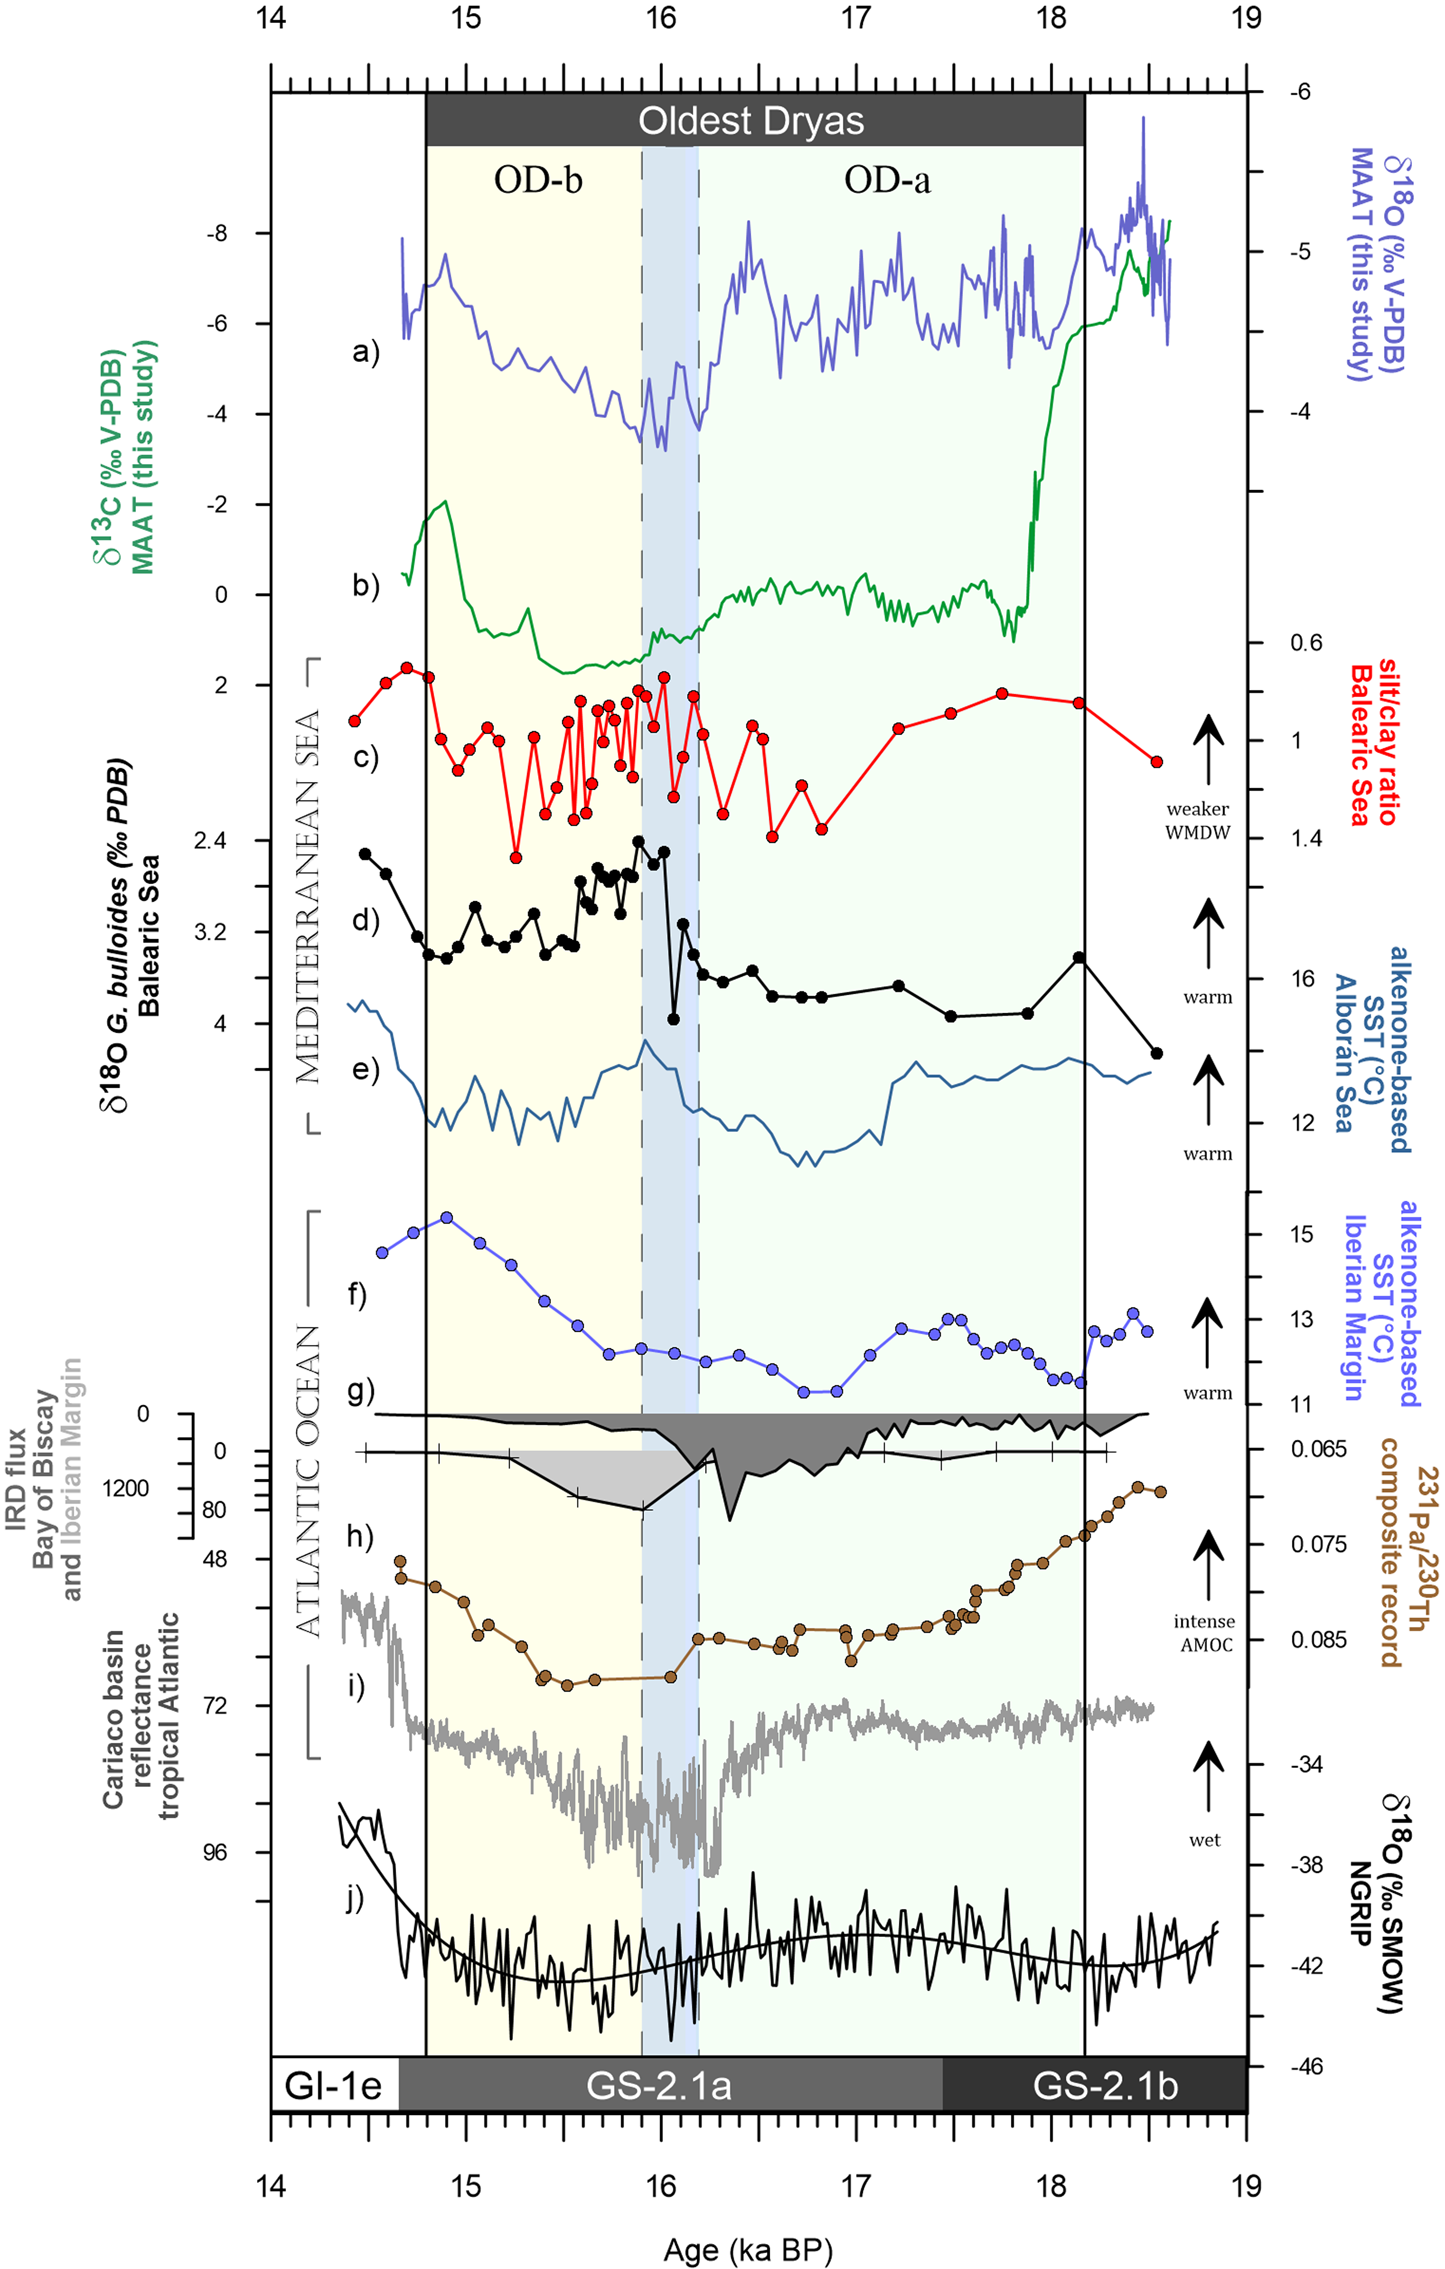
The two hydrological phases of the present record (Fig. 6a, b) are in agreement with those proposed in pollen records from the MD99-2331 and MD03-2697 marine cores from the Iberian margin (Naughton et al., Reference Naughton, Sánchez Goñi, Kageyama, Bard, Duprat, Cortijo and Desprat2009). While the old part of the stadial is dominated by forest regression and the expansion of Calluna vulgaris and Isoetes fern (humid), the second stage shows an increase in semidesert plants (e.g., Artemisia) (dry) (Naughton et al., Reference Naughton, Sánchez Goñi, Desprat, Turon, Duprat, Malaize, Joli, Cortijo, Drago and Freitas2007). Along the same lines, such delimitation applies if we look at the temperature. The first phase is dominated by cold conditions by means of heavy δ18O values of Globigerina bulloides, an increase in Neogloboquadrina. pachyderma (s.), a Pinus contraction, a decrease in sea surface temperatures, and an absence of IRD. The second phase is characterized by light δ18O values of planktic foraminifera, Pinus expansion, and the presence of IRD, evidencing less cold conditions and iceberg melting in the Iberian margin (Bard et al., Reference Bard, Rostek, Turon and Gendreau2000; Naughton et al., Reference Naughton, Sánchez Goñi, Kageyama, Bard, Duprat, Cortijo and Desprat2009). In the Mediterranean Sea, data from foraminifera and sedimentological proxies from the MD99-2343 core (Balearic Sea) also suggest different stages (Fig. 6c, d). The first stage is characterized by an increased silt/clay ratio and a higher δ18O of G. bulloides, signaling a weaker western Mediterranean deep water and cold conditions; the second stage presents lower silt/clay ratio and a decrease in the δ18O of G. bulloides, reflecting a stronger western Mediterranean deep water and warmer conditions (Sierro et al., Reference Sierro, Hodell, Curtis, Flores, Reguera, Colmenero-Hidalgo and Bárcena2005; Frigola et al., Reference Frigola, Moreno, Cacho, Canals, Sierro, Flores and Grimalt2008). Deep water sources in the Gulf of Lion depend mainly on wind variability and fluvial water discharges (Frigola et al., Reference Frigola, Moreno, Cacho, Canals, Sierro, Flores and Grimalt2008).
Comparison of global records from the Mediterranean and Atlantic realms. From top to bottom: (a) δ18O of MAAT (blue) (this study) (reversed axis). (b) δ13C of MAAT (green) (this study). (c) Silt/clay ratio of the noncarbonate fraction from core MD99-2343 (red) (Frigola et al., Reference Frigola, Moreno, Cacho, Canals, Sierro, Flores and Grimalt2008). (d) δ18O of Globigerina bulloides from core MD99-2343 (black) (Sierro et al., Reference Sierro, Hodell, Curtis, Flores, Reguera, Colmenero-Hidalgo and Bárcena2005). (e) Alkenone-based sea surface temperature reconstruction from core ODP-976 (blue) (Martrat et al., Reference Martrat, Jimenez-Amat, Zahn and Grimalt2014). (f) Alkenone-based sea surface temperature from core MD01-2444 (blue) (Martrat et al., Reference Martrat, Grimalt, Shackleton, de Abreu, Hutterli and Stocker2007). (g) Ice-rafted debris flux (>150 μm, %) from cores MD95-2002 (Eynaud et al., Reference Eynaud, Malaizé, Zaragosi, de Vernal, Scourse, Pujol and Cortijo2012) (g/cm2/ka) and SU81-18 (gray) (Bard et al., Reference Bard, Rostek, Turon and Gendreau2000). (h) 231Pa/230Th composite record (brown) (Ng et al., Reference Ng, Robinson, McManus, Mohamed, Jacobel, Ivanovic, Gregoire and Chen2018). (i) Reflectance in the Cariaco basin (gray) (Deplazes et al., Reference Deplazes, Lückge, Peterson, Timmermann, Hamann, Hughen and Röhl2013). (j) δ18O of NGRIP (black) (North Greenland Ice Core Project Members, 2004; Rasmussen et al., Reference Rasmussen, Bigler, Blockley, Blunier, Buchardt, Clausen and Cvijanovic2014). The chronology of the OD, OD-a, and OD-b (top part) is based on the MAAT record; GI-1e, GS-2.1a, and GS-2.1b (bottom part) are based on INTIMATE chronology (Rasmussen et al., Reference Rasmussen, Bigler, Blockley, Blunier, Buchardt, Clausen and Cvijanovic2014). (For interpretation of the references to color in this figure legend, the reader is referred to the web version of this article.)

In sum, the presented results, together with comparisons with many other regional marine records, suggest that the two-phase pattern in the OD seen in MAAT appears to occur synchronously despite the age model uncertainties in these marine records. Although most records (preferentially from the south) suggest dry conditions during the OD, our record implies relatively humid conditions, at least during most of OD-a. Humid conditions have also been proposed in other parts of northern Iberia, such as in the northwest (Naughton et al., Reference Naughton, Sánchez Goñi, Kageyama, Bard, Duprat, Cortijo and Desprat2009) and northeast (Morellón et al., Reference Morellón, Valero-Garcés, Vegas-Vilarrúbia, González-Sampériz, Romero, Delgado-Huertas, Mata, Moreno, Rico and Corella2009). Such areas match those occupied by hunter-gatherers, as inferred from the available archaeological sites. They were concentrated along the northern and eastern Iberian coast, in contrast to the south that probably was under persistent drought conditions at that time (Ludwig et al., Reference Ludwig, Shao, Kehl and Weniger2018; Weniger et al., Reference Weniger, de Andrés-Herrero, Bolin, Kehl, Otto, Potì and Tafelmaier2019).
Timing of the deglaciation in Iberia
The onset of HS-1 cannot be understood without invoking the sequence of events that happened since the end of the last glacial maximum. At ~20–18 ka, the ice retreat induced by warming started in Fennoscandia, with the consequence of enhanced freshwater fluxes into the North Atlantic, provoking a sea level rise of approximately 2 m in the Nordic Seas (Álvarez-Solas et al., Reference Álvarez-Solas, Montoya, Ritz, Ramstein, Charbit, Dumas, Nisancioglu, Dokken and Ganopolski2011). The discharges of the Fleuve Manche paleoriver, interpreted by means of turbidite deposits, increased drastically at ~18.3 ka and were clearly more intense compared to the beginning of the deglaciation at ~20 ka (Toucanne et al., Reference Toucanne, Zaragosi, Bourillet, Naughton, Cremer, Eynaud and Dennielou2008). Such freshwater fluxes turn the ocean into a new state of weakened AMOC that precipitates the onset of HS-1 (Denton et al., Reference Denton, Anderson, Toggweiler, Edwards, Schaefer and Putnam2010; Álvarez-Solas et al., Reference Álvarez-Solas, Montoya, Ritz, Ramstein, Charbit, Dumas, Nisancioglu, Dokken and Ganopolski2011).
In that context, MAAT δ13C starts a pronounced increase from 18.2 ka onward (Fig. 6b), thus establishing the beginning of the OD in this area. This continental response to stadial conditions is contemporaneous with the marine realm, with a decrease in the sea surface temperatures seen in the alkenone-based temperature record of the Iberian margin (Fig. 6f) and in the δ18O of the G. bulloides in the Balearic Sea (Fig. 6d). The date proposed for the beginning of the OD matches the onset of the retreat of the Scandinavian ice sheet and related freshwater inputs in the North Atlantic (Toucanne et al., Reference Toucanne, Soulet, Freslon, Silva Jacinto, Dennielou, Zaragosi, Eynaud, Bourillet and Bayon2015).
The AMOC weakening occurs during 18–17.5 ka, although it was not of enough magnitude to reach a collapse or near-collapse state (Ivanovic et al., Reference Ivanovic, Gregoire, Burke, Wickert, Valdes, Ng and Robinson2018). In that time interval, a gradual warming is seen in the Iberian margin (Fig. 6f), the western Mediterranean (Cacho et al., Reference Cacho, Grimalt, Pelejero, Canals, Sierro, Flores and Shackleton1999, Reference Cacho, Grimalt, Canals, Sbaffi, Shackleton, Schönfeld and Zahn2001), and in the subtropical North Atlantic at ~17.5 ka (Chapman et al., Reference Chapman, Shackleton, Zhao and Eglinton1996). At the same time, widespread glacial retreats are accounted for globally (Stanford et al., Reference Stanford, Rohling, Bacon, Roberts, Grousset and Bolshaw2011), regionally consistent with the high turbidite activity reported in the Iberian margin (Lebreiro et al., Reference Lebreiro, Voelker, Vizcaino, Abrantes, Alt-Epping, Jung, Thouveny and Gràcia2009). Tentatively, such mild conditions are marked by the excursion to lower δ13C values in MAAT that peak at 17.6 ka.
Around 17 ka, lower sea surface temperatures are seen in the Iberian margin and Alborán Sea (Fig. 6e, f), and an increase of silt/clay ratio is seen in the Balearic Sea (Fig 6c), attributed to enhanced deep currents from the Gulf of Lions that are able to transport coarse material to the Minorca sediment drift (Frigola et al., Reference Frigola, Moreno, Cacho, Canals, Sierro, Flores and Grimalt2008). These currents are associated with the degree of generation of the western Mediterranean Deep Water, a process triggered by the cool northwesterly winds that occurs mainly during winter (Sierro et al., Reference Sierro, Hodell, Curtis, Flores, Reguera, Colmenero-Hidalgo and Bárcena2005). Model simulations provide evidence for an altered atmospheric circulation regime since the last glacial maximum, characterized by a stronger, more zonally oriented Atlantic jet and reduced storminess (Li and Battisti, Reference Li and Battisti2008). While the silt/clay ratio suggests a weaker western Mediterranean Deep Water since 18.2 ka, the change at ~17 ka, coeval with the trend to cold conditions, would be consistent with a southward migration of the polar jet. This hypothesis is supported by the aeolian activity reported from dune fields along the central coast of Portugal, with maximum activity peaks at 17.5 ± 1.0 ka related to the shift of the storm track toward lower latitudes (Costas et al., Reference Costas, Naughton, Goble and Renssen2016). The cold conditions and migration of the polar jet are in agreement with the AMOC slowdown accounted at higher latitudes during that time (McManus et al., Reference McManus, Francois, Gherardi, Keigwin and Brown-Leger2004; Stanford et al., Reference Stanford, Rohling, Hunter, Roberts, Rasmussen, Bard, McManus and Fairbanks2006). Likewise, the resultant higher atmospheric pressure gradient and the southward displacement of the subtropical gyre explain enhanced westerlies (Repschläger et al., Reference Repschläger, Weinelt, Kinkel, Andersen, Garbe-Schönberg and Schwab2015). This scenario implies that a substantial amount of precipitation could be brought to Iberia by the westerlies, especially during winter (Cortesi et al., Reference Cortesi, Gonzalez-Hidalgo, Trigo and Ramos2014). It is worth noting that the shift in the regime of the westerlies seems not to be recorded in the MAAT record; no change is observed at that time, suggesting that the rainfall source in the study area is mostly independent of the westerlies’ regime. This consideration reinforces the Mediterranean influence in the present record.
The temperatures were still low at ~16.5 ka, with a chironomid-based reconstruction of a mean temperature for July of 10°C at Origlio Lake in the southern Alps, which is 10°C cooler than today (Samartin et al., Reference Samartin, Heiri, Lotter and Tinner2012). The pattern of cold sea surface temperatures and a weaker western Mediterranean Deep Water lasts until the occurrence of the main discharge of icebergs during HE-1 (Fig. 6c), dated by the anomalies in the δ18O of MAAT and tentatively delimitated at 16.17–15.89 ka, in agreement with the timing in the Ostolo record (Fig. 4). Two main discharges of IRD were identified in the Iberian margin during HS-1; the first occurred at ~17.5–17 ka, whereas the second spike of larger intensity was found at ~16 ka (Fig. 6g). Similarly, iceberg discharges in the Bay of Biscay are distributed between 17 and 16 ka (Fig. 6g). In general, the flux of icebergs is much lower in this area compared with other locations such as the IRD belt (Bard et al., Reference Bard, Rostek, Turon and Gendreau2000; McManus et al., Reference McManus, Francois, Gherardi, Keigwin and Brown-Leger2004). In addition, it is worth noting the different origins of the IRD between the episodes of discharges, as was interpreted from the analysis of the debris and its different magnetic susceptibility peaks (Thouveny et al., Reference Thouveny, Carcaillet, Moreno, Leduc and Nérini2004). The old peak of IRD at ~17.5 ka is mainly composed of detrital carbonates, whereas the main peak at ~16 ka is composed of haematite-coated grains, suggesting a Laurentide origin for the former and a European origin for the latter (Bard et al., Reference Bard, Rostek, Turon and Gendreau2000). Recently, Hodell et al. (Reference Hodell, Nicholl, Bontognali, Danino, Dorador, Dowdeswell and Einsle2017) suggested a younger age for the older episode of discharges identified in Bard et al. (Reference Bard, Rostek, Turon and Gendreau2000), where reservoir ages were not properly corrected.
Heinrich events did not occur until the AMOC was at its weakest state, and subsurface temperatures were near their maximum (Marcott et al., Reference Marcott, Clark, Padman, Klinkhammer, Springer, Liu and Otto-Bliesner2011). During the main phase of IRD discharges of HE-1, the AMOC in the North Atlantic was already weakened (Fig. 6h). The large volume of melting water from the icebergs entered the Mediterranean, decreasing its salinity and reducing its thermohaline circulation in less than 1000 years (Sierro et al., Reference Sierro, Hodell, Curtis, Flores, Reguera, Colmenero-Hidalgo and Bárcena2005). Such an event might have triggered the disruption of the patterns of precipitation in eastern Iberia interpreted from the analysis of δ18O frequencies (Fig. 5).
The stable signal seen in the δ13C of MAAT during HE-1 that interrupted a long trend to higher values (Fig. 6b), suggesting mild conditions, coincides with a sudden warming in the Alborán Sea (approximately 4°C) and Iberian margin (Fig. 6e) and a weaker western Mediterranean Deep Water (Fig. 6c). The pattern of warming in our latitude contrasts with the cooling and sea ice expansion seen in North Atlantic higher latitudes (Hodell et al., Reference Hodell, Nicholl, Bontognali, Danino, Dorador, Dowdeswell and Einsle2017). Similar mid-Heinrich stadial warming events have been reported from the marine realm during HS-5 and HS-4, by means of sea surface temperatures in the Iberian margin and Mediterranean planktonic δ18O (Skinner and Elderfield, Reference Skinner and Elderfield2007).
Modeling results suggest that the expansion of the subtropical gyre explains the warming in the North Atlantic mid-latitudes, whereas the northern North Atlantic cools due to the massive input of icebergs and meltwater (Naafs et al., Reference Naafs, Hefter, Grützner and Stein2013). Such expansion of the subtropical gyre northward during Heinrich events would be the response to the enhanced wind stress and weakening of the subpolar gyre with the southward expansion of sea ice (Renold et al., Reference Renold, Raible, Yoshimori and Stocker2010). Hence, the North Atlantic surface water exhibits a different temperature pattern during Heinrich events, with cool waters reaching the center of the IRD belt; a warming is seen at the southern end, referred to as a seesaw pattern in sea surface temperatures between mid-latitude and northern North Atlantic (Naafs et al., Reference Naafs, Hefter, Grützner and Stein2013).
Most European records infer relatively warmer conditions at ~16 ka. Stalagmites from Villars and Chauvet caves in southern France started to grow synchronously at 15.9 ± 0.5 ka, suggesting climatic conditions that favor carbonate precipitation (Genty et al., Reference Genty, Blamart, Ghaleb, Plagnes, Causse, Bakalowicz, Zouari, Chkir, Hellstrom and Wainer2006). Forest expansion has been reported south of the Alps at ~16 ka (Hofstetter et al., Reference Hofstetter, Tinner, Valsecchi, Carraro and Conedera2006; Vescovi et al., Reference Vescovi, Ravazzi, Arpenti, Finsinger, Pini, Valesecchi, Wick, Ammann and Tinner2007) and in Italy (Wick, Reference Wick2004; Finsinger et al., Reference Finsinger, Tinner, van der Knaap and Ammann2006), suggesting afforestation more than a millennium before the Bølling period. The warm conditions at ~15.9–15.8 ka propagated rapidly eastward, with a reinforced Indian summer monsoon (Lechleitner et al., Reference Lechleitner, Breitenbach, Cheng, Plessen, Rehfeld, Goswami, Marwan, Eroglu, Adkins and Haug2017) and eastern Asia summer monsoon (Wang et al., Reference Wang, Cheng, Edwards, An, Wu, Shen and Dorale2001; Cheng et al., Reference Cheng, Edwards, Broecker, Denton, Kong, Wang, Zhang and Wang2009). In contrast, this warming has not been reported in sequences from the northern Alps (von Grafenstein et al., Reference von Grafenstein, Erlenkeuser, Brauer, Jouzel and Johnsen1999), suggesting that the afforestation in that area did not start before the Bølling period (Litt et al., Reference Litt, Brauer, Goslar, Merkt, Balaga, Müller, Ralska-Jasiewiczowa, Stebich and Negendank2001).
The last episode of ice sheet retreat of the deglaciation in Europe was recorded from 16 to 14 ka (Toucanne et al., Reference Toucanne, Zaragosi, Bourillet, Naughton, Cremer, Eynaud and Dennielou2008). The gradual trend during this period, as seen in lower δ18O and δ13C values in MAAT, coincides with a warming of sea surface temperatures from the Iberian margin (Fig. 6f), akin to the tropical Atlantic pattern inferred from the Cariaco basin sediment record (Fig. 6i). In contrast, the Mediterranean exhibits a cessation of gradual warming at ~15.6 ka, as recorded in the Alborán and Balearic Seas, with cold conditions that lasted until the onset of the Bølling (Fig. 6d, e). During that time, the AMOC keeps being disrupted (Fig. 6g), and its resumption coincides with the Bølling warming rather than with the end of the iceberg discharges (Stanford et al., Reference Stanford, Rohling, Bacon, Roberts, Grousset and Bolshaw2011). Similarly, Greenland ice cores exhibit cold conditions during the same time, a trend that starts declining at ~15.2 ka until the sharp increase in temperature that occurs at 14.7 ka (Fig. 6j).
CONCLUSIONS
This study presents the first speleothem from Europe that records vegetation changes and rainfall patterns during the full duration of the OD, the counterpart of HS-1 in the terrestrial record. This absolute-dated record provides ages for two key events throughout the OD: (1) the onset of cold conditions that triggered the decay of vegetation dated to 18.13 ± 0.08 ka, and (2) the discharge of icebergs during HE-1, as inferred from δ18O anomalies and dated from 16.17 to 15.89 ka.
The hydrological proxies of this record (δ18O, Mg/Ca, and Sr/Ca) and the growth rate suggest a two-step evolution throughout the OD, separated by the period when meltwater mixing occurred from 16.17 to 15.89 ka. The stages are: (1) OD-a, 18.13–16.17 ka, characterized by wet conditions and a faster growth rate; and (2) OD-b, 15.89–14.81 ka, characterized by dryness and a slower growth rate. Such release of fresh water is attributed to have somehow triggered the disruption in rainfall patterns in the eastern Iberian Peninsula during that time, as was interpreted from the cessation of multidecadal and multicentennial rainfall frequencies. Our hydrological reconstruction, characterized by relatively humid conditions in this sector during most of the OD, together with those made in other studies in northwestern and northeastern Iberia, matches the occupation of hunter-gatherers during that time, as inferred from the available archaeological sites.
ACKNOWLEDGMENTS
We acknowledge funding received from NSFC 41888101 to Cheng and Pérez-Mejías; NSF grant 1702816 to Lawrence Edwards and Cheng; and CGL2016-77479-R (SPYRIT) and CTM2016-75411-R (CHIMERA) to Moreno and Cacho, respectively. The authors would like to acknowledge the use of Servicio General de Apoyo a la Investigación-SAI, University of Zaragoza, and the help of all those involved during the field work. This is a contribution of the research groups “Procesos geoambientales y cambio global” (E02_17R) and “Geotransfer” (E32_17R and E32_20R) from the Aragón Government, Pyrenean Institute of Ecology, and University of Zaragoza. We thank the senior editor, Lewis Owen, the guest editor, Dominik Faust, and the two anonymous reviewers for the constructive comments that improved the manuscript.