Introduction
Many species and higher taxa exhibit biogeographic variation in size and shape. Several patterns of variation are sufficiently prevalent that they have been named, including Bergmann’s rule, Allen’s rule, and the island rule. Geographic variation in morphology is important to ecologists and evolutionary biologists because it can be used to identify the ecological and physiological processes that shape both biogeographic and macroevolutionary patterns. Among these potential physiological controls are metabolic rate, generation time, life span, geographic range, and population size (Peters Reference Peters1983; Brown Reference Brown1995). Indeed, paleontologists often study spatial variation in diversity and biological traits in the modern to better understand and interpret evolutionary change in the fossil record, substituting space for time (Jablonski Reference Jablonski1993; Roy et al. Reference Roy, Jablonski and Martien2000; Hadly and Maurer Reference Hadly and Maurer2001; Buzas et al. Reference Buzas, Collins and Culver2002; Hunt and Roy Reference Hunt and Roy2006). Although not unique to the group, the vast majority of the observations upon which these ecological generalizations were built stem from studies of terrestrial mammals (Gould Reference Gould1997).
Patterns of biogeographic variation in organism size and shape occur both on land and in the sea. Terrestrial mammals broadly follow Bergmann’s rule, exhibiting larger sizes at higher latitudes and cooler temperatures (Ashton et al. Reference Ashton, Tracy and de Queiroz2000; Millien et al. Reference Millien, Lyons, Olson, Smith, Wilson and Yom-Tov2006). Similarly, modern ostracodes tend to be larger in the colder parts of their geographic range (Hunt and Roy Reference Hunt and Roy2006; Hunt et al. Reference Hunt, Wicaksono, Brown and MacLeod2010). Although enhanced body heat retention in mammals has often been invoked to explain Bergmann’s rule (Mayr Reference Mayr1963), albeit controversially (Ashton et al. Reference Ashton, Tracy and de Queiroz2000), this explanation cannot hold for ectotherms. Deep-sea gastropod species tend to converge on an intermediate, and potentially optimal, body size with increasing water depth, leading to the hypothesis that evolutionary dynamics in the deep sea behave similarly to those of island systems (McClain et al. Reference McClain, Boyer and Rosenberg2006). The island rule describes a convergence of large and small terrestrial organisms toward an intermediate and potentially physiological or developmentally optimal size as a function of resource limitation and release from predation pressures on islands relative to their mainland counterparts (Foster Reference Foster1964; Van Valen Reference Van Valen1973). Similar to the island biogeographic size hypothesis, extant terebratulid brachiopods decrease in size with increasing water depth, possibly reflecting resource limitation (Peck and Harper Reference Peck and Harper2010). There also exist exceptions to these biogeographic rules, such as the invariance of bivalve size distributions across latitude in the eastern Pacific (Roy et al. Reference Roy, Jablonski and Martien2000).
Despite the similarities in patterns, many examples of biogeographic variation in morphology in the marine realm result from different proximal environmental controls than those in terrestrial systems (Forster et al. Reference Forster, Hirst and Atkinson2012). For example, abalone size is inversely associated with water temperature, but this pattern has been attributed to higher rates of primary production in cold waters (Estes et al. Reference Estes, Lindberg and Wray2005). Similarly, the mean biomass of the marine invertebrate fauna decreases with water depth as a function of decreased supply of organic carbon to the deep sea (Rex et al. Reference Rex, Etter, Morris, Crouse, McClain, Johnson, Stuart, Deming, Thies and Avery2006). After controlling for water depth, the maximum size of deep-sea turrid gastropods increases as a function of increasing levels of dissolved oxygen (McClain and Rex Reference McClain and Rex2001). These different environmental explanations for size variation in the oceans highlight the complex nature of this environment.
Rather than one single oceanographic factor being responsible for shaping these spatial size trends, multiple factors might underlie them. A particular challenge for studies attempting to identify the controls on organismal morphology in the oceans is the covariation among environmental parameters, such as between temperature, dissolved oxygen concentration, and particulate organic carbon flux (Levin and Gage Reference Levin and Gage1998). Each of these oceanographic parameters influences metabolism, and thus each can also potentially constrain size and volume–to–surface area ratio (Gillooly et al. Reference Gillooly, Brown, West, Savage and Charnov2001). For example, a study of modern marine amphipod crustaceans attributes the positive correlation between body size and latitude to increased levels of dissolved oxygen in colder waters at higher latitudes (Chapelle and Peck Reference Chapelle and Peck1999). Alternatively, decreased food availability and increased costs of foraging in the cold, deep sea has been hypothesized to place constraints on the maximum size of marine mollusks (Rex and Etter Reference Rex and Etter1998; McClain et al. Reference McClain, Allen, Tittensor and Rex2012a). However, we are aware of no previous study that has analyzed spatial gradients in size while simultaneously assessing multiple environmental influences on physiology.
Benthic foraminifera are an ideal study group for investigating the influences of a number of oceanographic parameters on organism size and volume–to–surface area ratio. They are a diverse and abundant group of rhizarian protists possessing reticulose pseudopods and inhabiting nearly all marine environments. Most species produce mineralized shells (tests) that facilitate the analysis of cell morphology in both living and dead individuals. Moreover, within local environmental settings they vary in test morphology with fluctuations in particulate organic carbon flux (Corliss and Chen Reference Corliss and Chen1988; Jorissen et al. Reference Jorissen, de Stigter and Widmark1995) and oxygen concentration (Bernhard Reference Bernhard1986; Kaiho Reference Kaiho1999a,Reference Kaihob; Payne et al. Reference Payne, Groves, Jost, Nguyen, Moffitt, Hill and Skotheim2012a), but controls on continental-scale variation in size and volume–to–surface area ratio have yet to be assessed. In this study we evaluate the correspondence between modern benthic Rotallid foraminiferal test size and volume–to–surface area ratio from the North American continental margin and the oceanographic variables most frequently hypothesized to influence organism metabolism.
Methods
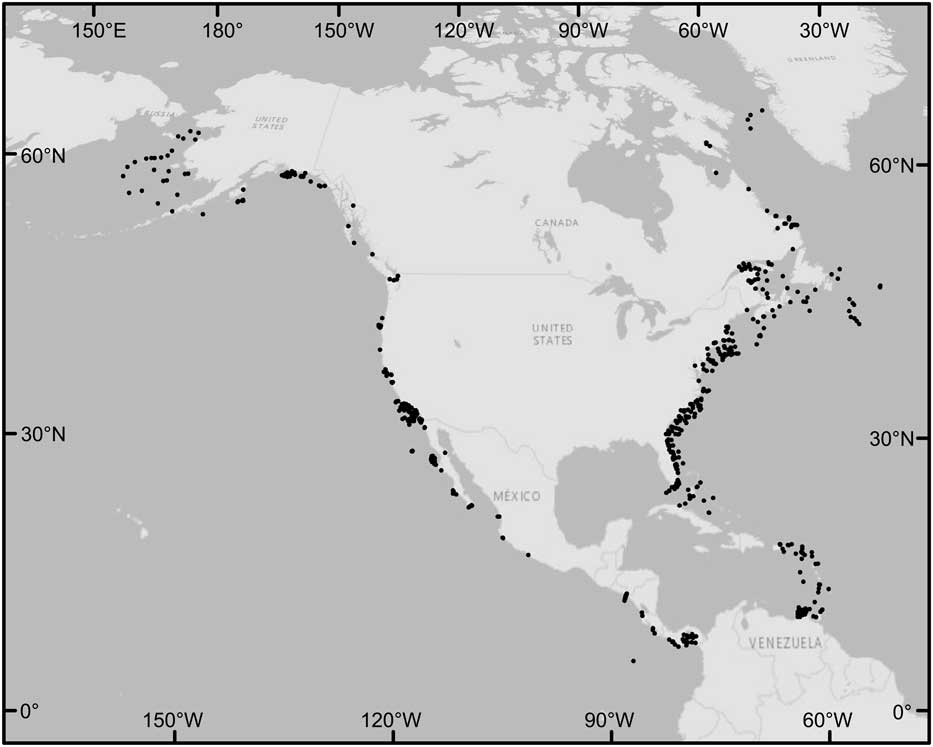
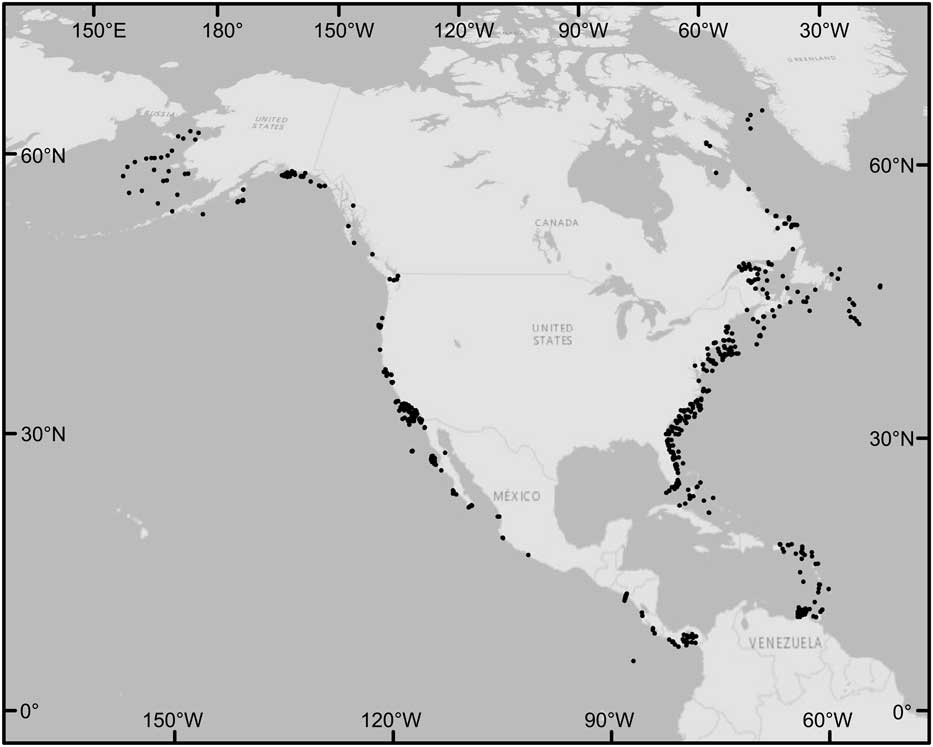
To determine the primary environmental controls on the size and volume–to–surface area ratio of benthic foraminifera across broad geographic scales, we combined data on test dimensions for 541 species of Rotallid foraminifera with occurrence data that span across 60 degrees of latitude and 1600 m of water depth around the North American continental margin. The foraminiferal order Rotaliida contains approximately one-third of extant foraminiferal genera (Schweizer et al. Reference Schweizer, Pawlowski, Kouwenhoven, Guiard and van der Zwaan2008). Our data set includes 7035 species occurrences from 946 unique localities for which we compiled corresponding mean annual values of temperature, dissolved oxygen concentration, particulate organic carbon (POC) flux, and calcite saturation state of seawater (Fig. 1).
Geographic distribution of Rotallid foraminiferal occurrences from the North American continental margin in the study data set. Each point on the map includes mean annual values of temperature, dissolved oxygen concentration, calcite saturation and POC flux, and a corresponding volume and surface area estimate for each foraminiferal species present. Points are transparent to indicate species sampling density.
Localities
We used occurrence data for recent benthic foraminiferal species on the North American continental margin compiled by Culver and Buzas (Reference Culver and Buzas1980, Reference Culver and Buzas1981, Reference Culver and Buzas1982, Reference Culver and Buzas1985, Reference Culver and Buzas1986, Reference Culver and Buzas1987; S. J. Culver and M. A. Buzas unpublished data) to establish the biogeographic distribution of species. We digitized the Culver and Buzas data set using the text-recognition software program ABBYY FineReader (2011). We determined the water depth for each locality by matching the reported latitudes and longitudes to the General Bathymetric Chart of the Oceans (GEBCO, Centenary Edition) global 30-arc second bathymetric grid (IOC, IHO, and BODC 2003) using ArcGIS Desktop 10.2 (Environmental Systems Research Institute 2011).
Morphology
We quantified species’ morphologies in two ways: test volume and volume–to–surface area ratio. We determined these values by measuring illustrations in the Catalogue of Foraminifera (Ellis and Messina 1940–Reference Ellis and Messina2006). This catalogue comprises taxonomic descriptions extracted from the primary literature and includes the associated illustrations. The Catalogue of Foraminifera typically depicts one specimen per species (i.e., holotype). In total, we were able to match 541 species with a size estimate based on the type specimen to their geographic occurrences in the Culver and Buzas data set. Because the vast majority of morphological variation in foraminifera is among species not within species (Rego et al. Reference Rego, Wang, Altiner and Payne2012), we used these data to identify patterns in the biogeographic distribution of test size and shape. To calculate test volume and surface area, we assumed that the test roughly approximates a three-dimensional ellipsoid. Following Payne et al. (Reference Payne, Groves, Jost, Nguyen, Moffitt, Hill and Skotheim2012a), we calculated volume as 4/3 · π · a · b · c and surface area as 4 · π · [( a z · b z + a z · c z + b z · c z ) / 3]1/z, where a, b, and c represent the radii and z=1.6075. Generalizing test morphology as a three-dimensional ellipsoid is not an important source of error on the data set because our size data span more than five orders of magnitude in (log10-transformed) biovolume, whereas errors introduced by approximations of cell shape are unlikely to yield more than 0.3 log10 (hereafter “log”) units of uncertainty. In the extreme case of using the generalized ellipsoid equation to determine the volume of a cube, the resulting error is less than 0.3 log-units difference. Although the cytoplasm of the foraminifera might not occupy the entire test (Gerlach et al. Reference Gerlach, Hahn and Schrage1985; Murray Reference Murray1991), the dimensions of the test are the best approach for estimating cell volume and volume–to–surface area ratio because expanded cell protoplasm can completely fill all the chambers of the test (Hohenegger and Briguglio Reference Hohenegger and Briguglio2014). Several studies of foraminiferal respiration rates estimate that the cell cytoplasm fills approximately 3/4 of the internal test volume (Hannah et al. Reference Hannah, Rogerson and Laybourn-Parry1994; Geslin et al. Reference Geslin, Risgaard-Petersen, Lombard, Metzger, Langlet and Jorissen2011), and the error introduced by using this estimation is less than 0.13 log units. As this appears to be a consistent source of bias with test size overestimating cytoplasm volume, this effect is expressed by changes in the intercept of the regression equations rather than in the slope. Because our interest is in the slope of these relationships, this consistent bias across all measurements is likely to have an even smaller effect on our results.
Oceanographic Data
We compiled data for four oceanographic parameters that could affect organism morphology through their effects on metabolic physiology. These parameters were temperature, dissolved oxygen concentration, the calcite saturation state of seawater, and POC flux to the seafloor. Because specific metabolic rate scales positively with temperature (Peters Reference Peters1983; Gillooly et al. Reference Gillooly, Brown, West, Savage and Charnov2001), test volume is expected to correlate inversely with ambient temperature (DeLong et al. Reference DeLong, Okie, Moses, Sibly and Brown2010). The vast majority of foraminiferal species are presumably primarily aerobes (e.g., Sen Gupta and Machain-Castillo Reference Sen Gupta and Machain-Castillo1993; Sen Gupta Reference Sen Gupta1999; Heinz and Geslin Reference Heinz and Geslin2012); thus, dissolved oxygen concentration in the ambient seawater can constrain overall size and the volume–to–surface area ratio of the cell. The flux of POC to the seafloor is an important nutrient resource for benthic life, and therefore the concentration of POC in the environment has the potential to limit the size of the foraminifer. Because Rotallid foraminifera use metabolic energy to secrete predominantly low-Mg calcite tests (Blackmon and Todd Reference Blackmon and Todd1959; Sen Gupta Reference Sen Gupta1999; Erez Reference Erez2003; Armstrong and Brasier Reference Armstrong and Brasier2005) and produce the associated organic matrix, the calcite saturation state of the ambient seawater would be expected to correlate positively with test volume (de Nooijer et al. Reference de Nooijer, Langer, Nehrke and Bijma2009).
We compiled mean annual temperature (Locarnini et al. Reference Locarnini, Mishonov, Antonov, Boyer, Garcia, Baranova, Zweng and Johnson2010), dissolved oxygen concentration (Garcia et al. Reference Garcia, Locarnini, Boyer, Antonov, Baranova, Zweng and Johnson2010), and salinity (Antonov et al. Reference Antonov, Seidov, Boyer, Locarnini, Mishonov, Garcia, Baranova, Zweng and Johnson2010) from the 2009 World Ocean Atlas for each locality by matching its unique latitude and longitude coordinates to the nearest environmental 1° grid point at the appropriate bathymetric depth; 1° is approximately 111 km. Although these environmental data were compiled during the early 2000s and data included in the biogeographic data set extend back to the 1920s, the temporal variation in the environmental conditions at any site due to anthropogenic climate change is small compared to the total variation we observe across the 60° latitude and 1600 m of water depth included here. The saturation state with respect to calcite is a function of the temperature and pressure of seawater and the dissolved inorganic carbon concentration (DIC), alkalinity, and salinity (Dickson Reference Dickson1990). We compiled mean annual values of seawater alkalinity and DIC from the Global Ocean Data Analysis Project (Key et al. Reference Key, Kozyr, Sabine, Lee, Wanninkhof, Bullister, Feely, Millero, Mordy and Peng2004) and carbon dioxide in the Atlantic Ocean (CARINA Group 2009) data sets and matched foraminiferal localities to the nearest grid points for these data. Using the R package seacarb, Version 3.0.11 (Gattuso et al., 2015), we estimated the calcite saturation state of seawater for each locality. Alkalinity, DIC, salinity, temperature, and pressure (estimated in bars by dividing meters below sea level by 10) are required input parameters for seacarb to determine the calcite saturation state of the seawater.
The mean annual flux of POC to the seafloor reflects the amount of food available to benthic life. McClain et al. (Reference McClain, Gullett, Jackson-Ricketts and Unmack2012b) used the model of Lutz et al. (Reference Lutz, Caldeira, Dunbar and Behrenfeld2007) to estimate the export flux of POC to the seafloor (g of C m−2 year−1) in order to study the influence of food availability on patterns of marine mollusk body-size distributions. The model of Lutz et al. (Reference Lutz, Caldeira, Dunbar and Behrenfeld2007) predicts the annual flux of POC to the seafloor using an algorithm that incorporates POC flux sediment trap measurements and remotely sensed sea surface temperature and net primary production data. This POC flux model yields an average grid spacing of ~12.5 km and provides the best estimate of energy resource availability on the seafloor for both shallow and deep-water sites. This model also confirms that sites with the greatest seasonal variability in surface-water primary productivity receive higher POC fluxes because new production outpaces decompositional activity, thereby allowing a greater proportion of POC to be exported. Following the methods of McClain et al. (Reference McClain, Gullett, Jackson-Ricketts and Unmack2012b), we applied the model of Lutz et al. (Reference Lutz, Caldeira, Dunbar and Behrenfeld2007) to test the constraint food availability places on benthic foraminiferal test morphology.
Statistical Analysis and Model Selection
We applied a predictor–corrector method to compute the regularization path of generalized linear models to identify the best environmental predictors of North American benthic foraminiferal test size and volume–to–surface area ratio. We used the R package glmpath, Version 0.97 (Park and Hastie Reference Park and Hastie2013) to compute a series of multiple linear regression solutions, in which each new solution introduces an additional environmental parameter, estimating the coefficients with less regularization (i.e., a larger sum of the absolute values of the coefficients) based on the previous solution. We included the following environmental parameters in the model: mean annual temperature (°C), dissolved oxygen concentration (ml/liter), POC flux to the seafloor (g of C m−2), and calcite saturation state. Only sites that had environmental data for all four predictor variables were included in the analyses. The mean values of the oceanographic variables at each site represent the environmental conditions that foraminiferal species might experience over their life span; for example, the maximum and minimum temperature at a site are strongly correlated with the mean annual temperature (p < 0.0001, adjusted R 2 = 0.89 and p < 0.0001, adjusted R 2 = 0.90, respectively). Prior to analyses, each environmental parameter was rescaled to mean zero and unit variance to enable direct comparison of regression coefficients and, thus, the L1-regularized regression approach. Test volumes and volume–to–surface area ratios were log10-transformed prior to analysis. We analyzed the foraminiferal data set presented here for the North American continental margin as a whole, and then compared the Pacific and Atlantic open-marine continental shelf environments. We used the Akaike information criterion (AIC) and Bayesian information criterion (BIC) to determine the best model in each analysis. In cases in which the best model differed between AIC and BIC metrics, we selected the simpler model (i.e., the model with the fewest environmental predictors) (Payne et al. Reference Payne, Jost, Wang and Skotheim2012b).
Results
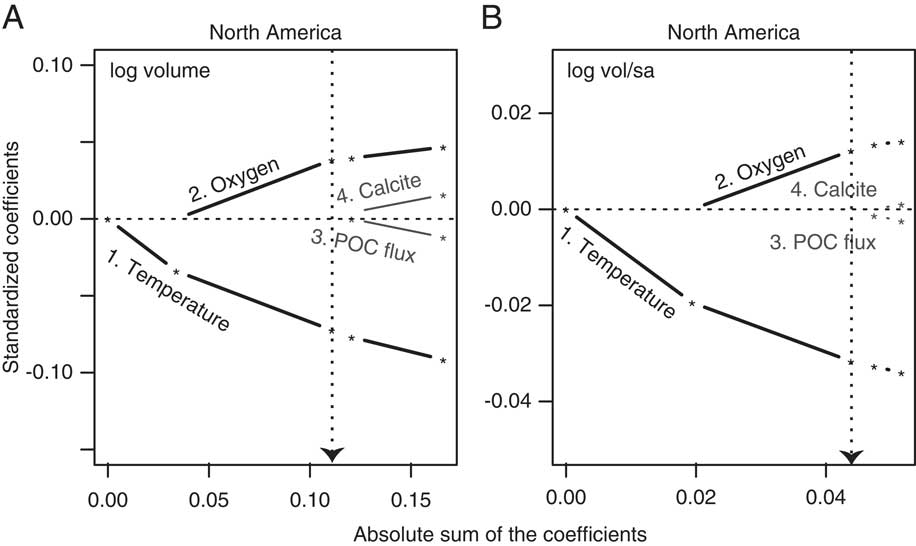
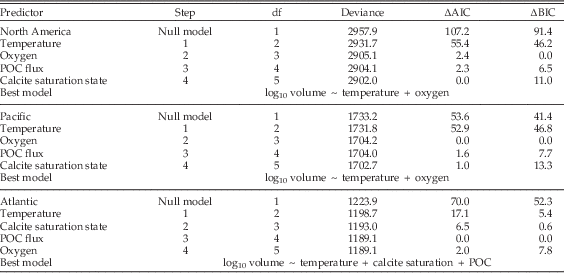
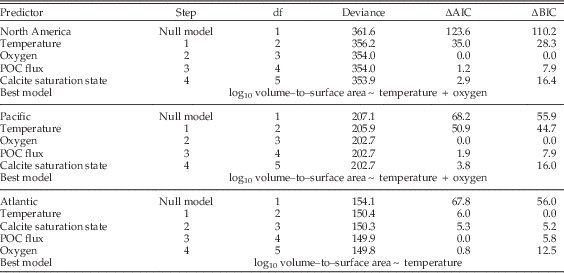
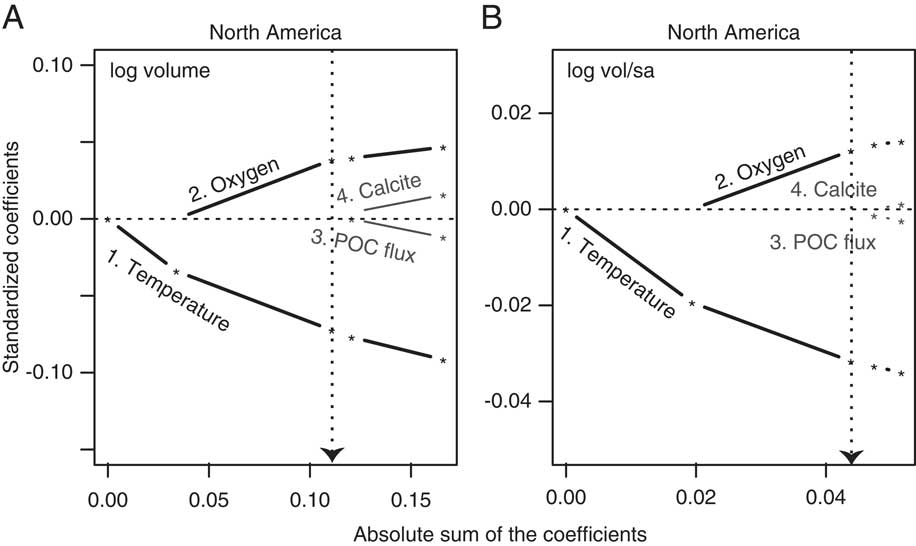
Foraminiferal test size and volume–to–surface area ratio from the North American continental margin are most strongly correlated with seawater temperature and dissolved oxygen concentrations (Fig. 2). Temperature is inversely correlated with (log10-transformed) test volume and volume–to–surface area ratio, whereas, oxygen is positively correlated with both measures of morphology (Fig. 2). In both cases, the direction of association is consistent with expectations from physiological first principles (Chapelle and Peck Reference Chapelle and Peck1999; Gillooly et al. Reference Gillooly, Brown, West, Savage and Charnov2001). The absolute value of the coefficient for temperature is larger than that for oxygen, indicating that it exerts a stronger influence on morphology over the range of conditions present around the North American continental margin (Tables 1 and 2).
Results of L1-regularized regression analysis assessing the correlation between environmental predictors and foraminiferal test morphologies, illustrating the significant association of temperature and oxygen with both size and volume–to–surface area ratio for the whole North American continental margin data set. The North American data set is a combination of both the Atlantic and Pacific continental margins. Bolded black lines and text represent the environmental parameters that comprise the best model for predicting variations in (log10-transformed) test volume (A) and volume–to–surface area ratio (B) based on AIC and BIC model selection criteria (see Tables 1 and 2). Gray lines and text are environmental predictors not included in the best model (i.e., calcite saturation state and POC flux). The numbers that lead the environmental predictors rank their relative importance and subsequently correspond to the order in which the predictor variables are added to the model. Dashed vertical lines point to the absolute sum of the coefficients of the environmental predictors that comprise the best-supported model. For example, in (A) temperature (1) is ranked the most important environmental predictor followed by dissolved oxygen concentration (2), and both of these environmental variables together yield the best model for explaining variation in Rotallid foraminiferal test log volume from the North American continental margin.
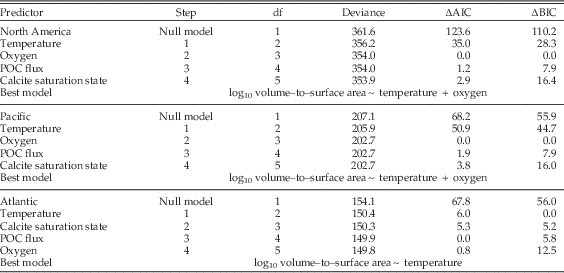
The order (i.e., step) of environmental variables added to the model to best predict the distribution of (log10-transformed) test biovolumes from the North American, Pacific, and Atlantic continental margins (top to bottom). AIC and BIC values are reported as the difference (∆) between the model in question and the model with the lowest reported value. Our model-selection process considers both AIC and BIC values, and if two models yielded similar values we selected the simpler model (i.e., the model with the fewer environmental predictor variables).

The order (i.e., step) of environmental variables added to the model in order to best predict the distribution of (log10-transformed) test volume–to–surface area ratios from the North American, Pacific, and Atlantic continental margins (top to bottom). AIC and BIC values are reported as the difference (∆) between the model in question and the model with the lowest reported value. Our model-selection process considers both AIC and BIC values, and if two models yielded similar values we selected the simpler model (i.e., the model with the fewer environmental predictor variables).
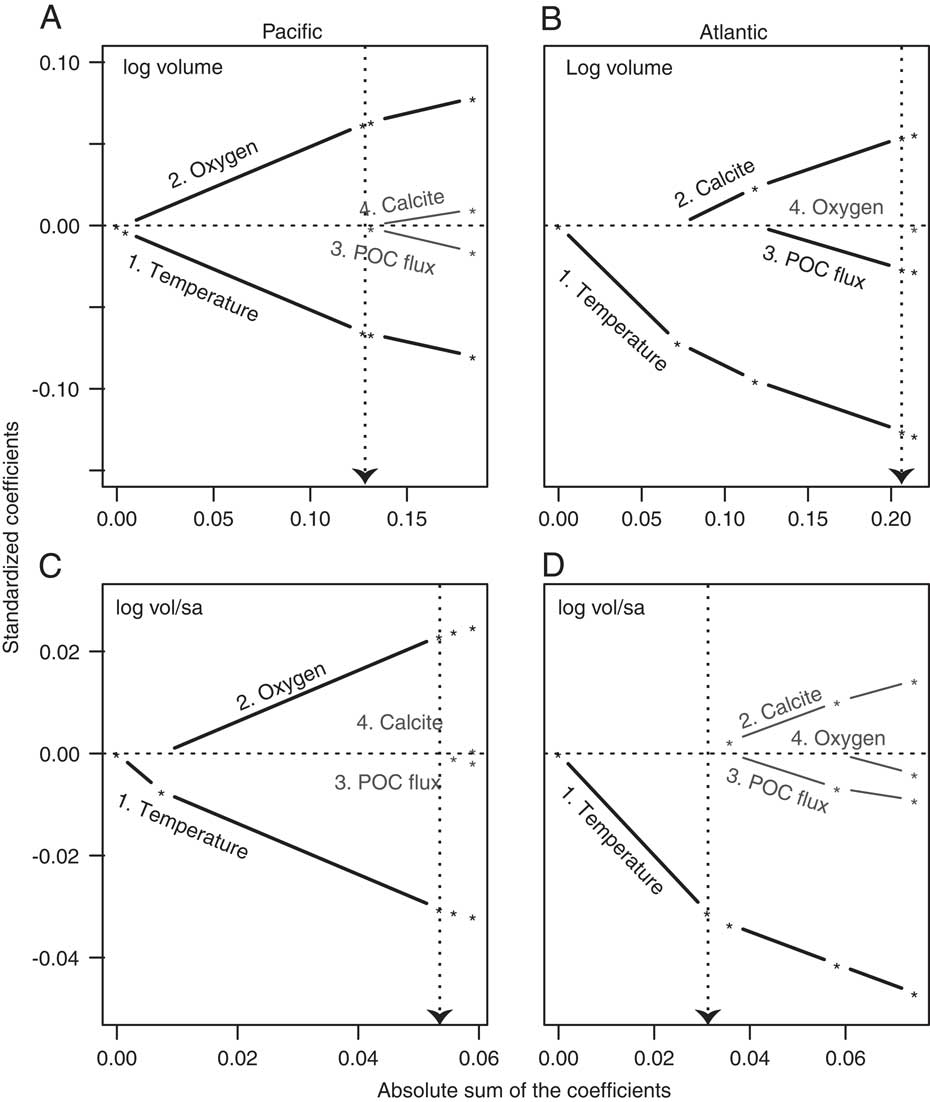
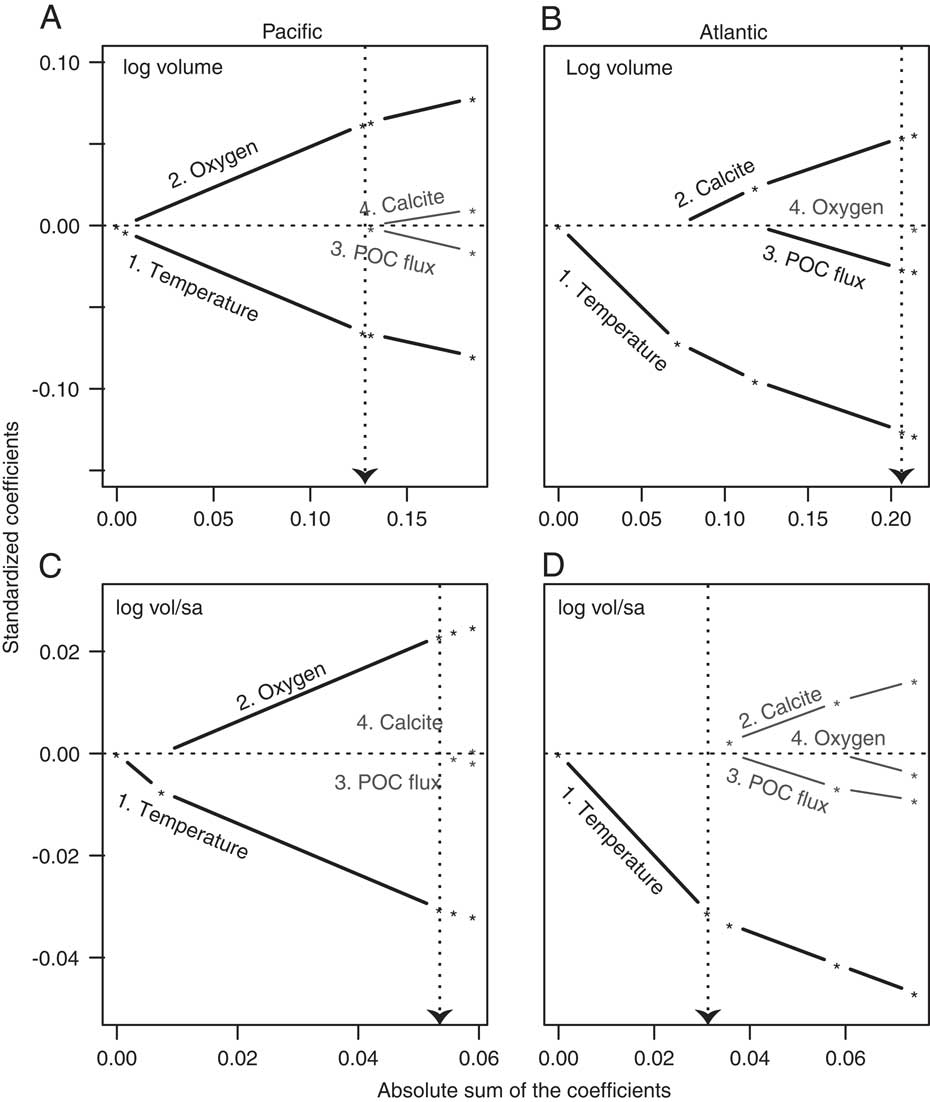
To assess whether the controls on foraminiferal size and volume–to–surface area ratio differed between ocean basins, we repeated the regression analysis separately for the Pacific and Atlantic subsets of the data. The best model for the Pacific data closely resembles the best model for the full data set: both include temperature and oxygen in the best model and have similar absolute values of the coefficients (Fig. 3A,C). In contrast, regression on the Atlantic subset of the data yields a model including an inverse association with temperature, a positive association with carbonate saturation, an inverse association with POC flux for test volume (Fig. 3B), and only an inverse association with temperature for the volume–to–surface area ratio (Fig. 3D).
Results of L1-regularized regression analysis assessing the correlation between environmental predictors and foraminiferal test morphologies, illustrating the significant association of temperature and oxygen with both size and volume–to–surface area ratio for the Pacific continental margin and the significant association of temperature with both measures of morphology for Atlantic continental margin. Bolded black lines and text represent the environmental parameters that comprise the best model for predicting (log10-transformed) test volume for the Pacific (A) and Atlantic (B) and (log10-transformed) test volume–to–surface area ratio for the Pacific (C) and Atlantic (D) continental margins based on AIC and BIC model selection criteria (see Tables 1 and 2). Gray lines and text are environmental predictors not included in the best model. The numbers that lead the environmental predictors rank their relative importance and subsequently correspond to the order in which the predictor variables are added to the model. Dashed vertical lines point to the absolute sum of the coefficients of the environmental predictors that comprise the best-supported model.
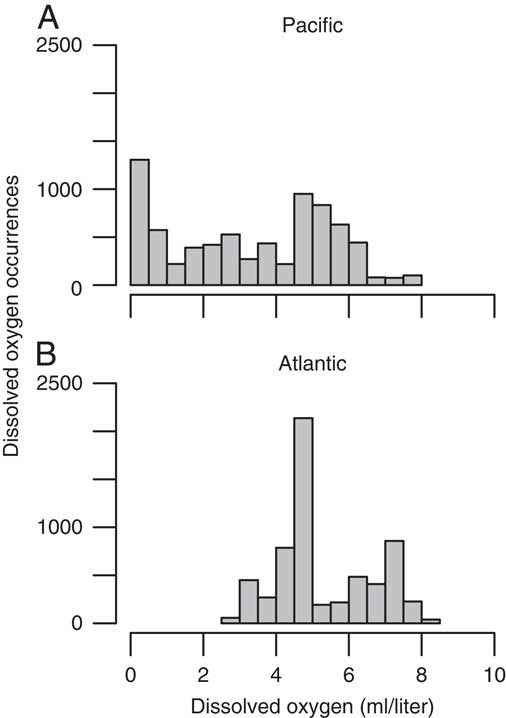
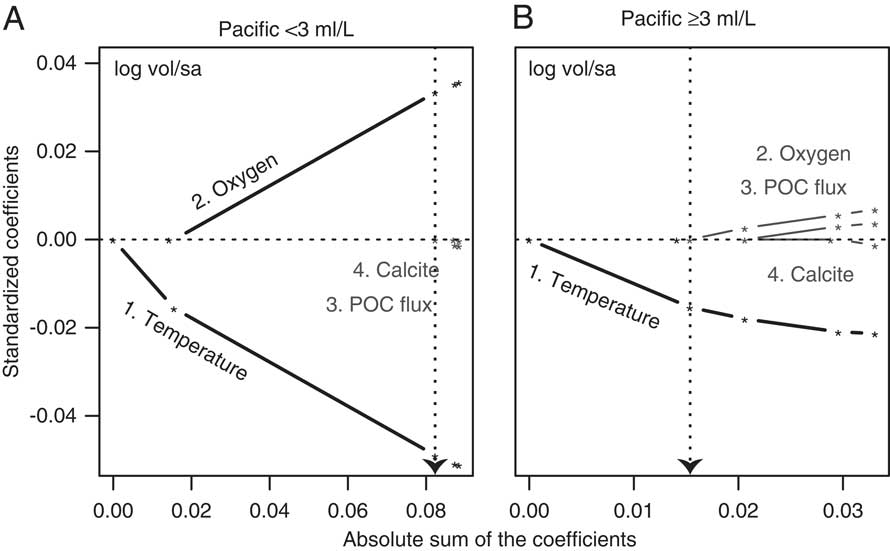
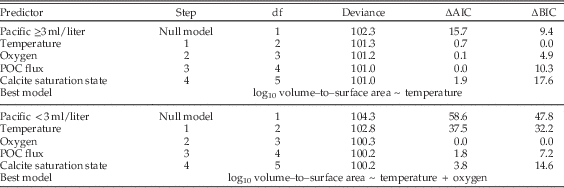
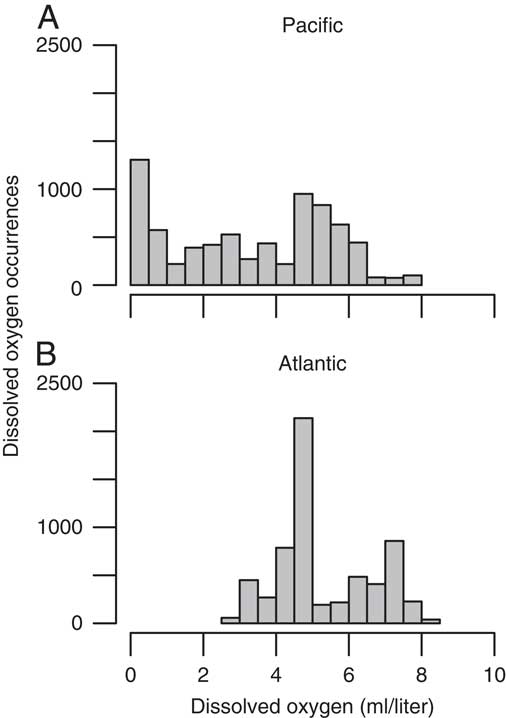
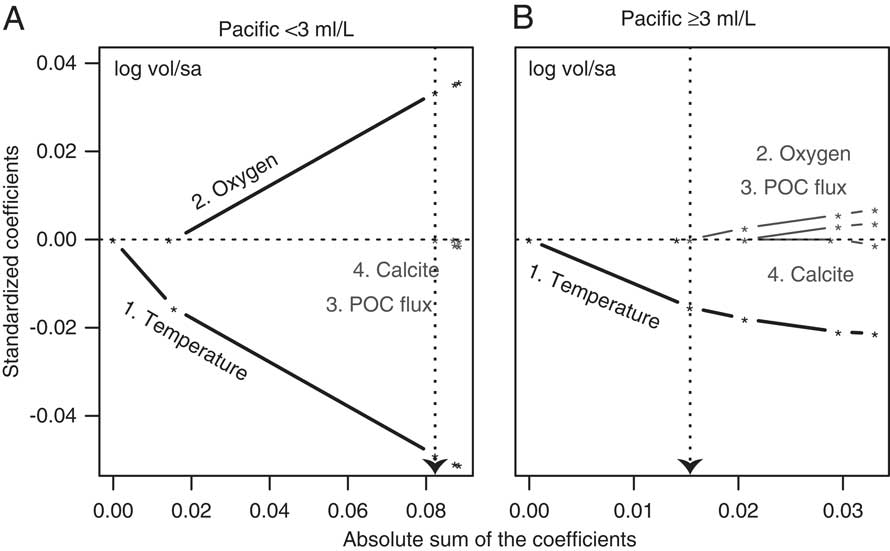
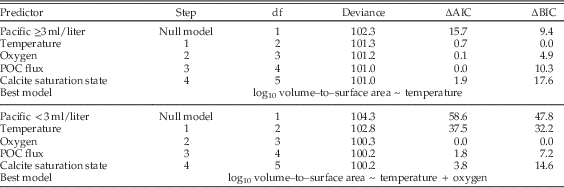
Comparison of the range of environmental conditions present on the Pacific versus Atlantic margins of North America helps to explain the differences in the best statistical models for test morphology. Specifically, strong seasonal upwelling of nutrients along the Pacific margin of North America introduces waters high in dissolved nutrients and depleted in dissolved oxygen (Broecker and Peng Reference Broecker and Peng1982), thereby producing widespread oxygen minimum zones that intersect the continental margin over a vast area (Helly and Levin Reference Helly and Levin2004). Dissolved oxygen concentrations along the Pacific continental shelf range from ~0 to 8 ml/liter, whereas concentrations in the Atlantic, which lacks seasonal upwelling, rarely fall below ~3 ml/liter (Fig. 4). Because the Atlantic and Pacific coasts of North America exhibit these differences in dissolved oxygen concentration, we separately analyze the waters of Pacific continental margin for those environments in which there is <3 ml/liter [O2] (unique to the Pacific) versus environments that have ≥3 ml/liter [O2] (similar to the Atlantic). The value of 3 ml/liter [O2] used here is not an important physiological threshold for foraminifera, but instead describes the minimum value of dissolved oxygen concentrations along the Atlantic continental margin. In Pacific waters with <3 ml/liter [O2], temperature and dissolved oxygen concentrations are important influences on benthic foraminiferal (log10-transformed) test volume–to–surface area ratio (Fig. 5A, Table 3). In Pacific waters with ≥3 ml/liter [O2], temperature is the only significant environmental predictor of (log10-transformed) test volume–to–surface area ratio (Fig. 5B). Thus, the Pacific and Atlantic regression results are similar when the Pacific data are restricted to sites within the range of oxygen concentrations observed in the Atlantic. The observed difference in these statistical models reflects differences in the range of environmental conditions present rather than in the underlying morphological responses of foraminifera to the physicochemical conditions.
Range of dissolved oxygen concentration for sites included in our biogeographic data set for the Pacific (A) and Atlantic (B) continental margins of North America, illustrating the absence of low-oxygen waters in the Atlantic basin (Garcia et al. Reference Garcia, Locarnini, Boyer, Antonov, Baranova, Zweng and Johnson2010).
Results of L1-regularized regression analysis assessing the correlation between environmental predictors and foraminiferal test volume–to–surface area ratio, illustrating the significant association of temperature and oxygen with volume–to–surface area ratio for the Pacific waters with <3 ml/liter [O2] and the significant association of temperature with volume–to–surface area ratio in Pacific waters ≥3 ml/liter [O2]. Bolded black lines and text represent the environmental parameters that comprise the best model for predicting test (log10-transformed) volume–to–surface area ratio for Pacific waters that have <3 ml/liter [O2] (A) and ≥3 ml/liter [O2] (B) based on AIC and BIC model selection criteria (see Table 3). Gray lines and text are environmental predictors not included in the best model. The numbers that lead the environmental predictors rank their relative importance and subsequently correspond to the order in which the predictor variables are added to the model. Dashed vertical lines point to the absolute sum of the coefficients of the environmental predictors that comprise the best-supported model.
The order (i.e., step) of environmental variables added to the model in order to best predict the distribution of (log10-transformed) volume–to–surface area ratio from Pacific waters with ≥3 ml/liter and <3 ml/liter of dissolved oxygen (top to bottom). AIC and BIC values are reported as the difference (∆) between the model in question and the model with the lowest reported value. Our model-selection process considers both AIC and BIC values, and if two models yielded similar values we selected the simpler model (i.e., the model with the fewer environmental predictor variables).
Discussion
Effects of Temperature and Dissolved Oxygen on Test Morphology
The results presented herein demonstrate the importance of temperature and dissolved oxygen concentration in driving morphological variation across broad geographic scales. Regardless of how the data are parsed (North America vs. Atlantic vs. Pacific), the environmental signals remain. These findings are consistent with the effects of temperature and dissolved oxygen concentration on the metabolic demands of individual organisms and also explain the differences observed between the Pacific and Atlantic continental margins.
Physiological calculations help to explain why the association between oxygen availability and test morphology declines in strength at higher dissolved oxygen levels. Gillooly et al. (Reference Gillooly, Brown, West, Savage and Charnov2001) showed that metabolic rate (B) is well predicted by organism biomass and temperature. Here, we modify the relationship presented by Gillooly et al. (Reference Gillooly, Brown, West, Savage and Charnov2001) to account for the linear scaling of mass to specific metabolic rate (b 0) in protists, which differs from the 3/4-power scaling characteristic of metazoans (DeLong et al. Reference DeLong, Okie, Moses, Sibly and Brown2010):
 $$B{\rm }\,{\equals}\,{\rm }b_{0} Me^{{{\minus}Ei\,/\,kT}} $$
Reaction kinetics vary with temperature according to the Boltzmann factor, e −Ei/kT , where T is the absolute temperature (in degrees K), E i is the activation energy (i.e., the minimum amount of energy that a species must possess in order to metabolize), and k is Boltzmann’s constant. We further modify this equation by substituting the product of biovolume (V) and cell density (r) for cell biomass (M) in order to compare to the results of our North American data set:
 $$B\,{\equals}\,b_{0} \left( {V\cdot{\rm }r} \right)e^{{{\minus}Ei\,/\,kT}} $$
Cell size (i.e., biomass or biovolume) and the effects of ambient temperature on metabolic rates primarily dictate the oxygen demand of the foraminifera. Oxygen transport across the cell surface is controlled by its surface area (SA) and can be represented as: SA · u · [O2], where u is the cytoplasmic streaming velocity (Payne et al. Reference Payne, Groves, Jost, Nguyen, Moffitt, Hill and Skotheim2012a). Given that oxygen transport across the cell surface must be at least equal to the oxygen demand, we estimated the maximum theoretical volume–to–surface area ratio (i.e., sphere morphology) of benthic foraminifera given variations in seawater temperature and dissolved oxygen concentration:
 $$V\,\colon\,SA_{{max}} \,{\equals}\,u\cdot\left[ {O_{2} } \right]\,/\,3b_{0} \cdote^{{{\minus}Ei\,/\,kT}} \cdotq\cdotr$$
To estimate the shape of this relationship with respect to dissolved oxygen and temperature given constant values of the other parameters, we assign a mass-specific metabolic rate constant (b 0) of 3.4·1010 W/kg. We estimated this constant by converting the respiration rates (nl O2 cell−1 h−1) of Rotallid foraminiferal species reported by Geslin et al. (Reference Geslin, Risgaard-Petersen, Lombard, Metzger, Langlet and Jorissen2011) to their respective mass-specific metabolic rates. We used the mean b 0 for our analyses: b 0 for these reported Rotallid foraminifera ranged from 8.99·109 to 8.21·1010 W/kg. We also assume that active transport via cytoplasmic streaming is the dominant mechanism for oxygen transport within the cell. We assign a cytoplasmic streaming velocity of u ~5·10−3 mm/s (Travis and Bowser Reference Travis and Bowser1991) and approximate the density of the cell cytoplasm, r, as 1 g/cm3 (Korsun et al. Reference Korsun, Hald, Panteleeva and Tarasov1998). The energy yield from burning one mole of glucose via aerobic respiration is denoted by the constant q, ~2.08·10−6 mol/W·s.
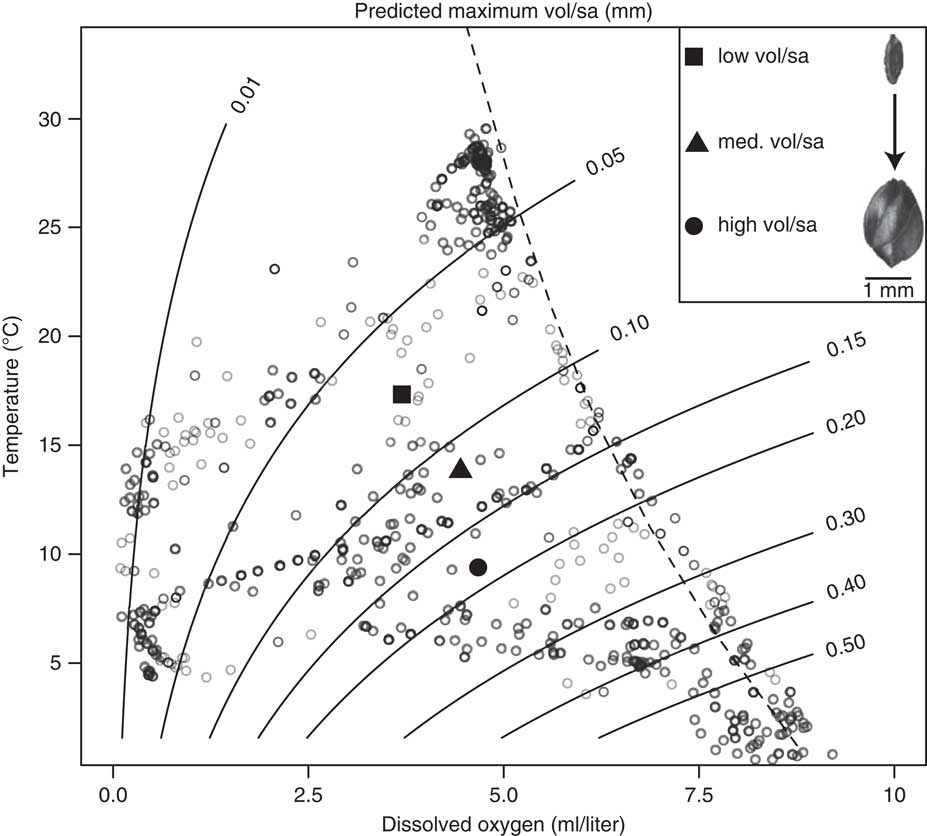
The volume–to–surface area ratios observed in our data concur in trend and absolute value with the predictions from equation (2) based on the effects of temperature and dissolved oxygen concentration on organism metabolism (Fig. 6). Contour lines tracing the theoretical maximum test volume–to–surface area ratio, given constant values for the parameters enumerated above, show a trend of increasing test volume–to–surface area ratio with decreasing seawater temperature and increasing dissolved oxygen concentration. Oxygen tends to have a linear effect on the predicted maximum test volume–to–surface area at constant temperature, and supports observations made by Bernhard (Reference Bernhard1986), whereas temperature exhibits a nonlinear effect. In waters with less than 3 ml/liter [O2], such as those found along the Pacific continental coast of North America, slight changes in dissolved oxygen concentration yield the greatest change in test morphology. In low-oxygen environments, a decrease in the test volume will reduce metabolic demands and an increase in test surface area will maximize the rate of oxygen uptake by the cell via diffusion (Bernhard Reference Bernhard1986). Although several Rotallid foraminifera are known to denitrify (Risgaard-Petersen et al. Reference Risgaard-Petersen, Langezaal, Ingvardsen, Schmid, Jeten, Ob den Camp, Derksen, Piña-Ochoa, Eriksson, Nielsen, Revsbech, Cedhagen and Van der Zwaan2006; Piña-Ochoa et al. Reference Piña-Ochoa, Høgslund, Geslin, Cedhagen, Revsbech, Nielsen, Schweizer, Jorissen and Rysgaard-Peterson2010; Koho et al. Reference Koho, Piña-Ochoa, Geslin and Risgaard-Petersen2011; Bernhard et al. Reference Bernhard, Casciotti, McIlvin, Beaudoin, Visscher and Edgcomb2012) or harbor symbionts (Bernhard et al. Reference Bernhard, Buck, Farmer and Bowser2000, Reference Bernhard, Buck and Barry2001), foraminifera still likely respond to variations in ambient dissolved oxygen concentration because aerobic respiration is energetically favorable over other metabolic strategies (Nardelli et al. Reference Nardelli, Barras, Metzger, Mouret, Filipsson, Jorissen and Geslin2014). However, in both Pacific and Atlantic waters with more than 3 ml/liter [O2], variations in temperature elicit the greatest change in test morphology due to their effect on metabolic rates.
Contour plot showing the predicted theoretical maximum test volume–to–surface area ratio (mm) of benthic foraminifera given variations in seawater temperature and dissolved oxygen concentration under one set of physiological parameters, illustrating the fact that samples cover the full range of possible temperature and oxygen values. The observed volume–to–surface area ratios generally follow the shape of the relationship predicted from physiological first principles. The dashed line traces the saturation of dissolved oxygen in seawater. Gray open circles plot the Rotallid foraminiferal occurrences from the North American data set. Solid black shapes denote the mean seawater temperature and dissolved oxygen concentration for foraminifera that have test volume–to–surface area ratios <0.05 mm (square), 0.05–0.20 mm (triangle), and >0.20 mm (circle). We give an example of a species from our data set with a low test volume–to–surface area ratio (Angulogerina angulosa) and one with a high test volume–to–surface area ratio (Globobulimina auriculata). The test volume–to–surface area ratios of the North American data and the theoretical maximum values show a similar trend of increasing ratios with decreasing seawater temperature and increasing dissolved oxygen concentration.
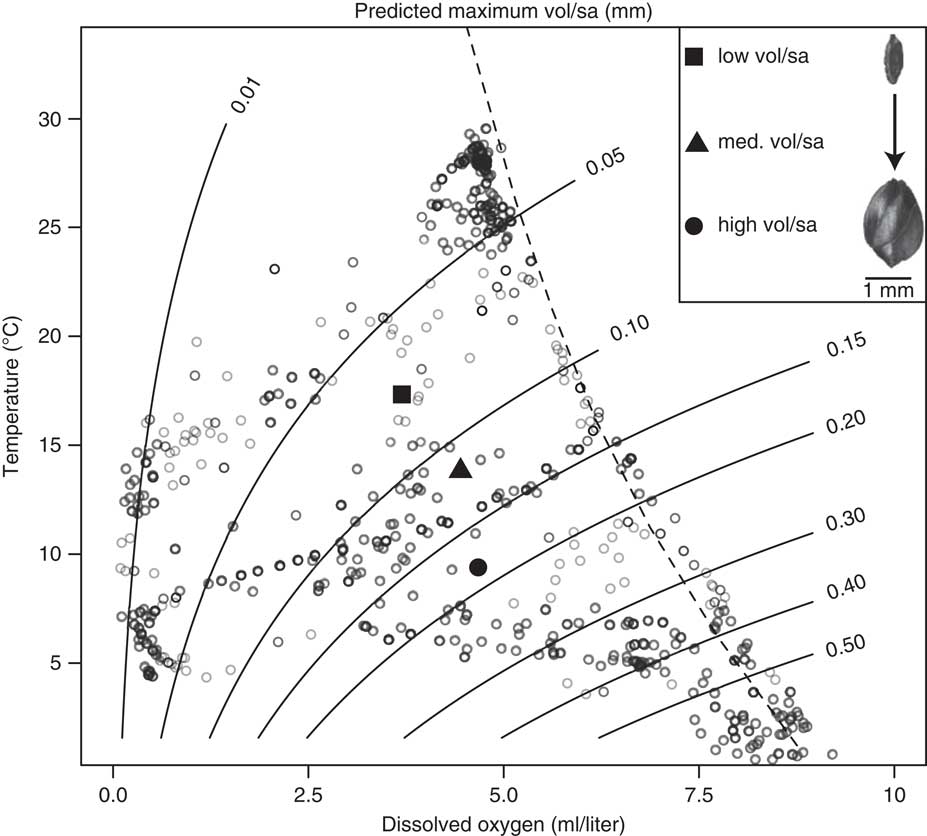
The general trend of the contour lines in Figure 6 supports our findings from empirical test size and volume–to–surface area ratio data from North American continental margin. For purposes of illustration, we have assumed that other variables included in the model are constants. In nature, however, parameters such as organism metabolic rate and cytoplasmic streaming velocity vary among species and environments. Because cell morphology can be maintained under changing environmental conditions by varying these parameters, contour lines are not hard constraints on test volume–to–surface area but instead can be interpreted as lines of approximately equal selective pressure on it. We overlay our empirical data on Figure 6 by plotting the mean temperature and dissolved oxygen concentration of foraminifera that have test volume–to–surface area ratios <0.05 mm (square), 0.05–0.2 mm (triangle), and >0.2 mm (circle); benthic foraminiferal test volume–to–surface area ratios in the North American data set span 0.012 mm to 0.32 mm. The mean temperature and dissolved oxygen values for these three groupings of test volume–to–surface area ratio are consistent with the selective pressures implied by equation (2) and illustrated in Figure 6.
Temperature and dissolved oxygen concentrations exert a significant influence over both the size and volume–to–surface area ratio of benthic foraminifera from the North American continental margin. Similar metabolic controls over these two different measures of morphology suggest that most of the response of benthic foraminiferal test volume–to–surface area ratios to environmental pressures is through changes in test volume rather than changes in volume–to–surface area ratio at a constant size. In other words, the primary mechanism by which foraminifera vary in surface area-to-volume ratio is by differences in size, rather than differences in the ratios of lengths of the primary axes. Thus, benthic foraminifera appear to use the same physiological mechanism for changes in test volume and volume–to–surface area ratio.
Implications for the Benthic Foraminiferal Fossil Record
The metabolic controls that shape patterns in the spatial distribution of modern benthic foraminiferal test size and volume–to–surface area ratio around the North American continental margin may shed new light on the causes of both short- and long-term patterns of morphological evolution in the foraminiferal fossil record. Specifically, the results presented herein show that temperature is the most important control in the physical environment on spatial variation in foraminiferal morphology around the North American continent, with oxygen playing a secondary role. Variation in oxygen availability has been widely cited as a control on foraminiferal size evolution during intervals of environmental change (Kaiho Reference Kaiho1999b; Kaiho et al. Reference Kaiho, Takeda, Petrizzo and Zachos2006; Groves et al. Reference Groves, Rettori, Payne, Boyce and Altiner2007; Payne et al. Reference Payne, Summers, Rego, Altiner, Wei, Yu and Lehrmann2011, Reference Payne, Groves, Jost, Nguyen, Moffitt, Hill and Skotheim2012a,Reference Payne, Jost, Wang and Skotheimb; Song et al. Reference Song, Tong and Chen2011), whereas the effects of environmental temperature on metabolism and morphology appear to have been less widely appreciated.
Trochospiral benthic foraminifera during the Paleocene–Eocene Thermal Maximum (PETM) show a drastic reduction in maximum test size across the extinction boundary that has been attributed to a decline in bottom water dissolved oxygen concentrations (Kaiho et al. Reference Kaiho, Takeda, Petrizzo and Zachos2006; Winguth et al. Reference Winguth, Thomas and Winguth2012). However, several lines of evidence suggest that warming bottom-water temperatures also played at least as important of a role. First, size decreases occurred both at sites experiencing a decline in oxygen availability (Kaiho et al. Reference Kaiho, Takeda, Petrizzo and Zachos2006) and those lacking evidence for dysoxic conditions (Alegret et al. Reference Alegret, Ortiz, Arenillas and Molina2010). In both cases, negative shifts in benthic isotope values across the PETM suggest a 3–4°C warming of deep waters. Thus, our results provide quantitative support for the hypothesis of Alegret et al. (Reference Alegret, Ortiz, Arenillas and Molina2010) that size reduction in benthic foraminifera during the PETM was driven, at least in part, by increased metabolic demands caused by warming of marine bottom waters.
Climate warming may also have played a role in foraminiferal size reduction across the end-Permian mass extinction. Rego et al. (Reference Rego, Wang, Altiner and Payne2012) demonstrated that size reduction of benthic foraminifera across the Permian–Triassic mass extinction boundary was driven both by size-selective extinction and by size reduction in survivor species, with the size reduction within lineages accounting for the majority of overall size decrease. Small-sized foraminifera dominate postextinction fossil assemblages even in the shallowest marine settings (Groves et al. Reference Groves, Rettori, Payne, Boyce and Altiner2007; Payne et al. Reference Payne, Summers, Rego, Altiner, Wei, Yu and Lehrmann2011; Song et al. Reference Song, Tong and Chen2011), where geochemical evidence for dysoxia is at best mixed (Loope et al. Reference Loope, Kump and Arthur2013), suggesting additional selective pressures on size beyond oxygen deficiency. Oxygen isotope data from conodont microfossils suggest warming of approximately 10°C across this extinction interval and persisting through the Early Triassic (Joachimski et al. Reference Joachimski, Lai, Shen, Jiang, Luo, Chen, Chen and Sun2012; Sun et al. Reference Sun, Joachimski, Wignall, Yan, Chen, Jiang, Wang and Lai2012; Romano et al. Reference Romano, Goudemand, Vennemann, Ware, Schneebeli-Hermann, Hochuli, Bruhwiler, Brinkmann and Bucher2013). Thus, elevated metabolic demand at higher environmental temperatures may help to explain the size reduction within survivors of the end-Permian extinction.
The effects of temperature on long-term evolution of foraminiferal morphology may also have been underappreciated. For example, a compilation of maximum test-size measurements of calcareous trochospiral benthic foraminifera over the past 120 Myr documents temporal variations in size related to global environmental fluctuations, which Kaiho (Reference Kaiho1999b) interpreted to result from variation in bottom-water oxygen concentrations. However, intervals marked by maximum test size also coincide with global climate cooling (Kaiho Reference Kaiho1999b) and might reflect the direct influence of temperature on metabolic demand. Similarly, Boltovskoy (Reference Boltovskoy1988) identified five Rotallid foraminiferal species that show a trend of increasing mean and maximum size from the Oligocene through the Pleistocene and invoked Cope’s rule, the tendency for size increase over evolutionary time, to explain this trend. However, the late Cenozoic represents a period of gradual global climate cooling (Zachos et al. Reference Zachos, Pagani, Sloan, Thomas and Billups2001). Thus, increasing foraminiferal size in these select species over the last ~34 Myr could alternatively result from temperature effects on metabolic demand, similar to the spatial and temporal trends toward larger size at cooler temperatures in Cenozoic deep-sea ostracodes (Hunt and Roy Reference Hunt and Roy2006).
Global Climate Change and Benthic Foraminifera
Concerns surrounding anthropogenic climate change due to increasing atmospheric CO2 concentrations over the next century to millennium often focus on the effects of ocean warming, acidification, and deoxygenation on marine life (e.g., Gruber Reference Gruber2011; Bijma et al. Reference Bijma, Pörtner, Yesson and Rogers2013; Bopp et al. Reference Bopp, Resplandy, Orr, Doney, Dunne, Gehlen, Halloran, Heinze, Ilyina, Seferian and Tjiputra2013). Of these expected changes, our results indicate that warming seawater temperatures will inflict the greatest metabolic stress on benthic foraminifera. Temperature acts both directly on metabolic rate and indirectly on the bioavailability of dissolved oxygen concentrations (Verberk et al. Reference Verberk, Bilton, Calosi and Spicer2011; Verberk and Atkinson Reference Verberk and Atkinson2013). Warming oceans hold less dissolved oxygen (Gruber Reference Gruber2011; Bijma et al. Reference Bijma, Pörtner, Yesson and Rogers2013), thereby making it difficult for foraminifera, and other marine life, to meet increasing metabolic demands and subsequent oxygen requirements in warm waters. Foraminifera typically dominate low-oxygen environments and are thus ecologically important in the uptake and processing of organic matter deposited in these sediments (Moodley et al. Reference Moodley, Boschker, Middelburg, Pel, Harman, de Deckere and Heip2000; Woulds et al. Reference Woulds, Cowie, Levin, Andersson, Middelburg, Vandewiele, Lamont, Larkin, Gooday, Schumacher, Whitcraft, Jeffreys and Schwartz2007; Gooday et al. Reference Gooday, Levin, da Silva, Bett, Cowie, Dissard, Gage, Hughes, Jeffreys, Lamont, Larkin, Murty, Schumacher, Whitcraft and Woulds2009, Reference Gooday, Bett, Escobar, Ingole, Levin, Neira, Raman and Sellanes2010). However, as hypoxic conditions become more prevalent in the near future, foraminifera in waters with >3 ml/liter [O2] will have to devote a greater amount of energy to perform basic biological reactions or reduce their test volume–to–surface area ratios. Foraminifera that occur in modern oxygen minimum zones are typified by small, thin-shelled unornamented tests with low volume–to–surface area ratios; this morphology decreases the oxygen demand of the cell while enhancing oxygen diffusion rates (Bernhard Reference Bernhard1986). Contrary to expectations, our data indicate that changes in calcite saturation state and POC flux are unlikely to have important direct effects on the composition of foraminiferal communities, as the coefficients associated with these environmental parameters are relatively small compared with the coefficients associated with temperature and dissolved oxygen (Fig. 3).
Summary
Across the North American continental shelf, physicochemical conditions exert an identifiable influence on the sizes and volume–to–surface area ratios of benthic foraminifera. Test volume and volume–to–surface area ratio of Rotallid foraminifers are inversely correlated with ambient water temperature across broad geographic scales and among species, consistent with a direct metabolic influence on cell size. These morphological parameters correlate positively with oxygen availability, which exerts a stronger control at lower oxygen concentrations typical of upwelling zones in the eastern Pacific, generally below 3 ml/liter. In contrast, the calcite saturation state of seawater and POC flux to the seafloor do not exert statistically identifiable controls on size and volume–to–surface area ratio beyond their correlations with temperature and oxygen. These findings highlight the role of energy metabolism in the biogeographic distribution of protistan species. To the extent that space can be substituted for time, they also suggest that high temperatures were at least as important as lower oxygen availability in driving test reductions during episodes of global warming and oxygen depletion in Earth’s past. They further suggest that warming waters and expansion of hypoxic zones during the coming millennium are more likely to impact benthic foraminiferal communities than declines in calcite saturation or changes in primary productivity.
Acknowledgments
We thank S. J. Culver and M. A. Buzas for sharing their biogeographic benthic foraminifera data set; D. T. Medeiros for ArcGIS assistance; C. R. McClain for providing POC flux data; R. M. Key and L. G. Anderson for assistance finding ALK and DIC data in the Caribbean and Arctic, respectively; N. A. Heim for helpful discussion and R assistance; E. A. Sperling for helpful comments on an early draft of the manuscript; and a number of summer high school student interns for data collection. C.R.K.-B. was supported by a National Science Foundation Graduate Research Fellowship. J.L.P. was supported by a CAREER grant from the U.S. National Science Foundation (EAR-1151022).