The Portevin–Le Chatelier (PLC) effect[Reference Portevin and Le Chatelier1–Reference Lebyodkin, Brechet, Estrin and Kubin5] is a typical nonlinear phenomenon of plastic instabilities that is attributed to the interaction of dislocations with solute atoms in metal alloys.[Reference Cottrell6] Although the role of the alloying atoms in stable solid solutions is well established, the situation is less clear for the decomposition of supersaturated solid solutions, where it is necessary to consider the simultaneous effects of a decreasing concentration of solute atoms and the formation of precipitates. This report describes the self-organized features of the plastic instabilities occurring in a supersaturated AlZnMg alloy, which is widely used in the aluminum industry. The alloy, having a composition in wt% of Al–4.8 Zn–1.2 Mg–0.14 Zr, is one of the so-called age-hardenable alloys that generally have high strength due to the nanometer-size precipitates formed in the thermodynamically non-equilibrium system after homogenization.[Reference Mondolfo7, Reference Sha and Cerezo8] Storing the samples at room temperature (RT) leads to the formation of Guinier–Preston (GP) zones in a natural ageing process.[Reference Mondolfo7, Reference Sha and Cerezo8] These nanoparticles effectively hinder the motion of dislocations within the matrix, thereby increasing the strength of the material. In the present case, for example, the Vickers hardness, HV, of the alloy changed by 50% from 40 to 60 HV after storing at RT for 3 h.[Reference Chinh, Gubicza, Czeppe, Lendvai, Xu, Valiev and Langdon9]
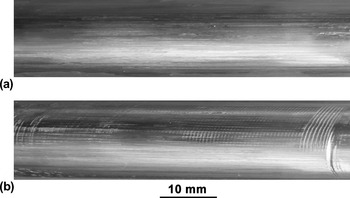
Figure 1 shows the typical surface topographies of supersaturated billets after homogenization and storing at RT for the same period of 3 h and then deforming plastically in one pass using the equal-channel angular pressing (ECAP) technique, which is a well-established severe plastic deformation (SPD) method for the fabrication of bulk nanostructured metals and alloys.[Reference Valiev and Langdon10] Prior to storage at RT, the billets were homogenized for 30 min at 743 K and then quenched to RT in water. During ECAP, the ingot is pressed in a special die through two channels with equal cross-section.[Reference Valiev and Langdon10] Here we note that another purpose for the combination of the natural aging and SPD was to study the effect of GP zones and high dislocation densities on the precipitation and strengthening in additional artificial aging. For this purpose, 20 billets were deformed by ECAP. In most cases, the surfaces of the samples remain smooth, as shown in Fig. 1(a), but on some samples as in Fig. 1(b), specifically three samples in the present work, there are visible macroscopic shear bands where the patterns on the surface fluctuate between apparent randomness and order.
Surface topographies of the billets after homogenization and storing at RT for 3 h and then processing by ECAP for one pass, showing (a) smooth surface and (b) visible macroscopic strain localizations.

The formation of macroscopic shear bands during the ECAP process is a well-known phenomenon as observed, for example, in single-crystal Al.[Reference Fukuda, Oh-ishi, Furukawa, Horita and Langdon11] In the case of polycrystalline pure metals or solid solutions such as Al–Mg alloys, the high dislocation mobility leads only to shear band formation at the microscopic scale, and these bands are not visible macroscopically even after several passes in ECAP. In the case of supersaturated alloys, however, the effect of precipitates must also be considered. The surface of the sample shown in Fig. 1(a) indicates that the effect of the precipitates (GP zones) is statistically not significant relative to that of the solute atoms. On a random scale, however, the collective effect of the precipitates may be dominant, effectively hindering the motion of dislocations and leading to the macroscopic formation of complex surface patterns in ECAP as shown in Fig. 1(b).
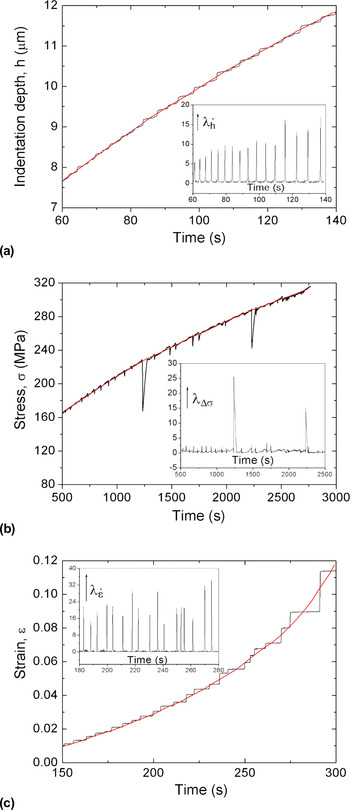
The main features of the plastic deformation taking place at RT were systematically studied microscopically by applying microindentation and macroscopically by using tensile tests. The indentation measurements were made using a Vickers diamond microindenter with a testing machine (Shimadzu DUH 202, Kyoto, Japan) operating under a force that increased linearly at a loading rate of 5 mN/ s: a penetration depth versus time curve is shown in Fig. 2(a). The macroscopic tensile tests were performed by an MTS 810 testing machine on cylindrical bone-shaped specimens having gauge lengths and diameters of 30 and 4.5 mm, respectively. Some specimens were tested at constant cross-head velocity giving an imposed strain rate of 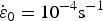 , and other specimens were tested at a constant loading rate with an imposed stress rate of
 . Typical results from the tensile tests are presented in Figs. 2(b) and 2(c).
Plastic instabilities during (a) microindentation testing, (b) tensile testing at a constant cross-head velocity, and (c) tensile testing at a constant loading rate. The red smooth lines indicating the global developments were determined by fitting the functions as h(t) = A 1 + B 1 (t − t 01)n 1, σ (t) = A 2 + B 2 (t − t 02)n 2, and ɛ (t) = A 3 + B 3 (t − t 03)n 3 for the indentation in (a), the velocity-controlled tension in (b), and the load-controlled tension in (c), respectively, where A i, B i, t 0i, and n i (i = 1, 2, 3) are fitting constants. The insets show the normalized quantities defined by Eq. (1) as a function of testing time.

Considering the indentation process, plastic instability is evident because the indentation depth, h, does not change smoothly but rather there is an intermittent indentation process in Fig. 2(a). For tensile testing, plastic instabilities are observed as an oscillation in stress, σ, in Fig. 2(b) or intermittence in the plastic deformation, ɛ, in Fig. 2(c) under different conditions. The stable or global tendencies in the indentation depth (h global(t)), the tensile stress (σ global(t)), and the strain (ɛ global(t)) in Figs. 2(a), 2(b), and 2(c), respectively, are indicated by red smooth lines. It should be noted that plastic instabilities are often characterized by a stress drop, Δσ, in strain rate-controlled tensile tests. In the present experiments with the AlZnMg age-hardenable alloy, it is apparent from Fig. 2(b) that an extremely high value (~60 MPa) of the maximum Δσ was observed where this is more than 25% of the flow stress. Other experiments on a solid solution Al-3% Mg alloy showed a lower maximum stress drop of only about 2–5% of the flow stress.[Reference Lebyodkin, Brechet, Estrin and Kubin5, Reference Bougherira, Entemeyer, Fressengeas, Kobelev, Lebedkina and Lebyokin12]
The plastic instabilities were characterized quantitatively using the following parameters:


and

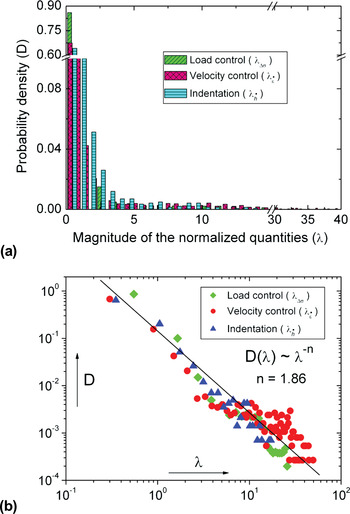
for the microindentation, velocity- and load-controlled tensile measurements, respectively. The global functions in Eqs. (1a)–(1c) refer to the derivatives of the respective parameters as a function of time represented by the red lines in Fig. 2. The normalized quantities defined by Eq. (1) are also seen in the insets of Fig. 2, and their distributions are shown in Fig. 3 in both (a) double linear and (b) double logarithmic scales.
Probability distribution density (D) of the normalized quantities characterizing the PLC plastic instabilities, shown in double linear (a) and double logarithmic (b) scales.

The double logarithmic plot of Fig. 3(b) reveals that each distribution is characterized by a power-law relationship of the form D(λ i) ∝ λ i−n ( ) with the exponent n between 1.75 and 1.92, and a value of n = 1.86 can be drawn from all of the data together. Thus, in each case the system has evolved into a statistically stationary state that is critical-like with avalanches on all scales and accordingly is scale invariant. It should be noted that the three different experimental modes reported here yield data that not only apply to different testing conditions but also reflect different magnitudes of the sample dimensions. Thus, in tensile measurements the sample volume was about 300 mm3 whereas in microindentation it was only about 3 × 10⁻⁶ mm3. This significant difference proves both that a self-organized criticality-like behavior occurs without fine-tuning of the testing parameters and that the characteristic scaling is universal because the exponents characterizing the correlation functions seem to be independent of the experimental testing conditions. The scale-free distribution in Fig. 3 predicts the occurrence of large fluctuations with a low probability. This manifests itself in the unexpectedly strong deformation localization found in the case of the sample shown in Fig. 1(b), and also in the extremely high stress drop Δσ shown in Fig. 2(b). These results unambiguously demonstrate that the PLC effect during decomposition of supersaturated alloys can be described as a self-organized critical phenomenon, which is one of the mechanisms by which complexities arise in nature.[Reference Bak13]
In summary, the reported features of the plastic instabilities in age-hardenable alloys suggest the occurrence of a self-organized criticality that demonstrates the universality of this phenomenon in nature. These results provide a comprehensive framework for studying the simultaneous effect of solute atoms and precipitates on plastic deformation in age-hardenable alloys while, at the same time, providing a clear confirmation of the strategies proposed recently for the processing of bulk nanostructures in these alloys through the application of severe plastic deformation.[Reference Chinh, Gubicza, Czeppe, Lendvai, Xu, Valiev and Langdon9] Namely, the procedure may be conducted successfully, without the formation of unexpectedly strong deformation localization and/or catastrophic cracking, if the processing by ECAP is performed immediately after quenching or at least within a very short natural aging at RT, thereby avoiding the effect of GP zones.
Acknowledgments
This work was supported by the Hungarian Scientific Research Fund under Grant Nos. K81360, K67692, and TÁMOP 4.2.1/B-09/1/KMR (N.Q.C., J.G., J.L.), and by the National Science Foundation of the United States under Grant No. DMR-0855009 and the European Research Council under ERC Grant Agreement No. 267464-SPDMETALS (T.G.L.).