I. INTRODUCTION
Nanoparticles exhibit excellent chemical, physical, mechanical and thermodynamic properties by the virtue of their surface atoms. Various synthesizing routes are available to produce nanoparticles. Reference Sarathi, Sindhu and Chakravarthy1 One of the common synthesizing routes is top-down approach, wherein a bulk grain is broken down in to nanosized grains. The electrical wire explosion process (WEP) is a top-down technique for synthesizing nanoparticles, which is well proven for producing ultrafine particles of high purity. It is an inert gas pyrolytic technique in which a thin conducting metal wire is evaporated by passing a high current through it, in an inert gas ambience. Reference Sarathi, Sindhu and Chakravarthy1–Reference Ivanov, Kotov, Somatov, Bohme, Karow and Schumacher6 The electrical wire explosion enhances the energy contained in the crystal owing to the high density of crystal defects. Reference Tepper7 In comparison with the other synthesizing techniques, the nanoparticles synthesized by this method exhibit unique properties such as Reference Dong, Zou and Yang8 : (i) lower sintering and melting temperatures (ii) high density of point, linear, surface and volume defects (iii) increased chemical activity and (iv) more stored enthalpy.
It is possible to control the electrical energy density in WEP and it is highly efficient. Reference Kwon, Hun, Yavorovsky, Illyn and Soon9 The particle size and shape can be controlled by providing an appropriate energy to the thin conductor during explosion. Reference Chandler, Hammer, Sinars, Pikuz and Shelkovenko10,Reference Kwon, Ilyin, Tikhonov, Yablunovsky and An11 It is possible to synthesize the nanoparticles of nitrides, carbides and oxides through judicious choice of the ambient gas in the explosion chamber. The synthesis of oxide, carbide and nitride nanoparticles by electrical explosion technique has been reported in the literature. Reference Sarathi, Sindhu, Chakravarthy, Sharma and Nagesh12–Reference Bora, Wong, Bhuyan, Lee, Yap and Favre19 Aluminum nanoparticles are one of the ultrafine powders produced by this technique. The wide range of applications of aluminum nanoparticles includes aerospace propulsion, underwater propulsion, propulsion of super-cavitating naval vehicles, powder metallurgy, thin film coatings, nanofluids, explosive formulations, thermal spray, and pigment and paint industries. Reference Kearns20 Most of the nanoaluminium dependent applications intend to utilize the enormous quantities of stored energy in the nanoparticles. Nanoaluminium is used in solid rocket boosters to increase the energy density of propulsion as well as to increase the payload. Military pyrotechnics is another potential application of nanoaluminium particles.
Thermodynamic analysis of melting behavior of Al nanoparticles produced by WEP is scarce in the literature. Hence, the present work is focused to produce Al nanoparticles by WEP and correlate its size dependent melting behavior and thermodynamic properties obtained, through DSC measurements, with the above properties analyzed by thermodynamic model developed. Nano aluminum particles are synthesized by exploding a thin aluminum wire in the argon ambience at different chamber pressures of 100, 50 and 25 kPa in the present work. The structural characteristics of nano aluminum particles, thus synthesized are investigated by using energy-dispersive analysis by X-rays (EDAX) and SEM analysis. The size and shape of the nano aluminum particles are characterized by TEM. The thermal behavior of the nano aluminum particles are measured by using thermo-gravimetric differential scanning calorimetry (TG-DSC). The particle size distribution is determined by adopting the log-normal probability distribution. A cohesive energy based unimodal thermodynamic model is adopted to understand the size dependent melting behavior of aluminum nanoparticles. The size dependent fusion enthalpy, cohesive energy and surface atom concentration are discussed from the perspectives of nanothermodynamics. Three modes of melting of aluminum nanoparticles namely, the homogeneous melting mode (HMM), the liquid skin melting (LSM) and the liquid nucleation and growth are studied. Thermodynamic model is used for rendering an insight in to the early condensation and nucleation rate of aluminum nanoparticles. On the basis of Kelvin’s relation for saturation ratio, an expression is derived for correlating the critical nucleus size with the explosion chamber pressure in WEP process. The effect of the saturation ratio on the particle size and saturation temperature is studied using the derived thermodynamic model.
II. EXPERIMENTAL STUDIES
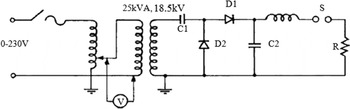
The basic electrical circuit for the wire explosion is shown in Fig. 1. The source charges the capacitor, which is then discharged through the thin wire. A voltage-doubler circuit is used to charge the capacitor to the required magnitude of voltage. The circuit functions like an RLC circuit, whose maximum delivered energy in a time period t is W = V × I × t where, V is the voltage across the thin conducting wire and I is the current flow through it at the time of the explosion. The stored energy in the capacitor is W = (1/2)CV 2, where C is the capacitance. The voltage appears across the thin exploding wire upon closing the switch S and the current increases, which ultimately melts the thin wire by Joule heating. The switch S is a high voltage trigatron-gap, L is the contribution of the lead inductance and internal inductance of the capacitor and R is the resistance of the exploding thin wire. The characteristic voltage across the resistance R and the current flowing through it were measured using the voltage probe (EP-50 k, PEEC. A, Japan) and the current probe (Pearson Electronics, USA Current transformer Model No-101), respectively as shown in Fig. S1.
Experimental setup.

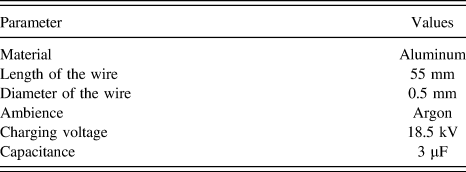
The factors that influence the particle size in the electrical wire explosion process include, capacitance and inductance of the basic electrical circuit, the polarity of the charging voltage, the length and diameter of the exploding wire, melting temperature of the exploding wire, the amount of energy deposited on the thin exploding wire, the thermal conductivity and the breakdown strength of the gas medium and its pressure inside the wire explosion chamber. The circuit parameters of the experimental setup used in the present study are described in Table I. The wire explosion was carried out in an ambience of argon (Ar) with different chamber pressures of 101.3, 50 and 25 kPa. Nanoparticle formation by wire explosion is fundamentally an adiabatic process. A large amount of Joule heating causes the thin wire to melt, followed by evaporation and subsequent ionization. The plasma during the explosion expands and condenses after interacting with the explosion chamber gas and finally nanoparticles are formed.
Circuit parameters used in wire explosion experiments.

A. Mechanism of nanoparticle formation by electrical wire explosion
The experimental set-up consists of three functional sections: (i) charging unit, (ii) discharging unit, and (iii) wire explosion unit. The charging unit is basically a DC source that charges a high energy capacitor bank. The discharging unit contains a trigatron switch S, and the wire explosion unit contains the exploding wire R placed inside a closed explosion chamber filled with an inert gas maintained at the required pressure.
Stage 1: The capacitor C is charged to the required voltage using the voltage doubler circuit. On closing of the switch S (in Fig. 1), the capacitor voltage appears across the thin exploding wire R and rises the current, the magnitude of which is controlled by the RLC circuit. The rise in the current causes Joule heating of the wire, which eventually melts and vaporizes the thin wire. The resistance and the inductance in the circuit decide the magnitude of current flow in the circuit. Reference Hayt, Kemmerly and Durbin21 In general, the RLC circuit responses can be divided as under-damped, critically damped and over-damped. In the present work, the circuit parameters satisfy the condition of an under-damped RLC circuit, where
 $${{{R^2}} \over {4{L^2}}} \;\lt\; {1 \over {LC}}$$
Then, the expression for the current flow in the circuit can be written as
 $$i\left( t \right) = {{E\exp \left( { - {{Rt} \over {2L}}} \right)} \over {\sqrt {{L \over C} - {{{R^2}} \over 4}} }}\sin \left\{ {\sqrt {{1 \over {LC}} - {{{R^2}t} \over {4{L^2}}}} } \right\}$$
This suggests that a capacitor with low L/C ratio is preferable for small energy-input time. The current waveform would be perfectly sinusoidal, if the exponential term in Eq. (2) is absent.
Stage 2: It is necessary to select appropriately the length and diameter of the thin conductor such that the energy deposited on the exploding wire is adequate to completely vaporize the wire. Also, the diameter of the wire should be chosen based on the requirement such that the current density is uniform across the radius a of the wire. When high current discharges through the exploding wire, the temperature of the wire increases due to Joule heating followed by melting and eventually reaching the boiling temperature of the wire and superheats, before the phase changes from liquid to gas. The material’s resistance during the heating stage is calculated from the introduced energy. An integral of the specific current action (h) is defined as Reference Sedoi, Mesyats, Oreshkin, Valevich and Chemezova22,Reference Anderson, Neilson and Chace23
 $$h = \int {{j^2}\,{\rm{d}}t} \approx {j^2}t$$
Then, with a heating time of t H = h/j 2 and at a constant current density, the introduced energy is W h = ϕh/ρ. Also the magnitude of W h depends on the current density as given in Eq. (4).
 $${{{\rm{d}}{W_{\rm{h}}}} \over {{\rm{d}}t}} = {\emptyset \over \rho }{j^2}$$
where j is current density in the wire, ϕ is the resistivity of the material and ρ is the density of the material. This indicates that the wire diameter and the current density are the major parameters in the wire explosion.
When the trigatron switch S is closed, a radius dependent magnetic pressure p(r) is developed along the radius because of the injected pulsative current I. The magnetic pressure developed at any point r along the radius is given by Reference Godbloed and Poedts24
 $$p\left( r \right) = {p_{\rm{c}}}\left( {1 - {{{r^2}} \over {{a^2}}}} \right)$$
where p c is the central magnetic pressure, which can be related to the current flow through the wire by
 $${p_{\rm{c}}} = {{{\mu _0}{I^2}} \over {4{\pi ^2}{a^2}}}$$
where μ0 is the magnetic permeability. The magnetic pressure is inversely proportional to the radius of the wire. Hence, the surface layer evaporates first and forms plasma before the explosion. Electrical conduction persists until the vapor is optically thick and radiation is emitted from the surface. A column of partially or fully ionized plasma is formed at this stage, which leads to magneto-hydrodynamic instability. The current density in the entire dimension of the exploding wire is assumed to be constant.
Stage 3: Once the wire evaporates completely, the plasma begins to expand in the ambient gas medium because of huge difference in the temperature between the ambient gas and the expanding plasma. The metallic vapor particles collide with the ambient gas particles, which are at room temperature. Consequently, the temperature of the vapor particles decreases rapidly to a value much lower than the boiling temperature of the metal. Finally, the plasma loses its extensive driving force. Hence, a low explosion chamber pressure allows a large volume of plasma expansion. This results in a low number concentration of the material during particle growth, producing fine nanoparticles.
III. MODELING STUDIES
A. Vaporization energy of thin wire
The amount of energy deposited on the thin wire influences the size of the nanoparticle formed by wire explosion. It is necessary to supply excess energy to the wire much higher than the sublimation energy to produce ultrafine particles. The energy deposition on the wire could be calculated from the measurement of voltage and current waveforms, which depends on the energy of vaporization of the material. The vaporization energy (W s) of the material can be calculated as Reference Tkachenko, Vorob’ev and Malyshenko25
 $${W_{\rm{s}}} = {C_{\rm{s}}} \cdot \Delta {T_{\rm{m}}} + {h_{\rm{m}}} + {C_{\rm{l}}} \cdot \Delta T + {h_{\rm{g}}}$$
where T m is the melting temperature of the wire, ΔT m = T m − T 0, ΔT = T − T m, C s is the heat capacity of the exploding wire, h m is the latent heat of melting, C l is the heat capacity of the molten metal and h g is the latent heat of evaporation of the wire material. The deposited energy in the conductor is W = (1/2)CV 2, where C is the capacitance and V is the voltage. The particle size reduces significantly with an increasing superheating of the metal, i.e., κ = W/W s. The sublimation energy of aluminum is 284 kJ/mol. In the present work, the value of k is varied from 1 to 3.
B. Size dependent melting of Al nanoparticles
The fact that the melting temperature of nanosolids depends on the particle size, has been well established both theoretically and experimentally. The melting point of nanosolids decreases with the decreasing crystallite size. Reference Qi26 Hence, it is very essential to give a physical explanation for the size dependent melting behavior of nanoparticles. A cohesive energy dependent model has been adopted for this purpose. The predictive capability of the model is justified by available experimental results. For a nanoparticle having n total atoms and N surface atoms, the total cohesive energy E tot can be given as
 $${E_{{\rm{tot}}}} = {E_0}\left( {n - N} \right) + {E_0}{N \over 2}$$
where E 0 is the cohesive energy per atom of the bulk material. The cohesive energy per mole can be formulated as
 $${E_{\rm{p}}} = {E_{\rm{b}}}\left( {1 - {N \over {2n}}} \right)$$
where E b = AE 0 and A is the Avogadro number. It is known that the melting temperature of a material is a linear function of cohesive energy. Reference Qi26 Since the cohesive energy of a nanosolid is a function of N/n, its melting temperature T nano, should also follow a similar relation as above i.e.,
 $${T_{{\rm{nano}}}} = {T_{{\rm{bulk}}}}\left( {1 - {N \over {2n}}} \right)$$
where T bulk is the bulk melting point of the material. It is observed from Eq. (10) that, the key to calculate the T nano is to obtain an expression for N/n, which is dependent on the size and shape of the nanosolid. For a spherical nanosolid, i.e., a nanoparticle having a diameter D containing the atoms of diameter d, the N/n value of a spherical nanoparticle becomes
 $${N \over n} = {{4d} \over D}$$
Now, the size dependent melting temperature for a spherical nanoparticle can be written as
 $${T_{{\rm{nano}}}} = {T_{{\rm{bulk}}}}\left( {1 - {{2d} \over D}} \right)$$
C. Melting modes of spherical nanoparticles
Though several theoretical models exist, thermodynamic model has many merits over other models and has been used by many researchers for understanding the melting behavior of metals and alloys. Different researchers have observed different variations in the melting temperature even for the same materials, which can be calculated easily by thermodynamic models. Reference Nanda27 Various expressions for the size dependent melting temperature can be derived by assuming different melting hypotheses that explain different variations. Even though the present work concentrates on understanding the thermodynamics and kinetics of spherical nanoparticles, the thermodynamic model can be extended to understand the size dependent melting behavior of non-spherical nanoparticles such as disc shaped, prismatic, cylindrical shaped, polyhedral shaped etc. Also, the cohesive energy dependent melting modes are consistent with molecular dynamic simulations.
Three different melting modes shown in Fig. S2 are analyzed in the present work. In one of the melting modes, the entire solid particle is assumed to become a molten droplet, which corresponds to homogeneous melting mode (HMM). There is no surface melting in this mode. Once the melting temperature is attained, the entire solid particle changes its phase to liquid instantaneously and the melting temperature of the nanoparticle according to this mode can be expressed as
 $${{{T_{{\rm{nano}}}}} \over {{T_{{\rm{bulk}}}}}} = 1 - {{4v} \over {\Delta {H_{\rm{f}}}D}}\left[ {{\gamma _{{\rm{sv}}}} - {\gamma _{{\rm{lv}}}}{{\left( {{{{\rho _{\rm{s}}}} \over {{\rho _{\rm{l}}}}}} \right)\!\!}^{{2 \mathord{\left/ {\vphantom {2 3}} \right. \kern-\nulldelimiterspace} 3}}} = 1 - {{{\beta _{{\rm{HMM}}}}} \over D}} \right]$$
and
 $${\beta _{{\rm{HMM}}}} = {{4v} \over {\Delta {H_{\rm{f}}}}}\left[ {{\gamma _{{\rm{sv}}}} - {\gamma _{{\rm{lv}}}}{{\left( {{{{\rho _{\rm{s}}}} \over {{\rho _{\rm{l}}}}}} \right)\!\!}^{{2 \mathord{\left/ {\vphantom {2 3}} \right. \kern-\nulldelimiterspace} 3}}}} \right]$$
where γlv and γsv respectively, are surface energies of liquid–vapor and solid–vapor interfaces of the material, ΔH f is the bulk latent heat of fusion, v is the specific volume, D is the nanoparticle diameter, ρs and ρl respectively are the densities of solid and liquid phases and T bulk is the bulk melting point.
The second melting mode that corresponds to liquid skin melting (LSM) is assumed to exist in some cases. According to LSM, a liquid layer forms over the solid core at a lower temperature that remains constant till the solid particle transforms completely in to liquid at the melting temperature. This is an isothermal process. The LSM expression for T nano, neglecting the skin thickness is given as
 $${{{T_{{\rm{nano}}}}} \over {{T_{{\rm{bulk}}}}}} = 1 - {{4{\gamma _{{\rm{sl}}}}v} \over {\Delta {H_{\rm{f}}}(D - 2\delta )}} = 1 - {{{\beta _{{\rm{LSM}}}}} \over {(D - 2\delta )}}$$
and
 $${\beta _{{\rm{LSM}}}} = {{4{\gamma _{{\rm{sl}}}}v} \over {\Delta {H_{\rm{f}}}}}$$
where γsl is the solid–liquid equilibrium surface energy. In the third mode of size dependent nanoparticle melting called liquid nucleation and growth (LNG) mode, a liquid layer nucleates on the surface of the nanoparticle and grows inwards with the increasing temperature. LNG mode of melting is not an isothermal process. The expression for T nano is given as
 $${{{T_{{\rm{nano}}}}} \over {{T_{{\rm{bulk}}}}}} = 1 - {{6v} \over {\Delta {H_{\rm{f}}}D}}\left[ {{\gamma _{{\rm{sv}}}} - {\gamma _{{\rm{lv}}}}{{\left( {{{{\rho _{\rm{s}}}} \over {{\rho _{\rm{l}}}}}} \right)\!\!}^{{1 \mathord{\left/ {\vphantom {1 3}} \right. \kern-\nulldelimiterspace} 3}}}} \right] = 1 - {{{\beta _{{\rm{LNG}}}}} \over D}$$
and
 $${\beta _{{\rm{LNG}}}} = {{6v} \over {\Delta {H_{\rm{f}}}}}\left[ {{\gamma _{{\rm{sv}}}} - {\gamma _{{\rm{lv}}}}{{\left( {{{{\rho _{\rm{s}}}} \over {{\rho _{\rm{l}}}}}} \right)\!\!}^{{1 \mathord{\left/ {\vphantom {1 3}} \right. \kern-\nulldelimiterspace} 3}}}} \right]$$
In the present work, aluminum nanoparticles are evaluated for all the three melting modes discussed above.
D. Condensation process
Once the wire is evaporated, the plasma–vapor–liquid mixture begins to expand in the explosion chamber due to huge differences in the temperatures, specific heats and pressures between the vapor and the chamber gas medium. For the same reason, the liquid droplet phase may exist for a negligible duration of time compared to the nucleation and growth period. Assuming spherical droplets, if S is the saturation ratio, then the growth rate of a droplet of radius s, ds/dt Reference Williams28 is
 $${{{\rm{d}}s} \over {{\rm{d}}t}} = - {K \over {{C_{{\rm{pv}}}}{\rho _{\rm{l}}}s}}\ln \left[ {1 + {{{C_{{\rm{pv}}}}} \over {\Delta {H_{{\rm{vap}}}}}}\left( {T - {T_{\rm{d}}}} \right)} \right]$$
where K is the thermal conductivity of the gas–vapor mixture, C pv is the heat capacity of the vapor at constant pressure, ΔH vap is the vaporization enthalpy, T d is the droplet temperature and T is the ambient gas temperature. Generally, inert gases are used inside the explosion chamber to avoid the oxidation of metal nanoparticles.
E. Nucleation process
The nanoparticle formation initiates with nucleation, wherein a distinct thermodynamic phase forms in the vapor phase. Nucleation may be homogeneous or heterogeneous depending on the site where it begins. The state of supersaturation provides the driving force for the nucleation of nanoparticles, affecting the free energy difference between the nucleating medium and the nanoparticle. The state of supersaturation arises when the aluminum vapor pressure exceeds the saturation vapor pressure, inside the explosion chamber. The free energy difference ΔG depends on the volume free energy and the interfacial free energy. The nuclei should attain a minimum radius, called the critical radius
 ${R^*}$
to become stable. The cluster with a size less than
 ${R^*}$
is unstable and fails to begin nucleation due to an uncompromised competition between its new surface and volume. When the nucleus is adequately large, ΔG becomes negative and drives the process of nucleation.
Reference Barnard29
For the case of nucleation of spherical nanoclusters from the vapor phase, the nucleation rate can be expressed as
Reference O’Hayre30
 $$\dot N = {{\alpha P} \over {\sqrt {2\pi M{R_{\rm{u}}}T} }}A_{\rm{m}}^*{N^*}$$
where R
u = 8.314 J/(mol K), α is the sticking coefficient, M is the molecular weight of nucleating species,
 $A_{\rm{m}}^ *$
is the molar area of the critical nucleus and
 ${N^*}$
is the number of critical nuclei at temperature T and vapor pressure P in a vapor–gas mixture having N
0 mol/m3 of aluminum vapor particles and is given by
 $${N^*} = {N_0}\exp \left\{ { - {{\Delta {G^*}} \over {{k_{\rm{B}}}T}}} \right\}$$
where k
B is the Boltzmann constant,
 $\Delta {G^ * }$
is the activation free energy i.e., the minimum energy required for the formation of a stable critical nucleus of radius
 ${r^ * }$
, and is expressed as
 $$\Delta {G^*} = {{16\pi } \over 3}{{\gamma _{{\rm{sv}}}^3} \over {{{\left( {{\rho _{\rm{s}}}{R_{\rm{c}}}T\ln S} \right)}^2}}}$$
where R c is the characteristic gas constant of aluminum vapor in J/(g K).
The sticking coefficient α is a constant between 0 and 1. It signifies the fraction of metallic vapor that adheres to the nucleus. If α = 0, the nucleus is perfectly reflective, i.e., no vapor molecules stick to the nanoclusters. If α = 1, the nucleus is perfectly adsorbing and all the impinging vapor molecules stick to the nucleus. In the current study, ideally adsorbing nanoclusters are assumed with α = 1.
F. Effect of explosion chamber pressure on spherical nanoparticles
Since the solidification of nanoparticles takes place in the inert gas medium inside the wire explosion chamber, there exists a mixture of vapors of Al and inert gas. To handle this complicated system of elements, certain assumptions are made (i) the aluminum vapor and inert gas mixture is assumed to be an ideal gas mixture (ii) the condensing aluminum droplets and the solid nuclei are spherical in shape (iii) the growth of solid nuclei due to coagulation is neglected owing to a high quenching rate (iv) density and hence the molar volume and surface tension are assumed to be the functions of temperature alone (v) vapor pressure equation is assumed to valid at elevated temperatures based on the experimental results.
1. Size dependent expression for saturation ratio
Since the gas–vapor and gas–particulate mixtures are aerosols, the Kelvin’s relation is applied to predict the size dependent saturation ratio. To maintain the equilibrium spherical surface, the pressure inside the particle may be substantially higher than the ambient pressure. The Kelvin’s relation is given as Reference Friedlander31
 $$\ln \left( {{P \over {{P_{\rm{s}}}}}} \right) = \ln \left( S \right) = {{2{\gamma _{{\rm{sv}}}}} \over {{r^*}}}{{{v_{\rm{B}}}} \over {{R_{\rm{u}}}T}}$$
where P is the vapor pressure of the metallic species, P
s is the saturation vapor pressure at temperature T, S is the saturation ratio, v
B is the molar volume of liquid aluminum and
 ${r^*}$
is the critical radius. This relation compares the increase in the vapor pressure of small particles with the planar surface of the bulk material. It signifies that the vapor pressure increases continuously with the decreasing particle size and this reduces the ability of small particles to serve as particulate nuclei.
2. Excess internal pressure of a spherical nanoparticle
In an aerosol of gas and fine solid particles, the pressure inside a solid fine particle is more than that in the gas phase. For a spherical particle of radius r, the pressure is uniform in each phase (particle and gas) up to the interface and the pressure jump is constant over the surface of separation. The effect is more significant for substances with large surface tensions such as liquid metals. The Laplace relation for excess pressure for the solid-vapor equilibrium is given as
 $${P_{\rm{B}}} - {P_{\rm{A}}} = \Delta P = {{2{\sigma _{{\rm{sv}}}}} \over {{r^*}}}$$
where P B and P A are the pressure inside the particle and pressure in the gas–vapor mixture respectively.
3. Expression for vapor pressure and saturation vapor pressure
Instead of using the ideal gas equation for predicting the vapor pressure, Eq. (25) is used which accounts for non-ideality as well and reproduces observed results with ±5% accuracy or better. Reference Brandes and Brook32 The comparison of the vapor pressure values above 1800 K based on this statistical relation with the experimental results Reference Alcock, Itkin and Horrigan33,Reference Haynes34 and vapor pressure data of elements, Reference Yaws35 has shown that the values are comparable as the error percentage is negligible. Hence, the same relation is extended to temperatures above 1800 K. The statistical vapor pressure relation is given as Reference Brandes and Brook32
 $${\log _{10}}(P) = A + {B \over T} + C\,{\log _{10}}T + {D \over {{T^3}}}$$
where T is temperature in Kelvin, P is vapor pressure is in atm and A, B, C and D are constants. For aluminum Reference Brandes and Brook32 in solid state: A = 9.459, B = 17,342, C = 0.7927, D = 0 and in liquid state: A = 8.911, B = 16,211, C = 0, D = 0.
The saturation pressure P s at any temperature T, is predicted by Clausius–Clapeyron equation as shown
 $${P_{\rm{s}}} = {P_0}\exp \left\{ {{{{H_{{\rm{LV}}}}(T - {T_{\rm{b}}})} \over {{R_{\rm{u}}}T{T_{\rm{b}}}}}} \right\}$$
where P 0 is the explosion chamber pressure, T b is the boiling point of the wire and H LV is the enthalpy of evaporation.
4. Temperature dependent density and surface energy of liquid aluminum
As discussed earlier, the density and the surface energy of aluminum are treated as functions of temperature alone. The relations for the density ρLV and the surface energy γLV are given respectively as Reference Brandes and Brook32
 $${\rho _{{\rm{LV}}}} = {\rho _{{\rm{bulk}}}} + (T - {T_{{\rm{bulk}}}}){{{\rm{d}}\delta } \over {{\rm{d}}T}}$$
and
 $${\gamma _{{\rm{LV}}}} = {\gamma _{{\rm{bulk}}}} + \left( {T - {T_{{\rm{bulk}}}}} \right){{{\rm{d}}\gamma } \over {{\rm{d}}T}}$$
where ρbulk and γbulk are the bulk density and the bulk surface energy at the bulk melting temperature T bulk. For aluminum, Reference Brandes and Brook32 ρbulk = 2.385 g/cc, T bulk = 933.15 K, dρ/dT = −0.28 mg/(cc K), γbulk = 0.914 N/m and dγ/dT = −0.35 mN/(m K).
5. Pressure dependent critical nucleation radius of Al nanoparticle
By rearranging the size dependent Kelvin’s relation [Eq. (23)] for a gas–particulate mixture and substituting Eq. (25) and Eq. (26) in it, the expression for chamber pressure dependent critical nucleus size is derived as
 $${r^*} = {{2{\gamma _{{\rm{sv}}}}\left( {{{{v_{\rm{B}}}} \over {RT}}} \right)} \over {\ln \left[ {{{{{10}^{\left\{ {A + {B \over T} + C\,\,{{\log }_{10}}\,\,T + {D \over {{T^3}}}} \right\}}}} \over {{P_0}\exp \left\{ {{{{H_{{\rm{LV}}}}(T - {T_{\rm{b}}})} \over {{R_{\rm{u}}}T{T_{\rm{b}}}}}} \right\}}}} \right]}}$$
The expression shows that there exists a direct proportionality between the critical radius of the nanoparticle and the explosion chamber pressure.
IV. RESULTS AND DISCUSSION
The particle size in the wire explosion process primarily depends on two factors: the energy deposited on the wire and super-heating of the wire. With the increasing superheating of the conductor, i.e., k = W/W s, the particle size in the wire explosion technique reduces substantially. In the present work, thin aluminum wire is exploded in an argon ambience at different chamber pressures, 1, 0.5 and 0.25 atm with k = 1, 2 and 3. Kotov Reference Kotov36 conducted extensive research and predicted the critical length of the wire exploding during wire explosion process. Umakoshi et al. Reference Umakoshi, Yoshitomi and Kato37 synthesized alumina nanoparticles and concluded that the increase in the energy deposited on the exploding wire reduces the particle size. Tokoi et al. Reference Tokoi, Suzuki, Nakayama, Suematsu, Jiang and Niihara38 synthesized TiO2 nanoparticles of lower dimension, with k = 50. Sarathi et al. Reference Sarathi, Reddy, Rashmi and Kamaraj39 carried out various physico-chemical studies on wire explosion synthesized nano-molybdenum carbide in methane ambience, by coating the conductor with paraffin and graphite mixture to increase the degree of carburization. Recently, Lerner et al. Reference Lerner, Alexander, Elena and Sergey40 detected the formation of solid solutions in binary metallic nanoparticles produced by electrical explosion of two twisted wires of Cu, Ag, Al and Pb.
When the current flows through the wire, it gets heated up due to Joule heating and finally explodes at the point of magnetohydrodynamic instability. Once exploded, the metallic vapor expands in to the ambient argon medium, forming a non-reactive mixture. The unstable gas–vapor mixture tries to attain thermal equilibrium by the hard-sphere collision of argon gas atoms and the vapor metal atoms, eventually forming a supersaturated vapor. The phase transformation from vapor to solid begins by nucleation of the aluminum nanoparticle, once the saturation ratio S becomes greater than unity. The growth of nuclei occurs due to coagulation of the nuclei, which collide with each other by Brownian motion. Reference Flagan and Lunden41 The variation of temperature dependent model vapor pressure that accounts even for the non-ideal behavior of the gas–vapor mixtures, is as shown in Fig. S3(a). The model vapor pressure formulation Eq. (25) values are in close agreement with the experimental values with an error percentage of less than −2%, indicating that the model predictions are comparable with the experimental values. Figure S3(b) shows the error percentage of the vapor pressure predicted by Eq. (25) for Al, as a function of temperature.
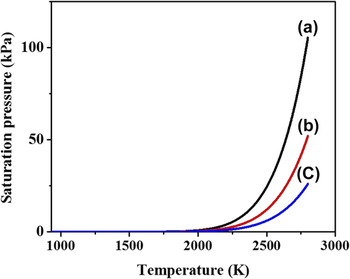
It is clear from Fig. 2 that the saturation pressure [Eq. (26)] of Al decreases with a decrease in the explosion chamber pressure. It also infers that the lower saturation pressure favors lower saturation temperatures, i.e., nucleation begins at lower chamber pressures earlier than higher chamber pressures.
Saturation vapor pressures versus temperature at (a) 1 atm (b) 0.5 atm and (c) 0.25 atm.

The temperature dependent variations of molar volume and surface tension for liquid aluminum, as predicted respectively by Eqs. (27) and (28) are as shown in Fig. S4.
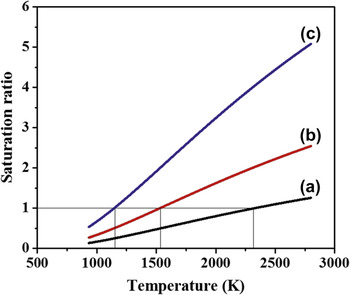
The variation of, molar volume of aluminum is directly proportional to the temperature and its surface tension varies inversely and linearly with the temperature. The effect of explosion chamber pressure can be understood by the saturation ratio versus temperature plots at different chamber pressures as shown in Fig. 3. It is evident from Fig. 3 (curve-a) that, the saturation temperature is 2332 K at a chamber pressure of 1 atm. At a chamber of 0.5 atm, the saturation temperature is 1533 K as shown in Fig. 3 (curve-b). It is observed from Fig. 3 (curve-c) that, at 0.25 atm chamber pressure, S = 1 at 1147 K. Hence, it is evident that the reduction in chamber pressure decreases the saturation temperature. During the expansion of metallic aluminum vapor, the condition S = 1 can be attained at a lower temperature by a low pressure chamber earlier than a higher pressure chamber. Hence, the supersaturation and consequently the nucleation starts more quickly at a lower explosion chamber pressure.
Variation of saturation ratio with temperature at (a) 1 atm (b) 0.5 atm (c) 0.25 atm.

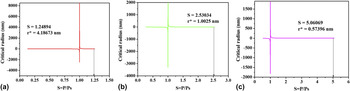
The nucleation of the aluminum nanoparticles begins inside the explosion chamber, when the vapor pressure of aluminum exceeds the saturation pressure at the same temperature. When the vapor pressure equals the saturation pressure, both the vapor and liquid are in equilibrium and there exists no surface or interface between the two phases. Hence, the critical radius of the particle at S = 1 takes a value of infinity as shown in Fig. 4. In a physical sense, there exists no spherical nucleus at this condition. As the vapor pressure of aluminum is increased beyond its saturation pressure, the saturation ratio increases, leading to the formation of nuclei. The system tries to reduce its free energy by forming interfaces. The value of critical radius is negative as long as the saturation ratio, S < 1. The negative critical radii indicate absence of nuclei. As S becomes more than 1, the critical radius takes a positive non-zero value. As the saturation ratio increases, the activation free energy decreases as predicted by Eq. (22) and hence the critical radius of nanoparticles decreases as predicted by Eq. (29). Added to higher S, few other factors contribute to size reduction, such as, increased number of participating vapor atoms due to higher saturation ratio and decreased mean free path of the interacting particles.
Critical particle size versus S at 2790 K for (a) 1 atm (b) 0.5 atm and (c) 0.25 atm.

For a reference temperature 2790 K i.e., the boiling point of aluminum, the critical droplet radii are analyzed with 1, 0.5 and 0.25 atm chamber pressures using Eq. (29).
It can be inferred from the plots shown in Figs. 4(a)–4(c) that, as the chamber pressure decreases, the saturation ratio increases and hence the critical radius of the nucleus decreases. It is observed that, for the same temperature of reference, the saturation ratio in the lower pressure explosion chamber is higher compared to higher pressure chambers. Also, it is indicative from the plots that, the reduction in chamber pressure brings down size of the critical radius of nuclei, by the virtue of decreased free energy of activation.
Figure S5 shows the dependence of the metallic vapor impingement on the temperature. The term
 $P/\sqrt {2\pi M{R_{\rm{u}}}T}$
in Eq. (20) represents the atomic impingement of the aluminum vapor. It signifies the number of moles of Al impinging on a unit area of a growing embryo of aluminum, in a unit time.
The impingement effect increases with the increase in temperature since the diffusivity of aluminum atoms increases with temperature. Thus, the nanoparticles that solidify at higher temperature are coarser than the nanoparticles that solidify at lower temperatures. This temperature dependent impingement contributes to unimodal size distribution in the synthesis of nanoparticles by the wire explosion process. At lower temperatures, the temperature gradient is more for a nucleus and it gets quenched rapidly. Due to higher temperature difference between the ambient argon gas and the aluminum vapor particles, the cooling rate is extremely high. At higher cooling rates, the nucleation rate is more and there will be a proportionate reduction in the nucleus size. Hence, for the same reference saturation ratio, the metallic vapor that solidifies at lower temperatures will be finer than those solidifying at higher temperatures.
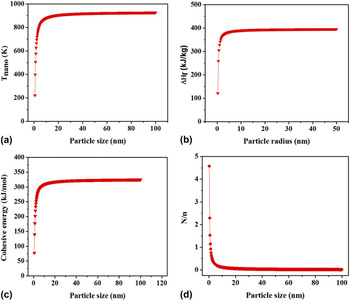
The model predicts that the melting temperature of a 50 nm aluminum nanoparticle is 649.23468 °C as shown in Fig. 5(a), the bulk melting point of which is 660 °C. According to the thermodynamic model, enthalpy of fusion of 50 nm aluminum particles is 395.62222 kJ/kg as described in Fig. 5(b). The experimental value of bulk aluminum 397 kJ/kg and the value calculated is 1.37778 kJ/kg less because of the size effect. The bulk cohesive energy of aluminum is 327 kJ/mol whereas the model confirms a cohesive energy of 323.25912 kJ/mol as indicated in Fig. 5(c), which can be attributed to the particle size reduction. The model justifies that increasing the number of surface atoms leads to an increase in the surface energy due to the increased number of dangling bonds. The increase in the number of dangling bonds is caused by a reduction in the cohesive energy that holds the adjacent atoms intact. As a consequence of this, the coordination number gets decreased. From Fig. 5(d), it is clear that for just 2.288% of surface atoms at a particle size of 50 nm, the melting point is reduced by 10 °C.
(a) T nano versus particle size (b) ΔH f versus particle radius (c) cohesive energy versus particle size (d) N/n versus particle size.

The straight lines in Fig. S6(a) and S6(b) are the size dependent fingerprints of materials. It can be observed in Fig. S6(a) that the slope of the straight line in the T nano versus the N/n is equal to −T bulk/2. For aluminum, it is −466.5 K. Also from Fig. S6(b), it is evident that the slope of the linear graph of T nano versus d/D is equal to −2T bulk. For aluminum, it is −1866 K.
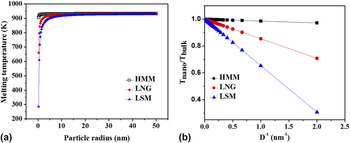
In this liquid skin melting mode, the liquid skin thickness being negligible compared to the particle size is assumed to be zero. Figure 6(a) shows the behavior of the HMM, LSM and LNG modes of melting with the varying particle size. It can be inferred from the collective plots in Fig. 6(b) that, in the liquid skin melting (LSM) mode the variation of size dependent temperature with respect to inverse particle diameter is the maximum of all the melting modes. The maximum slope for LSM can be attributed to the assumption that, the liquid skin thickness is zero.
Consolidated (a) melting point versus particle radius and (b) T nano/T bulk versus inverse particle diameter for HMM, LNG and LSM.

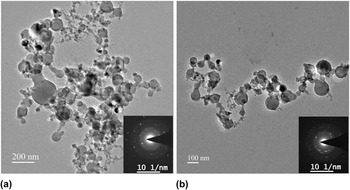
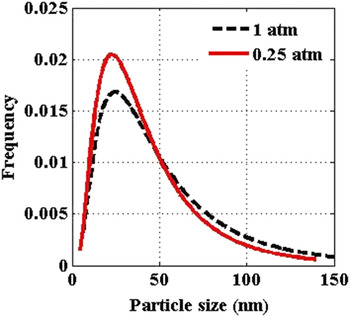
Figure 7 shows the TEM images of the aluminum nanoparticles produced in the argon ambience when k = 1 at 1 atm pressure [Fig. 7(a)] and when k = 1 at 0.25 atm pressure [Fig. 7(b)]. The TEM images confirm that the aluminum nanoparticles produced are spherical in shape. The particle size lies in the range of 5–150 nm. Also, it is observed that the particle size follows a lognormal distribution at various pressures as shown in Fig. 8. The mean particle size reduces with the decrease in pressure which is indicated by the lognormal peak shift toward lower particle size.
TEM images of aluminum nanoparticles produced at: (a) 1 atm and (b) 0.25 atm for k = 1 with respective diffraction patterns.

Lognormal size distribution of the aluminum nanoparticles at 1 and 0.25 atm pressures for k = 1.

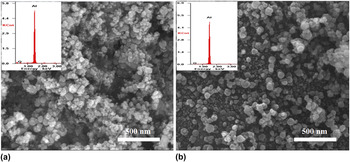
The inset diffraction patterns in Figs. 7(a) and 7(b) show that the aluminum nanoparticles synthesized by wire explosion technique are crystalline and retain FCC crystal structure. The SEM results [Figs. 9(a) and 9(b)] show the morphology of the synthesized aluminum nanoparticles. The SEM images vindicate that the electrical wire explosion generates spherical aluminum nanoparticles, substantiating the TEM results. The oxygen peaks in the inset EDAX results in Figs. 9(a) and 9(b) infer the surface oxidation of nanoparticles on exposure to the atmosphere.
SEM images of aluminum nanoparticles produced at: (a) 1 atm and k = 1 and (b) 0.25 atm and k = 3 with respective EDAX results.

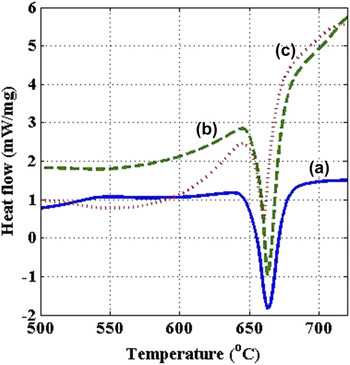
It can be observed from the DSC results shown in Fig. 10 that, the melting point of the nanopowder shifts to the lower temperatures as the explosion chamber pressure decreases and the energy deposition increases, which is indicated by the leftward shift of the DSC peaks. Further, it can be inferred that, the enthalpy of fusion of the aluminum nanoparticles decreases with the increase in energy deposition and the decrease in the chamber pressure as indicated by the DSC peak areas. As the unimodal lognormal curve of the particle size distribution shifts to the left with the decrease in chamber pressure (as shown in Fig. 8), the minimum particle size in the nanopowder reduces further. By the virtue of the presence of very fine nanosized particles, the melting onset temperature also decreases with the decrease in chamber pressure.
DSC curves for aluminum nanoparticles produced at (a) k = 1 at 1 atm, (b) k = 2 at 0.5 atm and (c) k = 3 at 0.25 atm.

In the TGA results shown in Fig. S7, the nanopowders pertaining to the corresponding chamber conditions experienced a weight loss of 1–4% in the temperature range of 100–450 °C. The weight loss is observed to be decreasing with the decreasing pressure and the increasing energy deposition. Above 450 °C, the TGA curves exhibit a weight gain due to the reaction of heated aluminum nanopowders with the nitrogen ambience during the thermal analysis, forming aluminum nitride. The weight gain is observed to increase with the increasing energy deposition and pressure, owing to the particle size reduction and thereby increasing surface area of the nanopowders.
V. CONCLUSION
Nano aluminum particles are synthesized using thin Al wire through electric wire explosion process with varying process conditions in an argon ambience. Thermal behavior of Al nanoparticles produced by WEP is investigated both by experiments and thermodynamic modeling in the present work. The structural features of Al nanoparticles are characterized by SEM and TEM. The following conclusions are made based on the present study.
-
(1) Experimental results have shown that the particle size of the nanopowders depends on the explosion chamber pressure and the amount of energy imparted to explode the wire. The nanoparticle size follows a lognormal distribution and the size range is few nm to 100 nm, which is confirmed by the TEM studies. The TEM study also suggests that, the nanoparticles produced are spherical in shape and the mean particle size decreases with the decrease in explosion chamber pressure. The diffraction patterns elucidate that the synthesized nanoparticles are crystalline in nature.
-
(2) The SEM study substantiates that the Al nanoparticles synthesized are spherical. The EDAX peaks show the surface activity (contamination) of aluminum nanoparticles when exposed to ambient conditions.
-
(3) The differential scanning calorimetric study confirms that, the enthalpy of fusion of the aluminum nanoparticles and hence the melting temperature decreases with the decrease in the particle size. As the minimum particle size decreases with the amount of energy deposition, the onset melting temperature also decreases. The minimum particle size in the nanopowders can also be reduced by decreasing the chamber pressure. The combined effect of the decreased chamber pressure and the increased energy deposition yields very fine particles and narrows down the lognormal distribution curve.
-
(4) The thermogravimetric analysis suggests that the catalytic activity of nanoparticles increases with the reduction in particle size. The increased reactivity of the nanoparticles is attributed to the increased surface area.
-
(5) Analysis based on size dependent thermodynamic model has shown that the melting behavior, melting modes of the aluminum nanoparticles are different from that of the bulk Al. It is observed that the saturation pressure of aluminum decreases with a decrease in the explosion chamber pressure. The activation free energy of nucleation decreases with the increasing saturation ratio due to the decreased mean free path of the interacting vapor particles.
-
(6) The thermodynamic analysis of nanoparticles generated during WEP has shown that for the same temperature, the saturation ratio in the lower explosion chamber pressure is higher compared to higher chambers pressures. The impingement effect increases with the increase in temperature as the diffusivity of aluminum atoms increases with temperature. The model suggests that the increasing number of surface atoms with the particle size reduction contributes to the decrease in fusion enthalpy, melting temperature and cohesive energy.
Supplementary Material
To view supplementary material for this article, please visit https://doi.org/10.1557/jmr.2016.507.