1. INTRODUCTION
In today's highly competitive markets, products manufactured by rivals become almost homogeneous from quality and price perspectives. In such markets, to differentiate from rivals and to leverage competition capabilities, an increasing number of companies try to provide better pre- and after-sales services for their customers (Penttinen & Palmer, Reference Penttinen and Palmer2007; Johnson & Mena, Reference Johnson and Mena2008; Bijvank et al., Reference Bijvank, Koole and Vis2010; Rezapour & Farahani, Reference Rezapour and Farahani2014; Rezapour et al., Reference Rezapour, Allen and Mistree2016a, Reference Rezapour, Allen and Mistree2016b; Hasani & Khosrojerdi, Reference Hasani and Khosrojerdi2016; Mohammaddust et al., Reference Mohammaddust, Rezapour, Farahani, Mofidfar and Hill2017; Rezapour et al., Reference Rezapour, Farahani and Pourakbarin press). This marketing strategy has been called “servitization” in the literature (Vandermerwe & Rada, Reference Vandermerwe and Rada1988). Product-service system is introduced by Baines et al. (Reference Baines, Lightfoot, Evans, Neely, Greenough and Peppard2007) as a special case of servitization. Servitization motivates the customers to buy and stimulates demand. In the competitive markets with homogeneous products (from quality and price facets), customers tend to buy from the rival providing better service commitment. To stimulate demand, service commitment must be guaranteed. To keep the brand reputation, actual service experienced by the customers in the pre- and after-sales markets can be higher than the commitment but should never be lower.
Servitization is an important marketing strategy for most of the pioneer manufacturers. For example Rolls-Royce supplies its jet engines to airlines under a service commitment to repair and maintain them for many years (Davies et al., Reference Davies, Brady and Hobday2006). Dell Company sells its laptops under a default hardware warranty that states “1 Yr Ltd Warranty, 1 Yr Mail-In Service, and 1 Yr Technical Support.” However, at the additional price of $119, customers are offered an optional 3-year warranty plan. After-sales services are critical in the automobile industry. Hyundai Company offers a 5-year/60,000 mile bumper to bumper and 10-year/100,000 mile powertrain protection warranty for all of its automobiles sold in United States. In the automobile industry, retailers of companies such as General Motor, Volkswagen, and Toyota provide sale, spare parts, service, and survey services (4S) for their customers (Li et al., Reference Li, Huand, Cheng, Zheng and Ji2014).
In the past, after-sales services were considered as a necessary cost generator, but today this role has been changed, and they are considered as a source of competitive advantages and business opportunity (Lele, Reference Lele1997). After-sales service is also considered as an important income resource. After-sales markets are usually four or five times larger than their corresponding products, and their profits are at least three times of the products’ (Bundschuh & Dezvane, Reference Bundschuh and Dezvane2003).
Because of all of these reasons, the number of companies providing after-sales services for their customers and servicing after-sales markets grows more and more every day. Gaiardelli et al. (Reference Gaiardelli, Saccani and Songini2007) highlight that supply chain and process-oriented literature dealing with after-sales services is very limited and overcoming obstacles of this industry, mainly related to relationships between involving entities, is necessary. As highlighted by Boone et al. (Reference Boone, Craighead and Hanna2008), Aberdeen Research Group (2008), Cohen and Agrawal (Reference Cohen and Agrawal2006), Wagner and Liedermann (Reference Wagner and Liedermann2008), and Bacchetti and Saccani (Reference Bacchetti and Saccani2012), in reality most of the mangers lament the lack of system perspective in servicing after-sales markets and the weakness of considering relationships of all operations (procurement, production, distribution, and inventory management) in the form of a supply chain. In this paper, we plan to fill this gap in the literature by considering all the after-sales operations and their responsible entities in the form of an after-sales supply network.
After-sales service capacity can be provided in two different ways. The first way is in-house, which means the company itself provides the requirements (such as spare parts availabilities and repair and service capacities) to fulfill the after-sales service request. This in-house capacity should be ready before the after-sales service demand realization, which is called prior service capacity. The second way is by providing after-sales service from an outsourcing market, which is usually called service spot market. In this case, service provision is done after demand realization (Kosnik et al., Reference Kosnik, Wong, Ji and Hoover2006). Although spot market is usually introduced as a hedge against service demand uncertainty, its cost and service capacity are inherently uncertain. That is why most of the companies with well-known brands prefer to use prior service capacity (in-house option) not only because it is more reliable but also because of intelligent property protection. These companies build suitable prior service capacity, which maximizes their expected profit. However, simultaneous dealing with product and service significantly complicates the operations of these companies. These companies deal with two supply chains: a forward supply chain producing and supplying products to markets, and an after-sales supply chain fulfilling after-sales service requests. The operations of these two supply chains are highly convoluted. For simplicity, these two chains are investigated separately in the literature. Based on Li et al. (Reference Li, Huand, Cheng, Zheng and Ji2014) and Johnson and Mena (Reference Johnson and Mena2008), supply chain literature is very sparse on the product-service system. Nordin (Reference Nordin2005) highlights that little academic research has been done on after-sales services in the manufacturing context. By simultaneous considering the forward and after-sales supply chains of a manufacturing company, we fill this gap of the literature.
Research on after-sales service covers the following streams:
-
• Maintenance and replacement activities to prevent systems’ failures (Rao, Reference Rao2011; Wang, Reference Wang2012; Park et al., Reference Park, Jung and Park2013; Shahanaghi et al., Reference Shahanaghi, Noorossana, Jalali-Naini and Heydari2013; Vahdani et al., Reference Vahdani, Mahlooji and Jahromi2013).
-
• Repair services in systems’ failures (Sleptchenko et al., Reference Sleptchenko, van der Heijden and van Harten2002; van Ommeren et al., Reference van Ommeren, Bumb and Sleptchenko2006; Rappold & Roo, Reference Rappold and Roo2009; Oner et al., Reference Oner, Kiesmuller and van Houtum2010; Sahba & Balcioglu, Reference Sahba and Balcioglu2011).
-
• Spare parts management to fulfill after-sales commitments (Thonemann et al., Reference Thonemann, Brown and Hausman2002; Chien & Chen, Reference Chien and Chen2008; Kleber et al., Reference Kleber, Zanoni and Zavanella2011; Lieckens et al., Reference Lieckens, Colen and Lambrecht2013). As mentioned by Boylan and Syntetos (Reference Boylan and Syntetos2010), spare parts are very varied and have different costs, demand pattern, and requirements. Therefore, classification of spare parts is critical for appropriate inventory management (Syntetos et al., Reference Syntetos, Boylan and Croston2005; Ramanathan, Reference Ramanathan2006; Zhou & Fan, Reference Zhou and Fan2006; Ng, Reference Ng2007; Kalchschmidt et al., Reference Kalchschmidt, Verganti and Zotteri2006).
-
• Appropriate warranty service selection (Huang et al., Reference Huang, Liu and Murthy2007; Chu & Chintagunta, Reference Chu and Chintagunta2009; Hartman & Laksana, Reference Hartman and Laksana2009; Wu et al., Reference Wu, Chou and Huang2009; Zhou et al., Reference Zhou, Li and Tang2009; Chen et al., Reference Chen, Li and Zhou2012; Su & Shen, Reference Su and Shen2012; Tsoukalas & Agrafiotis, Reference Tsoukalas and Agrafiotis2013).
-
• Managing customer relationships (Gupta & Lehmann, Reference Gupta and Lehmann2007). This research stream illustrates the value of understanding how marketing dollars affect customer profitability and why this focus may lead to very different conclusions than those obtained from traditional approaches.
-
• After-sales demand Prediction (Hua et al., Reference Hua, Zhang, Yang and Tan2007; Dolgui & Pashkevich, Reference Dolgui and Pashkevich2008; Gutierrez et al., Reference Gutierrez, Solis and Mukhopadhyay2008; Chu & Chintagunta, Reference Chu and Chintagunta2009; Barabadi et al., Reference Barabadi, Barabady and Markeset2014). Demand of large portion of spare parts is lumpy and intermittent, which requires a new forecasting method, and their demands depend on some explanatory variables such as a product's failure probability and a system's maintenance activities. This topic has a voluminous literature.
-
• Competition between new and remanufactured products in markets (Ferrer & Swaminathan, Reference Ferrer and Swaminathan2006; Atasu et al., Reference Atasu, Sarvary and Van Wassenhove2008; Mitra & Webester, Reference Mitra and Webster2008; Wu, Reference Wu2012).
-
• After-sales service competition (Kameshwaran et al., Reference Kameshwaran, Viswanadham and Desai2009; Kurata & Nam, Reference Kurata and Nam2010, Reference Kurata and Nam2013). This research stream is about modeling competition of rivals in a market by considering after-sales service as one of their marketing strategies.
-
• Configuration of after-sales networks (Amini et al., Reference Amini, Retzlaff-Roberts and Bienstock2005; Nordin, Reference Nordin2005; Saccani et al., Reference Saccani, Johansson and Perona2007; Khajavi et al., Reference Khajavi, Partanen and Holmstron2013). This research stream refers to how supply chain configuration is designed with respect to the activities carried out within it.
Based on this literature review, lack of holistic and process-oriented consideration in after-sales operations and ignoring interactions between forward and after-sales supply chains (product-service interplay) are clear. We fill this gap by concurrent planning of flow dynamics in all including entities of pre- and after-sales markets’ operations in the form of forward and after-sales supply chains. The other important factor that is considered in this paper is uncertainty management in the flow dynamics of the chains. Three uncertainties are mainly considered in the after-sales research:
-
1. Uncertainty in the failure time/rate of product/system to determine after-sales demand (Matis et al., Reference Matis, Jayaraman and Rangan2008; Rappold & Roo, Reference Rappold and Roo2009; Wang et al., Reference Wang, Chu and Mao2009; Wu et al., Reference Wu, Chou and Huang2009; Oner et al., Reference Oner, Kiesmuller and van Houtum2010; Rao, Reference Rao2011; Sahba & Balcioglu, Reference Sahba and Balcioglu2011; van Jaarsveld & Dekkrer, Reference van Jaarsveld and Dekker2011; Faridimehr & Niaki, Reference Faridimehr and Niaki2012; Su & Shen, Reference Su and Shen2012; Wang, Reference Wang2012; Lieckens et al., Reference Lieckens, Colen and Lambrecht2013; Park et al., Reference Park, Jung and Park2013; Vahdani et al., Reference Vahdani, Mahlooji and Jahromi2013; Barabadi et al., Reference Barabadi, Barabady and Markeset2014).
-
2. Uncertainty in the repair time of product/system (van Ommeren et al., Reference van Ommeren, Bumb and Sleptchenko2006; Rappold & Roo, Reference Rappold and Roo2009; Oner et al., Reference Oner, Kiesmuller and van Houtum2010; Sahba & Balcioglu, Reference Sahba and Balcioglu2011; Lieckens et al., Reference Lieckens, Colen and Lambrecht2013),
-
3. Uncertainty in the repair cost (Zhou et al., Reference Zhou, Li and Tang2009).
As seen above, most of the work in the literature does not include a holistic view and only concentrates on downstream of after-sales supply chains, such as repair demand and process and their corresponding uncertainties. They ignore the upstream production facilities producing and providing the requirements (such as spare parts) for the after-sales services. In this paper, we consider the upstream production facilities of the after-sales supply chain and their corresponding uncertainties. Three groups of uncertainties are considered in this problem: demand-side uncertainty, supply-side uncertainty, and uncertainty in the performances of the product's components. Demand-side uncertainty includes the uncertainty in the prediction of premarkets’ product demands and after-sales markets’ spare parts’ demands. Supply-side uncertainty includes imperfect production systems of production facilities such as suppliers and manufacturers, which lead to stochastic qualified outputs and supply quantities of these facilities. Supply-side uncertainties are mainly ignored in the literature of not only after-sales supply chains but also forward supply chains. However, this uncertainty is critical because there is not any perfect production system in reality and nonconforming production rates in the production systems have been increased recently due to higher production rates, which led to a higher number of machinery and labor failures (Sana, Reference Sana2010; Rezapour et al., Reference Rezapour, Allen and Mistree2015). In this paper, we fill this gap in the literature and bring supply-side uncertainties into consideration. We notice that in supply chains with multiple stochastic echelons, uncertainties propagate and accumulate by moving flow of products and spare parts from upstream to the downstream of the chains. These uncertainty propagations should be formulated throughout the networks of the forward and after-sales supply chains to quantify stochastic qualified supply quantities of product and spare parts. Introducing and modeling uncertainty propagation in stochastic supply chains and using it to quantify qualified supply quantities in the last echelon of their networks are the other contributions of this work.
All in all, in this paper we consider a company, including forward and after-sales supply chains with several demand and supply side uncertainties. In such a complex production system, we want to determine the best marketing strategies (such as price, warranty length, and service levels) and their preserving reliable flow dynamics in the supply chains. The contributions of this research in comparison with the literature are as follow:
-
• introducing and quantifying uncertainty propagation throughout the networks of stochastic forward and after-sales supply chains,
-
• finding the relationship between service levels of the supply chains and local reliabilities of their including facilities,
-
• finding the relationship between local reliabilities of facilities and their flow quantities, and
-
• proposing a comprehensive mathematical model for concurrent flow planning in the forward and after-sales supply chains and optimizing company's marketing strategies in the presence of demand and supply side uncertainties.
This paper is organized as follows: Section 2 includes detailed descriptions of operations and uncertainty sources in the supply chains, assumptions, and expected outputs. The modeling method and solution approach are proposed in Sections 3 and 4, respectively, and tested on a test problem from the engine industry in Section 5. Closing comments are offered in Section 6.
2. PROBLEM DEFINITION
In this problem, we consider a company producing and supplying products to objective premarkets through a forward supply network (SN). These products are sold to the customers under a specific retail price and warranty strategy. This product includes several key components that are produced by suppliers in the first echelon. These components are transported to manufacturers in the second echelon, and after assembling, final products are supplied to premarkets through retailers. The products are sold with a failure-free warranty, and all defective products returned by customers inside the warranty period should be fixed free of charge. Spare parts required to fix the returned products are provided by an after-sales SN. The after-sales SN has two echelons: the suppliers in the first echelon produce the required components to fix the returned products; and these parts are transported to the retailers in the second echelon for substitution and repair. The required products and spare parts to fulfill the premarket product demands and the warranty repair requests (called the after-sales market demands) of each sales period are produced in these forward and after-sales SNs and stored in the retailers before the beginning of that sales period.
Before the beginning of each sales period, the retailers order the required products of the premarkets and the spare parts of the after-sales markets from the manufacturers and suppliers, respectively. Based on the retailers' orders and performance of their production systems, the manufacturers order the required components from the suppliers. The suppliers receive the orders of the manufacturers and suppliers and, based on the performance of their own production systems, order the required materials from outside suppliers. We consider different uncertainties in modeling this problem: uncertainty in the pre- and after-sales market demands; uncertainty in the qualified supply quantities of the suppliers; stochastic flow deterioration in the intermediate manufacturing nodes; and uncertainty in the performance of the components. The demand uncertainties include uncertainty in the product demand prediction in the premarkets and the spare parts demands prediction in the after-sales markets to repair the defective products. The uncertainties of the supply and intermediate manufacturing facilities are related to imperfect production systems of these facilities, including a stochastic percent of nonconforming production. Thus, qualified flow deteriorates by moving from upstream to downstream in these networks, and this deterioration increases as the uncertainty propagates. In such complex production systems by considering all of these uncertainties, the following questions arise:
-
1. What are the best service levels for the whole forward and after-sales SNs?
-
2. What are the best local reliabilities for the SNs' stochastic facilities supporting their service levels?
-
3. What are the best material, component, and product flow through the SNs supporting the local reliabilities of the facilities?
-
4. What are the best price and warranty strategies for the company?
-
5. What are the correlations between the best marketing strategies (service levels, price, and warranty) of the company?
3. PROBLEM MODELING
Without loss of generality and for the purpose of modeling the problem, we consider a sample three-echelon forward SN including suppliers, manufacturers, and retailers. The modeling approach proposed here is applicable for any kind of network with any number of echelons. The notations used in this paper are summarized in Table 1. In Figure 1, a sample forward SN is shown with three suppliers (S = {s 1, s 2, s 3}), one manufacturer (M = {m 1}), and two retailers (R = {r 1, r 2}). The product of this SN includes two critical components, N = {n 1, n 2}. The first component is provided by a first group of suppliers, S (n 1) = {s 1, s 2}, including the first and second suppliers. The second component is provided by the thi.d supplier, which alone is considered as a second group of suppliers, S (n 2) = {s 3}. Flow streams of components starting from the suppliers in the first echelon are assembled in the manufacturer and as final products transported to the retailers in the last echelon to supply to the markets. In the structure of the forward SN, there are several potential paths that can be used to produce and supply products to the markets.
Potential paths in the structure of the sample forward supply network.

Notations

In the sample SN of Figure 1, each path starts from a set of suppliers in the first echelon (one supplier for each component), passes through the manufacturer in the intermediate echelon, and ends at a retailer in the last echelon. The potential paths of the sample forward SN are shown in Figure 1. Here each path corresponds to a triple,
 $t = \lpar {s\comma \,{\acute {s}} \comma \, \; r} \rpar \; \forall s \in S^{\lpar {n_1} \rpar }\comma \, \; \forall {\acute {s}} \in S^{\lpar {n_2} \rpar }\comma \hbox{and}\; \forall r \in R$
. It includes the starting suppliers of the first and second components and the ending retailer. As there is a single manufacturer in this example, it is not included in the path definition. However, this must be considered in a problem with several manufacturers.
Using the concept of path in modeling this problem helps us to be able to use the developed mathematical model for any kind of networks after little manipulation. In a different network, we only need to modify the definition of path and apply it in a same way in the mathematical model.
The set of potential paths for the sample SN of Figure 1 is T = {t
1 = (s
1, s
3, r
1), t
2 = (s
2, s
3, r
1), t
3 = (s
1, s
3, r
2), t
4 = (s
2, s
3, r
2)}. The most profitable subset of these paths must be selected to produce and supply the products to the premarkets. The products of this chain are supplied to the market with a specific price, p, and failure free warranty, w, strategies. Eventually, a stochastic percentage of the supplied products is returned by the customers to the retailers, and their defective components should be fixed free of charge. The components required to fix these defective products must be provided by the suppliers. We assume that the required components to fix the defective items supplied by a path should be provided by the corresponding suppliers of that path. For example, if we assume that t
1 is a selected active path in the sample forward SN in Figure 1 and its flow quantity is
 $x_{t_1} $
, then the required first and second components to repair the returned items of these
 $x_{t_1} $
products, which are represented by
 $\acute{x}^{\lpar {n_1} \rpar}_{t_1} $
and
 $\acute{x}^{\lpar {n_2}_{t_1} \rpar } $
, will be supplied directly by the associated suppliers of path t
1 (s
1 and s
3) to its ending retailer, r
1 (Fig. 2). Therefore, by determining the selected paths of the forward SN and their assigned flow quantities, the active paths of the after-sales SN and their corresponding flow quantities are determined automatically.
The after-sales services provided by the active path t 1.

In this problem, we consider demand- and supply-side uncertainties by assuming that demand prediction in the demand nodes is stochastic and the performance of the production systems in the supply and intermediate manufacturing facilities is imperfect. Imperfect production systems in the supply and manufacturing facilities means their qualified output quantities are stochastic. Having several uncertain echelons in the SN leads to a problem, which we call uncertainty propagation. Considering and quantifying this propagation of uncertainty is critical for determining service levels in the pre- and after-sales markets. The uncertainty propagation occurs through all the active paths of the networks. We display one of the paths of the forward SN as a sample in Figure 3. In the rest of this section, we describe the process of quantifying uncertainty propagation throughout this path of the forward SN.
Uncertainty propagation in path t 1 = (s 1, s 3, r 1) of the forward supply network.

3.1. Uncertainty propagation in the forward supply network
The pre- and after-sales markets’ service levels show the global reliabilities of the forward and after-sales networks against all the uncertainties and their propagated effect. The service levels that represent the capability of the networks in balancing the supply and demand quantities depend on the local reliabilities of the network's constituting facilities. In this problem, we introduce and use the concept of paths to produce and supply products and spare parts to the markets. Therefore, in this section (Section 3.1) and Section 3.2, respectively, we explain how to manage the flow in the paths of the forward and after-sales SNs against uncertainties. Then we use the outcomes of these sections in Section 3.3 to develop a comprehensive mathematical model to manage the performance of the entire system.
In this section, we elaborate a way to quantify uncertainty propagation and plan a reliable flow through the paths of the forward SN. The paths of the forward network include a retailer, a manufacturer, and suppliers (one supplier for each component). However, in each path of the after-sales SN, there are a retailer and suppliers (one supplier for each component; Fig. 2).
We assume that the local reliability of retailer r, manufacturer m, and supplier s are represented by rl r , rl m , and rl s , respectively. To quantify uncertainty propagation through each path, in Section 3.1.1 we start from the last echelon including a retailer, and then uncertainties of the manufacturer and suppliers are addressed in Sections 3.1.2 and 3.1.3.
3.1.1. Uncertainty management in the retailers
The company positions itself in the markets by choosing its pre- and after-sales service levels, warranty length, and retail price. The average product demand in market r,
 $\bar D_r \lpar {sl_p\comma sl_a\comma w\comma p} \rpar $
, in a sales period is an increasing function of the service levels, (sl
p
, sl
a
), and warranty length, w, and a decreasing function of price, p. However, the realized actual demand is stochastic and has a deviation from its mean. Consistently with Bernstein and Federgruen (Reference Bernstein and Federgruen2004, Reference Bernstein and Federgruen2007), we assume that the stochastic actual demand in a market is multiplicative as
 $D_r \lpar {sl_p}\comma \, \; sl_a\comma $
, where ε
r
is a general continuous random variable with a cumulative distribution function, G
r
(ε
r
), which is independent of the service levels, warranty length, and retail price. Without loss of generality, we assume E(ε
r
) = 1, which means
 $E\lsqb {D_r \lpar {sl_p\comma \, \; sl_a\comma \, \; w\comma \,\;p} \rpar } \rsqb = \bar D_r \lpar {sl_p\comma \,\;sl_a\comma w\comma \,\;p} \rpar $
.
Before the beginning of each sales period, retailer r (
 $\forall r \in R$
) orders the required products from the manufacturers. These products are provided by the active paths ending at this retailer,
 $\mathop \sum \nolimits_{T^{\lpar r \rpar }} x_t $
, before the beginning of the period. Additional product transactions during the period and after real demand realization are not possible. The demand of market r is stochastic, with G
r
(.) cumulative distribution function (demand-side uncertainty). Extra inventory and inventory shortage at the end of each sales period impose unit cost
 $h_r^ + $
and
 $h_r^ - $
to the retailer, respectively. Thus, subject to the local reliability of retailer r (rl
r
), the product ordering quantity of the retailer,
 $\mathop \sum \nolimits_{T^{\lpar r \rpar }} x_t $
, should be determined in a way to minimize its end-of-period total cost.
Product ordering quantity of retailer r is
min
 $$\eqalign{ \mathop {\prod} _r &= h_r^ +.\;E\left[ {\sum_{T^{\lpar r \rpar }} x_t - D_r \lpar {sl_p\comma \; sl_a\comma \; w\comma \;p} \rpar } \right]^ + \cr & \quad + h_r^ -.E\left[ {D_r \lpar {sl_p\comma \; sl_a\comma \; w\comma \;p} \rpar - \sum_{T^{\lpar r \rpar }} x_t} \right]^+\comma} $$
such that
 $$\hbox{Pr}\left[ {D_r \lpar {sl_p\comma \; sl_a\comma \; w\comma \;p} \rpar \le \sum_{T^{\lpar r \rpar }} x_t} \right] \ge rl_r. $$
The first term of the objective function (1) is the expected holding cost of the end-of-period extra inventory, and the second term is the expected shortage cost in retailer r. Therefore, the objective function is minimizing the total cost in the retailer. Constraint (2) preserves the local reliability of the retailer (Fig. 3). Minimizing the model's objective function without considering constraint (2) leads to
 $$\sum _{T^{\lpar r \rpar }} x_t = \bar D_r \lpar {sl_p\comma \; sl_a\comma \; w\comma \;p} \rpar \;.\;G_r^{ - 1} \left( {\displaystyle{{h_r^ - } \over {h_r^ - + h_r^ + }}} \right).$$
In addition, to preserve the local reliability of the retailer, we have
 $$\sum _{T^{\lpar r \rpar }} x_t \ge \bar D_r \lpar {sl_p\comma \; sl_a\comma \; w\comma \;p} \rpar \;.\;G_r^{ - 1} \lpar {rl_r} \rpar. $$
Accordingly, the best amount of the product should be ordered by the retailer is
 $$\sum _{T^{\lpar r \rpar }} x_t = \bar D_r \lpar {sl_p\comma \; sl_a\comma \; w\comma \;p} \rpar \;.\;G_r^{ - 1} \left( {\hbox{max} \left\{ {rl_r\comma \, \displaystyle{{h_r^ - } \over {h_r^ - + h_r^ + }}} \right\}} \right).$$
This order is distributed among the active paths ending at this retailer, and path t’s share from this order is x t (assuming that path t ends at retailer r). Therefore, x t products must be provided by the manufacturer of this path. In the next section, we study the manufacturer's performance with respect to the retailers’ order.
3.1.2. Uncertainty management in the manufacturers
The order share of each path should be produced by the manufacturer of that path. By assuming that path t is passing through manufacturer m, this manufacturer should produce x
t
qualified products for this path. However, the production system of the manufacturer is not perfect and is always accompanied with a stochastic percentage of defective items. To compensate for these defective items, the manufacturer should plan to produce some extra products represented by Δx
t
. The amount of Δx
t
depends on the local reliability of manufacturer m. The amount of Δx
t
should be determined in such a way that the manufacturer can be sure with rl
m
probability that it can fulfill the whole product order assigned to the path. The probability that the defective product quantity in the manufacturing process of path t’s ordered products, D
m,t
, will be less than Δx
t
should be equal to rl
m
(
 $\acute{G}_{m\comma \,t} $
is the cumulative distribution function assumed for D
m,t
):
 $$\Pr \lpar {D_{m\comma \,t} \le \Delta x_t} \rpar = rl_m \to \Delta x_t = \acute{G}_{m\comma \,t}^{ - 1} \lpar {rl_m} \rpar .$$
For example, if we assume that the defective production rate in manufacturer m is a stochastic variable, α m , uniformly distributed on [0, β m ], then the appropriate value of Δx t becomes
 $$\Pr \lpar {{\rm \alpha}_m. x_t \, \le \,\Delta x_t} \rpar = \Pr \left( {{\rm \alpha \;}_m \le \displaystyle{{\Delta x_t} \over {x_t}}} \right) = rl_m \to \; \,\Delta \,x_t = rl_m. {\rm \beta} _m. x_t.$$
To preserve its local reliability, rl m , the manufacturer plans to produce x t + Δx t products for path t. Accordingly, it should order x t + Δx t components from the suppliers of this path. In Section 3.1.3, we study the performance of path t’s suppliers with respect to the component orders received from the manufacturer.
3.1.3. Uncertainty management in the suppliers
We assume that supplier s is a supplier of path t. This supplier receives an order of x
t
+ Δx
t
component units from the manufacturer. However, we know that its production system is not perfect and has some nonconforming output. To compensate for these nonconforming items, the supplier plans to produce extra components,
 $\Delta \acute{x}_t^{\lpar s \rpar } $
. The amount of
 $\Delta \acute{x}_t^{\lpar s \rpar } $
depends on the local reliability of supplier s. Here,
 $\Delta \acute{x}_t^{\lpar s \rpar } $
ensures the supplier with rl
s
probability that it can fulfill the manufacturer's order. Therefore, the probability that the nonconforming component quantity in the production process of path t’s order,
 ${D_{s\comma t}} $
, is less than
 $\Delta \acute{x}_t^{\lpar s \rpar } $
and is equal to rl
s
(
 $G_{s\comma t}^{{\prime}{\prime}} $
is the cumulative distribution function assumed for
 ${D_{s\comma t}} $
):
 $$\Pr \big( D_{s\comma t} \le \Delta \acute{x}_t^{\lpar s \rpar} \big) = rl_s \rightarrow \Delta \acute{x}_t^{\lpar s \rpar} = G_{s\comma t}^{\prime \prime - 1} \lpar {rl_s} \rpar. $$
For example, if we assume that in the supplier after setting up the machines to produce the required components, they start to work in an in-control state in which all the produced components are qualified. Gradually, their state deteriorates, and after a stochastic time, they shift to an out-of-control state in which γ
s
percent of components is nonconforming. According to Rosenblatt and Lee (Reference Rosenblatt and Lee1986) and Lee and Rosenblatt (Reference Lee and Rosenblatt1987), we assume the deterioration time follows exponential distribution with 1 /
 ${{\rm \mu}_{s}}$
mean. After shifting to the out-of-control state, they stay in that state until the whole batch is completed because interrupting the machines is prohibitively expensive. To fulfill the component order of path t,
 $\Delta \acute{x}_t^{\lpar s \rpar } + \Delta x_t + x_t $
components should be produced by this supplier. By considering PR
s
as the production rate of the supplier, it takes
 $\displaystyle{\lpar{\Delta \acute{x}_t^{\lpar s \rpar } + \Delta x_t + x_t \rpar{\rm }}} $
/PR
s
time units to produce this batch. Assuming rl
s
as the supplier's local reliability, the probability that the quantity of nonconforming components produced during this time period is less than
 $\Delta \acute{x}_t^{\lpar s \rpar } $
should be equal to rl
s
. Thus, the probability that the conforming component quantity is greater than or equal to Δx
t
+ x
t
should be equal to rl
s
:
 $$\eqalign{& rl_{s} = {\rm Pr (conforming\;\;component\;\;units\;\;produced\;\;in}\;\cr & \quad\ {\displaystyle{\Delta \acute {x}_t^{\lpar s \rpar + \Delta x_t + x_t} \over {{\rm PR}_s}}}\; \hbox{time units} \ge \Delta x_t + x_t)\comma \cr & = \Pr \left[ {{\rm PR}_s\;.\; t + \lpar {1 - {\rm \gamma}_s} \rpar\,.\,{\rm PR}_s\;.\;}\right.\cr & \quad \, \left. \left( {\displaystyle{{\Delta {\acute {x}}_t^{\lpar s \rpar } + \Delta x_t + x_t} \over {{\rm PR}_s}} - t} \right) \ge \Delta x_t + x_t \right]\comma \cr & = \Pr \left[ t \ge \left( {\displaystyle{{\Delta x_t + x_t \;} \over {{\rm PR}_s}}} \right) - \left( {\displaystyle{{1 - {\rm \gamma}_s} \over {{\rm \gamma}_s\,.\,{\rm PR}_s}}} \right)\,.\,\lpar {\Delta {\acute {x}}_t^{\lpar s \rpar }} \rpar \right] \cr & = \hbox{exp}\left[ { - {\mu}_s\;.\; \left( {\left( {\displaystyle{{\Delta x_t + x_t \;} \over {{\rm PR}_s}}} \right) - \left( {\displaystyle{{1 - {\rm \gamma}_s} \over {{\rm \gamma}_s\;.\;{\rm PR}_s}}} \right).\left( {\Delta {\acute {x}}_t^{\lpar s \rpar }} \right) } \right)} \right] \comma} $$
 $$\; \to \; \; \Delta \acute{x}_t^{\lpar s \rpar } = \displaystyle{{{\rm \gamma} _s} \over {1 - {\rm \gamma} _s}} \left[ {\displaystyle{{\hbox{PR}_s} \over {{\rm \mu}_s}} \ln \lpar {rl_s} \rpar + \lpar {\Delta x_t + x_t} \rpar } \right].$$
This means that with this
 $\Delta \acute{x}_t^{\lpar s \rpar } $
extra production, supplier s will be sure with rl
s
probability that it can fulfill the order of the manufacturer.
To sum up, with
 $\Delta \acute{x}_t^{\lpar s \rpar } \; \lpar {\forall s \in t - \hbox{all the suppliers of Path}\; t} \rpar $
extra production, the suppliers of path t in the first echelon will be sure with
 $\mathop \prod \nolimits_{\lpar {\forall s \in t} \rpar } rl_s $
probability that they can fulfill the whole component order of this path's manufacturer. In addition, the manufacturer, by producing Δx
t
extra products, will be sure with rl
m
probability that it can fulfill the product order of the path's retailer. By ordering x
t
products from this path, the retailer will be sure with rl
r
probability that it can fulfill a xt
/
 $\!\mathop \sum \nolimits_{T^{\lpar r \rpar }} x_t $
portion of the corresponding premarket's demand in the coming sales period. The global reliability provided by this path is
 $$\eqalign{& \hbox{global reliability of path}\; t \cr & = \left( {\mathop {\prod} \limits_{\lpar {\forall s \in t} \rpar } rl_s} \right) \times rl_m \times rl_r \quad \lpar {\forall t \in T} \rpar .}$$
The demand of each premarket and the order of its corresponding retailer r can be fulfilled by all the potential paths ending at that retailer,
 $\forall t \in T^{\lpar r \rpar } $
. To determine the active paths of this set, we define binary variables
 $y_t \; \lpar {\forall t \in T} \rpar $
. Variable y
t
is 1 if potential path t is active and used to produce and supply products, and 0 otherwise.
Therefore, retailer r will be sure with
 $$\mathop {\prod} \nolimits_{\lpar {\forall t \in T^{\lpar r \rpar }} \rpar } \left[\!{\left(\!{\left( {\mathop {\prod} \nolimits_{\lpar {\forall s \in t} \rpar }\!rl_s} \right) \times rl_m \times rl_r} \right)\;.\;y_t + \lpar {1 - y_t} \rpar } \right] $$
probability that it can fulfill the demand of its corresponding market in the next sales period. Thus, the service level (demand fulfillment rate) of the forward SN in the premarket of retailer r will be
 $$\eqalign{& \hbox{premarket service level in retailer}\; r \cr & = \mathop {\prod} \limits_{\lpar {\forall t \in T^{\lpar r \rpar }} \rpar } \left[ {\left( \!{\left( {\mathop {\prod} \limits_{\lpar {\forall s \in t} \rpar } rl_s} \right) \times rl_m \times rl_r} \right).\;y_t + \lpar {1 - y_t} \rpar } \right]\; \cr & \quad \quad \quad \quad \quad \quad \quad \quad \quad \quad \quad \quad \quad \quad \quad \quad \quad \quad \quad \quad \quad \quad \quad \quad \quad \quad \quad \quad \quad \quad \lpar {\forall r \in R} \rpar .} $$
3.2. Uncertainty propagation in the after-sales supply chain
We assume that the after-sales services of the products supplied by a path to a market should be provided by the facilities of that path. The first step in planning flow dynamics of the after-sales SN is to predict the after-sales requests for the products of each path, Section 3.2.1. After determining the after-sales flow of each path, this flow is amplified from downstream to upstream to deal with uncertainty propagation in that path, Section 3.2.2.
3.2.1. After-sales demand prediction and spare parts order quantity by the retailer
Assume that x
t
products are supplied by path t ∈ T
(r) of the forward SN to the premarket of retailer r. The required components to repair the defective products of x
t
returned by the customers inside the warranty period is the after-sales demand for path t. Here, we compute the quantity of this demand for each component. This demand depends on the product quantity supplied by path t in the forward SN, the length of the warranty, and the reliability of the components represented by θ
n
 $\lpar {\forall n \in N} \rpar $
. We assume that the performance of the product's components is independent and the failure time of component n is a random variable with f
n
(θ
n
) density and f
n
(θ
n
) cumulative density function. Lower θ
n
means higher reliability for component n and longer time between failures. We assume the first λ
n
failures of component n are repairable, but after that it is more economical to replace it with a new one. The repair cost of component n is cr
n
. We assume that behavior of the components do not change after repair; the repaired and new components have similar breakdown behavior. Assuming that
 $F_n^{\lpar m \rpar } $
and Num
n
(w) represent the cumulative distribution function of total time up to the mth failure and the number of failures of component n in [0, w] interval, we have (Nguyen & Murthy, Reference Nguyen and Murthy1984)
 $$\Pr \lcub {{\rm Num}_n \lpar w \rpar = m} \rcub = F_n^{\lpar m \rpar } \lpar {w\comma \,{\rm \theta}_n} \rpar - F_n^{\lpar {m + 1} \rpar } \lpar {w\comma \,{\rm \theta}_n} \rpar \quad (\forall n \in N).$$
Then the average number of new component n required to repair a unit of product inside the warranty period, AD n (w, θ n , λ n ), is
 $$AD_n \lpar {w\comma \,{\rm \theta}_n\comma \, {\rm \lambda}_n} \rpar = \sum _{m = {\rm \lambda} _n + 1}^{ + \infty} F_n^{\lpar m \rpar } \lpar {w\comma \,{\rm \theta}_n} \rpar \quad (\forall n \in N).$$
In the same way, the variance of the number of new component n required to repair a unit of product inside the warranty period, VD n (w, θ n , λ n ), is
 $$\eqalign{ VD_n \lpar {w\comma \,{\rm \theta}_n\comma \, {\rm \lambda}_n} \rpar & = \sum _{m = {\rm \lambda} _n + 1}^{ + \infty} [ {2\,.\,\lpar {m - {\rm \lambda}_n} \rpar - 1} ]\,.\,F_n^{\lpar m \rpar } \lpar {w\comma \,{\rm \theta}_n} \rpar \cr & \quad - \Big[ {\sum_{m = {\rm \lambda}_n + 1}^{ + \infty} F_n^{\lpar m \rpar } \lpar {w\comma \,{\rm \theta}_n} \rpar } \Big]^2 \quad (\forall n \in N).} $$
By using the central limit theorem, the total component n required in the after-sales market of path t,
 $\acute{D}_t^n$
, has a normal distribution with the following features:
 $$\eqalign{& {\acute {D}} _t^n \sim {\rm normal}\lpar {{\rm \mu}_{{\acute{D}}_t^n}} = x_t\;.\; AD_n \lpar {w\comma \,{\rm \theta}_n\comma \, {\rm \lambda}_n} \rpar \comma \cr &{\rm \sigma}_{{\acute {D}}_t^n}^2 = x_t\,.\,VD_n \lpar {w\comma \,{\rm \theta}_n\comma \, {\rm \lambda}_n} \rpar \rpar \quad\lpar {\forall n \in N\comma \;\forall t \in T} \rpar .} $$
If path t ends at retailer r (r ∈ t) and its local reliability is rl r , the quantity of component n ordered by retailer r from path t is
 $$\eqalign{x_t^{{\rm {\prime}}\lpar n \rpar } = x_t\;.\; AD_n \lpar {w\comma \;{\rm \theta}_n\comma \; {\rm \lambda}_n} \rpar + & \left( {z_{rl_r}^{\prime}\;.\; \sqrt {x_t\;.\; VD_n \lpar {w\comma \;{\rm \theta}_n\comma \; {\rm \lambda}_n} \rpar }} \right)\;\cr & \quad \quad \quad \quad \quad \quad \quad \quad \quad \quad \quad (\forall n \in N).}$$
By ordering
 $x_t^{{\prime}\lpar n \rpar } $
units of component n, the retailer will be sure with rl
r
probability that it is able to fulfill the after-sales demand of component n for path t’s products.
3.2.2. Performance of the suppliers in the after-sales network
Retailer r not only orders x
t
(t ∈ T
(r)) products from the manufacturer of path t but also orders
 $x_t^{{\prime}\lpar n \rpar } \; \lpar {\forall n \in N} \rpar $
units of component n from the path's corresponding supplier s (s ∈ t and s ∈ S
(n)) providing component n for this path. Supplier s receives an order of Δx
t
+ x
t
. component units from the manufacturer of this path (forward SN) and an order of
 $x_t^{{\prime}\lpar n \rpar } $
component units from the retailer of this path (after-sales SN). Thus, the total order received by supplier s includes
 $x_t^{\prime \lpar n \rpar } + \Delta x_t + x_t $
component units. To compensate for the nonconforming output of its production system, it plans to produce extra components
 $\Delta \acute{x}_t^{\lpar s \rpar } $
. In Section 3.1.2, the quantity of
 $\Delta \acute{x}_t^{\lpar s \rpar } $
is determined by assuming that Δx
t
+ x
t
component order is received by this supplier. In addition to this order of the forward SN, another order with
 $x_t^{{\prime}\lpar n \rpar } $
quantity is received from the after-sales SN. In this section, we revise the quantity of
 $\Delta \acute{x}_t^{\lpar s \rpar } $
to consider the order of the after-sales SN:
 $$\eqalign{ rl_s & = {\rm Pr}( {\hbox{conforming component units produced in}} \cr & \quad \ {\displaystyle{{\Delta {\acute {x}} _t^{\left( s \right)} + x_t^{{\prime}\left( n \right)} + \Delta x_t + x_t{\rm \; }} \over {{\rm PR}_s}}\; {\rm time\; units} \ge x_t^{{\prime}\left( n \right)} + \Delta x_t + x_t} \big)\comma \cr & = \Pr \Big[ {{\rm PR}_s\,.\,t + \left( {1 - {\rm \gamma }_s} \right)\,.\,{\rm PR}_s\,.\,\Big( {\; \displaystyle{{\Delta {\acute {x}} _t^{\left( s \right)}\!+\!x_t^{{\prime}\left( n \right)} + \Delta x_t + x_t} \over {{\rm PR}_s}} - t} \Big)} \cr & {\quad\ \ge x_t^{{\prime}\left( n \right)} + \Delta x_t + x_t} \Big]\comma \cr & = \Pr \Big[ {t \ge \Big( {\displaystyle{{x_t^{{\prime}\left( n \right)} + \Delta x_t + x_t\; } \over {\rm PR}_s}}} \Big) - \left( {\displaystyle{{1 - {\rm \gamma }_s} \over {{\rm \gamma }_s\,.\,{\rm PR}_s}}} \right).\Big( {\Delta {\acute {x} _t^{\left( s \right)} } \Big)} \Big ] \cr & = {\rm exp}\Big[ { - {\rm \mu }_s\,.\,\Big( \!\!{\Big( {\displaystyle{{x_t^{{\prime}\left( n \right)} + \Delta x_t + x_t\; } \over {{\rm PR}_s}}} \Big) - \Big( {\displaystyle{{1 - {\rm \gamma }_s} \over {{\rm \gamma }_s\,.\,{\rm PR}_s}}} \Big).\Big( {\Delta {\acute {x}} _t^{\left( s \right)} } \Big)}\!\! \Big)} \Big]\comma} $$
 $$\to \Delta \acute{x}_t^{\lpar s \rpar } = \displaystyle{{{\rm \gamma} _s} \over {1 - {\rm \gamma} _s}} \left[ {\displaystyle{{{\rm PR}_s} \over {{\rm \mu}_s}} \ln \lpar {rl_s} \rpar + \lpar {x_t^{{\prime}\lpar n \rpar } + \Delta x_t + x_t} \rpar } \right].$$
This means that by this
 $\Delta \acute{x}_t^{\lpar s \rpar } $
extra production, supplier s is sure with rl
s
probability that it can fulfill the whole orders of the forward and after-sales SNs.
Thus, with
 $\Delta \acute{x}_t^{\lpar s \rpar } \; \lpar {\forall s \in t - s{\rm \; is\; supplying\; component\;} n} \rpar $
extra production, the supplier of path t is sure with rl
s
probability that it can fulfill the whole component n order of this path's retailer. By ordering
 $x_t^{{\prime}\lpar n \rpar } \; $
units of component n from the path's supplier, the retailer is sure with rl
r
probability that it can fulfill the whole after-sales demand of component n to repair the defective products of path t. Therefore, the fulfill rate of component n in path t is
 $$\eqalign{\hbox{fulfill rate of component} & \; n\; \hbox{in path}\; t\cr & = rl_s \times rl_r \quad \lpar {t \in T^{\lpar r \rpar }\comma \; s\in t} \rpar .}$$
There are n components in the product. The fulfill rate of all components by path t will be
 $$\eqalign{\hbox{fulfill rate of all} & {\hbox{components in path}} \; t \cr & = \mathop {\prod} \nolimits_{\lpar {\forall n \in N\comma \,s \in S^{\lpar n \rpar } \vert s \in t} \rpar } \lpar {rl_s \times rl_r} \rpar = \lpar {rl_r} \rpar ^{\vert N \vert }. \cr& \quad\, \mathop {\prod} \nolimits_{(\forall n \in N\comma \,s \in S^{\lpar n \rpar } \vert s \in t)} rl_s \; \; \; \lpar {t \in T^{\lpar r \rpar }} \rpar .} $$
The after-sales demand in retailer r is fulfilled by all the potential active paths ending at that retailer,
 $\forall t \in T^{\lpar r \rpar } $
. Therefore, the service level (demand fulfillment rate) of the after-sales SN in retailer r is
 $$\eqalign{& {\rm after - sales service level in retailer }r \cr & = \matrix{ {\prod\limits_{(\forall t \in T^{(r)})} {\left[ {\left( {{(rl_r)}^{\left\vert N \right\vert.}\prod\limits_{(\forall n \in N,s \in S^{(n)}\left\vert {s \in t} \right.)} {rl_s} } \right).y_t + (1 - y_t)} \right]} } \cr \quad \quad \quad \quad \quad \quad \quad \quad \quad \quad \quad \quad \quad \quad \quad \quad \quad \quad \quad \quad \quad \quad \quad {\left( {\forall r \in R} \right).} } } $$
3.2.3. Concurrent flow planning in the forward and after-sales supply networks
With the help of the equations formulated in Sections 3.1 and 3.2, in this section we develop a comprehensive mathematical model to simultaneously determine the best marketing strategies and their preserving flow dynamics throughout the forward and after-sales SNs. In reality, there are common options for the warranty length that are usually offered, such as 6, 12, 18, and 24 months. Therefore, in this problem, we define a new set, W = {w}, including all options available for warranty length. In the same way, we define a similar set for the service levels in the pre- and after-sales markets. Set SL = {sl = (sl
p
, sl
a
)} includes all possible options for the service level of the company in the pre- and after-sales markets. The options offered by the markets’ rivals and government regulations are considered in determining these sets. To make decisions about warranty and service levels strategy, we define two new binary variables v
w
and z
sl
. Variable v
w
is 1 if warranty w is selected, 0 otherwise
 $\lpar {\forall w \in W} \rpar $
. Variable z
sl
is 1 if service level sl is selected, 0 otherwise
 $\lpar {\forall sl \in SL} \rpar $
. The model of this concurrent planning is max
 $$\eqalign{& {\sum\limits_R {} \sum\limits _W \sum \limits_{SL} v_w\,.\,z_{sl}\,.\,\bar D_r \lpar {sl_p\comma \, \; sl_a\comma \, \; w\comma \;\,p}} \rpar. \cr & \quad \left[ {\,p - h_r^ +. E\left( {G_r^{ - 1} \left( {\hbox{max}\left\{ {rl_r\comma \, \displaystyle{{h_r^ -} \over {h_r^ + + h_r^ -}}} \right\}} \right) - {\rm \varepsilon}_r} \right)^{\!\!\! +}} \right. \cr & \left. {\quad - h_r^ - . E\left( {{\rm \varepsilon}_r - G_r^{ - 1} \left( {\hbox{max}\left\{ {rl_r\comma \, \displaystyle{{h_r^ -} \over {h_r^ + + h_r^ -}}} \right\}} \right)} \right)^ {\!\!\!+}} \right]\cr & \quad - \sum _N \sum _{S^{(n)}} \sum _{T^{(s)}} \lpar {a_1^s + a_2^s} \rpar\,.\big[ {x_t + \Delta x_t + x_t^{{\prime}\lpar n \rpar } + \Delta {\acute {x}}_t^{\lpar s \rpar }} \big]\cr & \quad - \sum _M \sum _{T^{(m)}} a^m\;.\; \lpar {x_t + \Delta x_t} \rpar} $$
 $$\eqalign{\quad & - \sum _S \sum _M \sum _{T^{(s)} \cap T^{(m)}} a_{sm}^t\,.\,\lpar {x_t + \Delta x_t} \rpar \cr \quad & - \sum _M \sum _R \sum _{T^{(m)} \cap T^{(r)}} a_{mr}^t\;.\; x_t \; \cr \quad & - \sum _N \sum _{S^{(n)}} \sum _R \sum _{T^{\lpar s \rpar } \!\mathop \cap \nolimits^ {T^{\lpar r \rpar}}} a_{sr}^t\,.\,x_t^{{\prime}\lpar n \rpar }\comma \;} $$
subject to
 $$\sum _W v_w = 1\comma\; \; $$
 $$\sum _{SL} z_{sl} = 1\comma\; \; $$
 $$\sum _{T^{\lpar r \rpar }} y_t \ge 1 \quad \lpar {\forall r \in R} \rpar \comma $$
 $$x_t \le BM\;.\;y_t \quad \lpar {\forall t \in T} \rpar\comma $$
 $$\eqalign{ \sum _{T^{\lpar r \rpar }} x_t & = \left[ {\sum_W \sum_{SL} v_w\,.\,z_{sl}\,.\,\bar D_r \lpar {sl_p\comma \, \; sl_a\comma \, \; w\comma \, \;p} \rpar } \right]. \cr & \quad\ \,G_r^{ - 1} \left( {\hbox{max}\; \left\{ {rl_r\comma \, \displaystyle{{h_r^ -} \over {h_r^ - + h_r^ +}}} \right\}} \right)\quad\lpar {\forall r \in R} \rpar \comma} $$
 $$\Delta x_t = G_{m\comma \,t}^{\prime - 1} \lpar {x_t\comma \, rl_m} \rpar\,.\,y_t \quad\;\lpar {\forall t \in T\comma \,\; m \in t} \rpar\comma $$
 $$\eqalign{x_t^{{\prime}\lpar n \rpar } = x_t\,.\,AD_n \lpar {w\comma \,{\rm \theta}_n\comma \, {\rm \lambda}_n} \rpar + z_{rl_r} ^{\prime}. & \sqrt {x_t. VD_n \lpar {w\comma \,{\rm \theta}_n\comma \, {\rm \lambda}_n} \rpar } \cr & \quad \quad \quad \quad \quad \quad \lpar {\forall t \in T\comma \,\; \forall n \in N} \rpar \comma}$$
 $$\eqalign{\Delta x _t^{{\prime}\lpar s \rpar } & = G_{s\comma \,t}^{{\prime \prime} - 1} \lpar {x_t + \Delta x_t + { {x}^\prime}_t^{\lpar n \rpar }\comma \, rl_s} \rpar\,.\,y_t \cr & \quad \quad \quad \quad \quad \quad \quad \quad \quad \quad \quad \quad \lpar {\forall t \in T\comma \,\; \forall n \in N\comma \,s \in t\comma \,\; s \in S^{\lpar n \rpar }} \rpar\comma }$$
 $$\eqalign{\sum _{SL} z_{sl}\,.\,sl_p & = \mathop \prod \limits_{\lpar {\forall t \in T^{\lpar r \rpar }} \rpar } \left[ {\left( {\left( {\mathop \prod \limits_{\lpar {\forall s \in t} \rpar } rl_s} \right) \times rl_m \times rl_r} \right)\;.\;y_t + \big( {1 - y_t} \big) } \right] \cr & \quad \quad \quad \quad \quad \quad \quad \quad \quad \quad \quad \quad \quad \quad \quad \quad \quad \quad \quad \quad \quad \quad \quad \quad \quad \quad \quad \quad \lpar {\forall r \in R} \rpar \comma}$$
 $$\eqalign{\sum _{SL} z_{sl}\,.\,sl_a & = \mathop \prod \limits_{\lpar {\forall t \in T^{\lpar r \rpar }} \rpar } \Bigg[ {\Bigg( {\lpar {rl_r} \rpar^{\vert N \vert }. \mathop \prod \limits_{(\forall n \in N\comma \,s \in S^{\lpar n \rpar } \vert s \in t)} rl_s} \Bigg)\,.\,y_t + \lpar {1 - y_t} \rpar } \Bigg] \cr & \quad \quad \quad \quad \quad \quad \quad \quad \quad \quad \quad \quad \quad \quad \quad \quad \quad \quad \quad \quad \quad \quad \quad \quad \quad \quad \quad \quad \lpar {\forall r \in R} \rpar\comma }$$
 $$v_w\comma \, \; z_{sl}\comma \, \; y_t \in \lcub {0\comma \,1} \rcub \quad \lpar {\forall w \in W\comma \,\; \forall sl \in SL\comma \,\; \forall t \in T} \rpar\comma $$
 $$x_t\comma \, \; \Delta x_t\comma \, \; \Delta \acute{x}_t^{\lpar s \rpar } \comma \, x_t^{{\prime}\lpar n \rpar } \ge 0\quad\lpar {\forall t \in T\comma \,\; \forall s \in S\comma \,\; \forall n \in N} \rpar \comma$$
In these equations, BM is a large constant. The first term of the objective function (20) represents the profit that can be captured in the premarkets. This term is equal to the income minus the shortage and holding cost of the inventory shortage and extra inventory at the end of the sales period. The second term is the sum of procurement and production costs in the suppliers. Manufacturing costs of the products in the manufacturers is computed in the third term. The fourth, fifth, and sixth terms compute the sum of transportation costs of the forward SN's components from the suppliers to the manufacturers, the forward SN's products from the manufacturers to the retailers, and the after-sales SN's components from the suppliers to the retailers. This objective function maximizes the net profit of the whole company.
Based on constraints (21) and (22), only one warranty and service level strategy can be selected by the company. Constraint (23) ensures that at least one path is activated to fulfill the demand of each market. According to constraint (24), product flow is only possible in the activated paths. Based on constraint (25), the sum of the product flow through the paths ending at a retailer is equal to the premarket demand of that retailer. Constraint (26) shows flow amplification in the manufacturer of each path. Constraint (27) is used to calculate the component requests of each path in the after-sales markets. Constraint (28) represents flow amplification in the suppliers of each path. Based on constraint (29), local reliabilities assigned to the facilities must preserve the company's selected premarket service level. In the same way, local reliabilities assigned to the facilities should preserve the company's selected after-sales service level [constraint (30)].
This mathematical model determines the best warranty and service level strategies in the pre- and after-sales markets and their preserving local reliabilities and flow in the system's facilities to maximize the company's total profit. The model developed for this problem is based on some assumptions. These assumptions either have been used extensively in the literature or are justifiable as below:
-
• We assume that the average product demand in market r,
 $\bar D_r \lpar {sl_p\comma \; sl_a\comma \; w\comma \; p} \rpar $
, in a sales period is an increasing function of the service levels, (sl
p
, sl
a
), and warranty length, w, and a decreasing function of price, p. Finding this demand function for each market is straightforward. We can analyze historical quadruples of (price, service levels, warranty, and average demand) in the previous sales periods by regression methods and fit an appropriate function that can be used for future sale periods as an estimation of average demand.
-
• We assume that the number of defective units in the production systems of facilities has a known distribution function. Finding this distribution function for a production system is straightforward. We only need to gather some historical data about the number of defective units in the production batches of that production system in the last couple of days. Then we can use statistical tools such as goodness of fit tests to fit the most appropriate distribution function to represent the number of defective units.
In Sections 3.1.2, we assume that the defective production rate in manufacturer m is a stochastic variable with a known cumulative distribution function shown by
$\acute{G}_{m\comma \,t} $
[see Eq. (3)]. Then only as an example we show that how these equations can be applied for uniform distribution [see Eq. (4)]. In Sections 3.1.3, we assume that the nonconforming component quantity in supplier s is a stochastic variable with a known cumulative distribution function shown by
$G_{s\comma \,t}^{{\rm ^{\prime \prime}}} $
[see Eq. (5)]. Then only as an example we show how these equations can be applied when deterioration time is exponential [see Eq. (7)]. This means the method proposed in the paper is general and does not depend on the type of distribution functions considered for the performance of facilities or demand of markets. We only apply it for uniform and exponential cases as an example. -
• We assume that the performance of the product's components is independent, and the failure time of component n is a random variable with f n (θ n ) density and f n (θ n ) cumulative density function. This assumption is widely used in the literature such as Nguyen and Murthy (Reference Nguyen and Murthy1984, Reference Nguyen and Murthy1988), Murthy (Reference Murthy1990), Hussain and Murthy (Reference Hussain and Murthy2000, Reference Hussain and Murthy2003), and Jack and Murthy (Reference Jack and Murthy2007).


This model is a mixed integer nonlinear mathematical model. Solving this kind of model is not straightforward. The form of nonlinear terms in this model depends on the cumulative distribution functions defined for the stochastic parts of the problem. This means that by changing these distribution functions, the mathematical forms of these terms also change. In Section 4, we propose an efficient approach to solve this model and find the solution.
4. SOLUTION APPROACH
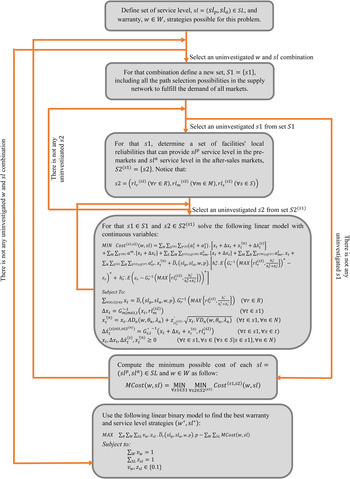
In this section, we develop a five-step approach to solve the model proposed in the previous section (Fig. 4). In this approach, for each sl = (sl p , sl a ) ∈ SL and each w ∈ W, the following steps should be done:
-
Step 1. Define a new set, S1 = {s1}, including all the path selection possibilities in the network to fulfill the demand of all markets. The largest size for this set is
(33)
$$\vert {S1} \vert = \mathop \prod \limits_{\forall r \in R} 2^{\lpar {\vert {T^{\lpar r \rpar }} \vert - 1} \rpar }. $$
Fig. 4.Flowchart of solution algorithm.
-
Step 2. For each s1 ∈ S1, determine a set of facilities' local reliabilities that can provide sl p service level in the premarkets and sl a service level in the after-sales markets, S2(s1) = {s2}. Notice that
(34)
$$s2 = \lpar {rl_r^{\lpar {s2} \rpar } \; \lpar {\forall r \in R} \rpar \comma \,\; rl_m^{\lpar {s2} \rpar } \; \lpar {\forall m \in M} \rpar \comma \,\; rl_s^{\lpar {s2} \rpar } \; \lpar {\forall s \in S} \rpar } \rpar . $$


Determining these feasible local reliability combinations is initiated by discretizing the continuous interval of the local reliabilities. For example, by assuming that the least possible premarket service level is 0.75 and the facilities have the same lower bounds for their local reliabilities, the lower interval bound for the local reliabilities is 0.9. After discretizing [0.9, 1.0] interval by an acceptable step such as 0.01, these feasible local reliability combinations can be determined as follows:
 $$\eqalign{& \rm{For}\,rl_r = 0.9:0.1:1.0\; \; \lpar {\forall r \in R} \rpar \cr&\quad \hbox{For}\,rl_m = 0.9:0.1:1.0\; \; \lpar {\forall m \in M} \rpar \cr&\qquad \hbox{For}\,rl_s = 0.9:0.1:1.0\; \; \lpar {\forall s \in S} \rpar \cr&\qquad\quad \rm{IF}\cr&\qquad\qquad \;sl_p \cong \mathop \prod \limits_{\big( {\forall t \in \big( {s1\!\mathop \cap \nolimits^{T^{\lpar r \rpar}}} \big) } \big)} \!\!\left(\!\!{\left( {\mathop \prod \limits_{\lpar {\forall s \in t} \rpar } rl_s} \right) \times rl_{m \vert m \in t} \times rl_{r \vert r \in t}} \right)\,\, {\rm and} \cr&\qquad\qquad sl_a \cong \mathop \prod \limits_{\big( {\forall t \in \big( {s1\!\mathop \cap \nolimits^{T^{\lpar r \rpar}}} \big) } \big)} \!\!\Bigg(\!{\lpar {rl_r} \rpar^{\vert N \vert }. \mathop \prod \limits_{(\forall n \in N\comma \, s \in S^{\lpar n \rpar } \vert s \in t)} rl_s} \Bigg)\quad \lpar {\forall r \in R} \rpar \cr &\qquad\qquad \hbox{Add}\;\lpar {rl_r^{\lpar {s2} \rpar } = rl_r \; \lpar {\forall r \in R} \rpar \comma \,\; rl_m^{\lpar {s2} \rpar }} \cr & {\;\quad\quad\quad\quad\qquad\quad\qquad = rl_m \; \lpar {\forall m \in M} \rpar \comma \,\; rl_s^{\lpar {s2} \rpar } rl_s \; \lpar {\forall s \in S} \rpar } \rpar \,\rm{into}{\rm} \;\rm{set}{\it \;S} {\rm 2} \cr & \quad\quad\quad\rm{End}; \cr & \quad\quad\rm{End}; \cr & \quad\rm{End}; \cr & \rm{End};} $$
Having restricted feasible intervals for local reliability variables justifies the rationality of using discretizing in this step.
-
Step 3. For each
$\forall s1 \in S1$
and
$\forall s2 \in S2^{\lpar {s1} \rpar} $
, solve the following linear model with continuous variables:


min
 $$\eqalign{& {\rm Cost}^{\left( {s1\comma\;s2} \right)}\left( {w\comma \;\; sl} \right) \cr& = {\bar D}_r\left( {sl\comma\,\; w\comma\;\,p} \right). \left[ {h_r^ + .\;E{\left( {G_r^{ - 1} \left( {{\rm max}\left\{ {rl_r^{\left( {s2} \right)} \comma\,\displaystyle{{h_r^ - } \over {h_r^ + + h_r^ - }}} \right\}} \right) - {\rm \varepsilon} _r} \right)}^ + } \right. \cr &\quad\quad \left. { + h_r^ - . E{\left( {{\rm \varepsilon} _r - G_r^{ - 1} \left( {{\rm max}\left\{ {rl_r^{\left( {s2} \right)} \comma\;\;\displaystyle{{h_r^ - } \over {h_r^ + + h_r^ - }}} \right\}} \right)} \right)}^ + } \right] \cr &\quad\quad + \sum \limits_N\sum \limits_{s^{(n)}}\sum \limits_{T^{(s)}}(a_1^s + a_2^s ).[ {x_t + \Delta x_t + x_t^{{\prime}(n)} + \Delta {\acute {x}}_t^{(s)} } ] \cr &\quad\quad + \sum \limits_M\sum \limits_{T^{(m)}}a^m\;.\;[x_t + \Delta x_t] + \sum\limits _S\sum\limits _M\sum\limits _{T^{(s)}\mathop \cap ^{T^{(m)}}}a_{sm}^t \;.\;[x_t +\Delta x_t] \cr &\quad\quad + \sum \limits _M \sum \limits _R \sum \limits _{T^{\left( m \right)}\mathop \cap \limits{ T^{( r)}}}a_{mr}^t \;.\;x_t + \sum \limits _N \sum \limits _{S^{(n)}} \sum \limits _R\sum \limits _{T^{\left( s \right)}\mathop \cap \limits{T^{(r)}}}a_{sr}^t \;.\;x_t^{{\prime}\left( n \right)} \comma} $$
subject to
 $$\eqalign{ \sum \limits_{\forall t \in s1 \vert r \in t} x_t &= \bar D_r \lpar {sl\comma \,\; w\comma\,\,p} \rpar\,.\,G_r^{ - 1} \left( {\hbox{max}\left\{ {rl_r^{\lpar {s2} \rpar }\comma \, \displaystyle{{h_r^ -} \over {h_r^ + + h_r^ -}}} \right\}} \right) \cr & \quad \quad \quad \quad \quad \quad \quad \quad \quad \quad \quad \quad \quad \quad \quad \quad \quad \quad \quad \quad \quad \quad \quad \quad \quad \lpar {\forall r \in R} \rpar\comma }$$
 $$\Delta x_t = G_{m \vert m \in t\comma \,t}^{{\prime} - 1} \lpar {x_t\comma \, rl_m^{\lpar {s2} \rpar }} \rpar \quad \lpar {\forall t \in s1} \rpar\comma $$
 $$\eqalign{ x_t^{{\prime}\lpar n \rpar } = x_t\,.\,AD_n \lpar {w\comma \,{\rm \theta}_n\comma \, {\rm \lambda}_n} \rpar + z_{rl_r^{\lpar {s2} \rpar }} ^{\prime}\;.\; & \sqrt {x_t\,.\,VD_n \lpar {w\comma \,{\rm \theta}_n\comma \, {\rm \lambda}_n} \rpar } \cr & \quad \quad \quad \quad \quad \lpar {\forall t \in s1\comma \,\; \forall n \in N} \rpar \comma }$$
 $$\eqalign{\Delta {\acute {x}} _t^{(s \vert s \in t\comma \,s \in S^{\lpar n \rpar } )} = G_{s\comma \,t}^{{\prime\prime} - 1} \lpar {x_t + \Delta x_t + x_t^{{\prime}\lpar n \rpar }\comma \, rl_s^{\lpar {s2} \rpar }}\rpar & \cr & \lpar {\forall t \in s1\comma \,\forall s \in t} \rpar \comma }$$
 $$\eqalign{x_t\comma \, \; \Delta x_t\comma \, \; \Delta {\acute {x}} _t^{\lpar s \rpar }\comma \, x_t^{{\prime}\lpar n \rpar } & \ge 0\; \cr & \lpar {\forall t \in s1\comma \,\; \forall s \in \lcub {s \in S \vert s \in s1} \rcub \comma \,\; \forall n \in N} \rpar .} $$
-
Step 4. Compute the minimum possible cost of each sl = (sl p , sl a ) ∈ SL and w ∈ W as follows:
(42)
$$M{\rm Cost}\lpar {w\comma \,sl} \rpar = \min _{\forall s1 \in S1} \,\min _{\forall s2 \in S2^{\lpar {s1} \rpar }} {\rm Cost}^{\lpar {s1\comma \,s2} \rpar } \lpar {w\comma \,sl} \rpar .$$

The best path selection, flow assignment, and local reliability assignment corresponding to
 $M{\rm Cost} (w\comma\, sl)$
are represented by
 $Y^{\ast} (w\comma\,sl)$
,
 $X^{\ast} (w\comma\,sl)$
, and
 $RL^{\ast} (w\comma\,sl)$
respectively.
-
Step 5. After computing MCost(w, sl) for each
$\forall sl = \lpar {sl_p\comma \, sl_a} \rpar \in SL$
and
$\forall w \in W$
, use the following linear binary model to find the best warranty and service level strategies (w*, sl*):


max
 $$\eqalign{& \sum _R \sum _W \sum _{SL} v_w\,.\,z_{sl}\,.\,\bar D_r \lpar {sl\comma \,w\comma \,p} \rpar\,.\,p - \sum _W \sum _{SL} v_w\,.\,z_{sl}\,.\,M{\rm Cost}\lpar {w\comma \,sl} \rpar \comma\; \; \;} $$
subject to
 $$\sum _W v_w = 1\comma $$
 $$\sum _{SL} z_{sl} = 1\comma $$
 $$v_w\comma \, \; z_{sl} \in \lcub {0.1} \rcub . $$
By solving this model, the best service level, sl*, and warranty, w*, strategies are determined. Therefore, the best path selection, flow assignment, and local reliability assignment of the networks are Y*(w*, sl*), X*(w*, sl*), and RL*(w*, sl*). The flowchart for this algorithm is shown in Figure 4.
This algorithm is designed for medium-scale problems with a reasonable number of potential paths. In very large-scale problems with thousands of retailers and potential paths, a large number of models [Eqs. (35–40)] should be solved. This significantly increases the computational time. For these problems, two approaches can be used:
-
• reducing the number of retailers and corresponding paths by spatial clustering the retailers. In this case, each cluster will be assumed as a single virtual retailer; or
-
• using metaheuristic algorithms such as genetic algorithms, simulated annealing, or Tabu search to find good but not the best solution for the problem.
5. NUMERICAL ANALYSIS
The problem of this paper is defined and developed based on the needs of a real company in the engine industry. Tracking the quality of engines due to their long and complicated manufacturing process is not easy. However, this company, to preserve its reputation, tries to satisfy its customers as much as possible by providing after-sales services. Therefore, providing a suitable warranty is critical. Recently due to high rates of after-sales costs, this company decided to revise its after-sales services. By analyzing the historical data about the sales and return rates of the previous sales periods, the company wants to make scientific decisions about its marketing strategies such as retail price, warranty length, and service levels. In this section, we concentrate on one of the important engine groups of this company, which has a greater share of production compared to the others.
This engine group has two critical components provided by external suppliers, n1 and n2 (N = {n1, n2}). This company has two supplier options for procuring n1 and for providing n2; only one supplier exists, which means
 $S=S^{(n1)} \mathop \cup \nolimits^{S^{\lpar {n2} \rpar}}\!\comma \; S^{\lpar {n1} \rpar } = \lcub {s1\comma \,s3} \rcub \comma \,$
and S
(n2) = {s2}. Only two manufacturing centers of this company are capable of assembling this engine group, M = {m1, m2}, and they are supplied to two important markets by their corresponding retailers, R = {r1, r2}. The structure of the forward SN and its potential paths, T = {t
1,2,1,1, t
1,2,1,2, t
3,2,2,1, t
3,2,2,2}, are shown in Figure 5. Path
 $t_{s\comma \,{\acute {s}} \comma \, m\comma \,r} $
is the path starting from suppliers s and s′ (providing n1 and n2, respectively), passing through manufacturer m, and ending at retailer r.
Potential supply paths in the forward supply network of the engine problem.

Analyzing the quadruples of (price, service levels, warranty, and average demand) in the previous sales periods by regression shows that the following functions fit well with the historical demand data of this engine group. Assessing the differences between the actual realized demands and their average values by goodness of fit tests shows that the stochastic deviations fit with normal density functions with 90% confidence limit.
 $$ \eqalign{ D_1 \lpar {\,p\comma\; sl = \lpar {sl_p\comma \; sl_a} \rpar \comma \;w} \rpar & = \lpar {500 + 200\,.\,w - 250\,.\,\lpar {\,p - 10} \rpar } \cr & { - 500\,.\,\lpar {1 - sl_a} \rpar - 900\,.\,\lpar {1-sl_p} \rpar } \rpar\,.\,{\rm \varepsilon} _1 \comma }$$
 $${\rm \varepsilon} _1 \sim {\rm Normal} \lpar {{\rm \mu}_{{\rm \varepsilon}_1} = 0\comma \,{\rm \sigma}_{{\rm \varepsilon}_1}^2 = 0.1} \rpar\comma $$
 $$\eqalign{D_2 \lpar {\,p\comma \,\; sl = \lpar {sl_p\comma \, \; sl_a} \rpar \comma \,w} \rpar &= \lpar {400 + 200\,.\,w - 250\,.\,\lpar {\,p - 10} \rpar } \cr & { - 500\,.\,\lpar {1 - sl_a} \rpar - 900\,.\,\lpar {1 - sl_p} \rpar } \rpar\,.\,{\rm \varepsilon} _2\comma }$$
 $${\rm \varepsilon} _2 \sim {\rm Normal}\lpar {\rm \mu_{\varepsilon_2} = 0\comma \,\sigma_{\varepsilon_2}^2 = 0.1} \rpar .$$
The deterioration time in S1, S2, and S3 has exponential distribution with μ1 = 2, μ2 = 2, and μ3 = 3. The nonconforming production rate in the out of control state of their machines is
 ${\rm \gamma} _1 = 10\% $
,
 ${\rm \gamma} _2 = 20\% $
, and
 ${\rm \gamma} _3 = 5\% $
. Production rates of the first, second, and third suppliers are 8000, 8000, and 9000 component units per time unit. The cost components of this problem are summarized in Table 2.
Cost components of the engine problem

The manufacturers have imperfect production systems. Defective production rate in the first and second manufacturer has a uniform distribution with (0, β m=1 = 0.15) and (0, β m=2 = 0.08). First, we assume the product price in the markets is fixed at its current value, p = $ 10. In Section 6.2, by analyzing the sensitivity of the results with respect to the product price, the best price strategy is determined. In this problem, we assume the available warranty options are W = {w 1 = 0.5 (year), 1.0 (year), 1.5 (years), 2 (years)}. The available service level options are SL = {sl 1 = (sl 1p = 0.98, sl 1a = 0.96), sl 2 = (sl 2p = 0.90, sl 2a = 0.95), sl 3 = (sl 3p = 0.85, sl 3a = 0.91)}.
In the company, 3-year records are available for the claims that have been made. To determine the failure rates of the engine, we use a statistical analysis approach proposed by Lawless (Reference Lawless1998). Using his method, we calculate the mean and variance of the failure rate for different ages of the engine. The mean and three sigma confidence limits of the failure rates for the two critical components of this engine are shown in Figures 6 and 7.
Failure rate of the first component with respect to age.

Failure rate of the second component with respect to age.

Solving the mathematical model yields the following results: the most profitable service level and warranty strategies are
 $sl^* = \lpar {sl_p^* = 0.85\comma \,sl_a^* = 0.91} \rpar $
and w* = 1.0 (year). The least costly reliabilities of the facilities preserving this service level strategy are rl
s=1 = 1.00, rl
s=2 = 1.00, rl
s=3 = 0.94, rl
m=1 = 0.99, rl
m=2 = 0.93, rl
r=1 = 0.99, and rl
r=2 = 0.99. The best flow through the paths of the forward SN are x
1 = 49.94, x
2 = 40.64, x
3 = 949.04, and x
4 = 772.24 (Fig. 8). The best flow through the paths of the after-sales SN are
 $ \acute{x}_1^{\lpar 1 \rpar }$
= 6.17,
 $ \acute{x}_1^{\lpar 2 \rpar }$
= 8.31,
 $ \acute{x}_2^{\lpar 1 \rpar }$
= 5.34,
 $ \acute{x}_2^{\lpar 2 \rpar } $
= 7.18,
 $\acute{x}_3^{\lpar 1 \rpar }$
= 63.47,
 $\acute{x}_3^{\lpar 2 \rpar }$
= 87.70,
 $\acute{x}_4^{\lpar 1 \rpar }$
= 53.05, and
 $\acute{x}_4^{\lpar 2 \rpar }$
= 73.21 (Fig. 9). Flow amplification in these networks’ facilities are
 $\Delta x_1$
= 7.41,
 $\Delta x_2$
= 6.03,
 $\Delta x_3$
= 70.61,
 $ \Delta x_4$
= 57.45,
 $\Delta \acute{x}_1^{\lpar 1 \rpar }$
= 7.06,
 $ \Delta \acute{x}_1^{\lpar 2 \rpar }$
= 16.41,
 $\Delta \acute{x}_2^{\lpar 1 \rpar }$
= 5.78,
 $\Delta \acute{x}_3^{\lpar 3 \rpar } $
= 47.23,
 $\Delta \acute{x}_3^{\lpar 2 \rpar } $
= 276.83,
 $\Delta \acute{x}_4^{\lpar 3 \rpar }$
= 36.69, and
 $\Delta \acute{x}_4^{\lpar 2 \rpar }$
= 225.72.
Flow through the forward supply network.

Flow through the after-sales supply network.

The model developed in Section 3 and linearized in Section 4 is a mixed integer linear programming. The solution time of mixed integer linear programming mainly depends on the number of binary variables that is equal to
 $\sum{\forall s1 \in S1} \vert {S2^{\lpar {s1} \rpar }} \vert $
. The computational time for the case problem in this section is less than a second. Given that the case problem is simple, we check the computational capability of the model and solution approach by solving seven problems summarized in Table 3.
Computational capability for the developed model

As seen in Table 3, for Problem 7 and problems larger than Problem 7, the computational time is more than 48 h. Therefore, for this type of problem, we suggest using metaheuristic approaches to solve the model and find a good suboptimal solution in a rational computational time instead of the global optimum.
5.1. Optimal price strategy determination
In the previous analysis, we assumed the product price in the markets is fixed at p = $ 10. In this section, by checking the sensitivity of the model with respect to the price, we determine the best price strategy for the company.
Based on the product's manufacturing cost and rival product prices in the markets, we assume the price should be selected from [$8, $12] range. For some sample price values from this range, we solve the mathematical model of the problem and get the results. Dark green points in Figure 10 represent the highest profit for these sample price values. Based on the results, a two-order polynomial function fits very well with these points. To find the best price, we find the maximum point of this fitted function, which gives p* = $ 9.77.
Profit with respect to price.

5.2. Correlation between price and warranty strategies
In this section, we analyze the correlation between the best warranty and the best price strategies in different service-level options. For this purpose, for each combination of the service level and warranty options, the mathematical model is solved for some sample values in the feasible price range [$8, $12]. The resulting profit points and their fitted function are displayed for the third service level option (sl 3p = 0.85, sl 3a = 0.91) in Figure 11. The intersections of these functions show the critical price values in which the priority of the warranty options changes. Based on these results, the priority of the warranty options with respect to the price values is as follows:
If p ≤ $8.90 Then the priority of warranty options is 0.5, 1.0, 1.5 and 2.0.
If $8.90 < p ≤ $10.10 Then the priority of warranty options is 1.0, 0.5, 1.5 and 2.0.
If $10.10 < p ≤ $10.50 Then the priority of warranty options is 1.0, 1.5, 0.5 and 2.0.
If $10.50 < p ≤ $10.80 Then the priority of warranty options is 1.5, 1.0, 0.5 and 2.0.
If $10.80 < p ≤ $11.10 Then the priority of warranty options is 1.5, 1.0, 2.0 and 0.5.
If $11.10 < p ≤ $11.45 Then the priority of warranty options is 1.5, 2.0, 1.0 and 0.5.
If $11.45 < p Then the priority of warranty options is 2.0, 1.5, 1.0 and 0.5.
Profit variation with respect to the warranty and price in the third service-level strategy.

According to Figure 11, price increment imposes almost the same trend of changes on the profit function of the all warranty options. Increasing price first improves the profitability of the company in each warranty option. However, after the optimal price of that warranty option, the profit reduces by price increment. This means changing the warranty length does not significantly affect the trend of changes in the profit function with respect to the price. However, the profit function shifts to the right by increasing the warranty length. Therefore, in the price intervals between two sequential critical price values, the effect of the price increment on the profit functions of different warranty lengths may be different. For example, in price interval [9.00, 10.10], while the profit function of 1.5 (year) warranty option increases by the price increment, the profit function of 0.5 (year) warranty option decreases, and the profit function of 1.0 (year) warranty increase at first and decrease after a while.
The results of solving the mathematical model for different combinations of warranty and price options at the second service level option, (sl 2p = 0.90, sl 2a = 0.95), and at the first service level option, (sl 1p = 0.98, sl 1a = 0.96), are represented in Figure 12 and Figure 13, respectively. The critical price values in the second service level option are as follows:
If p ≤ $10.50 Then w = 0.5, 1.0, 1.5 and 2.0.
If $10.50 < p ≤ $11.15 Then w = 1.0, 0.5, 1.5 and 2.0.
If $11.15 < p ≤ $11.60 Then w = 1.0, 1.5, 0.5 and 2.0.
If $11.60 < p ≤ $11.70 Then w = 1.5, 1.0, 0.5 and 2.0.
If $11.70 < p ≤ $12.00 Then w = 1.5, 1.0, 2.0 and 0.5.
If $12.00 < p ≤ $12.25 Then w = 1.5, 2.0, 1.0 and 0.5.
If $12.25 < p Then w = 2.0, 1.5, 1.0 and 0.5.
Profit variation with respect to the warranty and price in the second service-level strategy.

Profit variation with respect to the warranty and price in the first service-level strategy.

The critical price values in the first service level option are as follows:
If p ≤ $11.83 Then w = 0.5, 1.0, 1.5 and 2.0.
If $11.83 < p ≤ $12.20 Then w = 1.0, 0.5, 1.5 and 2.0.
If $12.20 < p ≤ $12.41 Then w = 1.0, 1.5, 0.5 and 2.0.
If $12.41 < p ≤ $12.55 Then w = 1.5, 1.0, 0.5 and 2.0.
If $12.55 < p ≤ $12.75 Then w = 1.5, 1.0, 2.0 and 0.5.
If $12.74 < p ≤ $12.85 Then w = 1.5, 2.0, 1.0 and 0.5.
If $12.85 < p Then w = 2.0, 1.5, 1.0 and 0.5.
Comparison of the critical price values in these three service level options reveals that by increasing the service levels, the intervals between the sequential critical price values do mainly decrease. This means the correlation between the price and warranty becomes tighter by increasing the service levels. Therefore, in higher service levels, the priority of the warranty options stays stable for a smaller price interval and is more sensitive with respect to the price variations.
Comparison of the profit functions in Figures 11, 12, and 13 shows that by increasing the service levels, the overlaps among the profit functions decrease and they become more separate. The profit function of each warranty option has a connected price interval inside which the profit of that warranty is positive. By increasing the service levels, these intervals of the warranty options become more distinct. This means the feasible range of price is divided to some more distinct intervals in each and only one warranty option is profitable. Therefore, in higher service levels, the positively profitable warranty options available in each price value for managers to select are much less.
5.3. Correlation between service level and warranty strategies
In this section, we analyze the relationship between the warranty length and service level in a fixed price, p = 10. The results of solving the mathematical model for different combinations of the warranty and service level options at p = 10 are represented, in Figure 14. There is no intersection among the profit functions of different service level options. This means that the priority of service-level options is not changing with respect to the warranty variations. The highest profit always corresponds to the third, lowest, service-level option.
Warranty and service-level correlation in the p = 10 price strategy.

Based on these results, we conclude that for a given price, the priority of the service-level options does not significantly change with warranty length variation, and in our test problem, the third service-level option is always the best. In the other words: the priority of the service-level options is very stable and is not affected easily by warranty variations. In this problem, the warranty-service level trade-off is much more stable than the price-warranty trade-off. However, the stability of the warranty-service level trade-off may change by increasing the service-level sensitivity parameter in the demand function.
We summarize the outcomes of these analyses in Figure 15. This figure shows the relationships between two marketing strategies in a given option of the third one. For example, in a given warranty length option, the best price strategy is increasing with respect to the service level but the trend of this increment is different for warranty options. In shorter warranty lengths, the rate of price increment is a convex increasing function of the service levels. However, this function tends to become a linear increasing and then a concave increasing by the warranty length increment.
Variations of the three marketing strategies: price, service level, and warranty length.

In the same way, for a given service level option, the best price strategy is increasing with respect to the warranty length, but the trend of this increment is different for service-level options. In lower service levels, the rate of price increment is a convex increasing function of the warranty length. However, this function tends to become a linearly increasing and then a concave increasing by the increment in the service levels.
6. CONCLUSION
Here, we address two important issues. The first issue is modeling interactions in the operations of the forward and after-sales SNs by concurrent planning the flow dynamics in their networks. There is a huge synergy in concurrent planning of these SNs that is mainly ignored in existing work. The second issue is considering that supply-side uncertainties in the performance of the SNs’ production facilities and their propagation throughout the networks make our model more consistent with reality. In this paper, we quantify the following relationships:
-
• between the local reliabilities of the facilities and the SNs’ service levels,
-
• between the local reliabilities of the facilities and their flow dynamics, and
-
• between the SNs’ service levels and the company's other marketing strategies (price and warranty).
We use these relationships to develop a mathematical model for the problem determining the most profitable marketing strategies for the company and the least costly flow dynamics throughout its networks preserving the marketing strategies.
In this problem, we assume that the spare parts required for the after-sales operations are new and directly supplied by the suppliers. However, another option is remanufacturing the defective components, which are mainly new. Including the remanufacturing option in the after-sales SN is an important future research for this paper.
ACKNOWLEDGMENTS
We gratefully acknowledge funding from NSF Grant 1128826 and support from the L.A. Comp Chair and the John and Mary Moore Chair at the University of Oklahoma.
Shabnam Rezapour is a Research Assistant in the Systems Realization Laboratory at the University of Oklahoma. She received her BS and MS degrees in industrial engineering and her PhD degree in supply chain management from Amirkabir University of Technology and is completing her second PhD in industrial and systems engineering at the University of Oklahoma. Rezapour previously worked as an Assistant Professor in the Department of Industrial Engineering at Urmia University of Technology. Her research interests are risk management in logistics and supply chains, competitive supply chain network design, designing robust and resilience network infrastructures, and disaster management. Dr. Rezapour has coauthored 3 books, 9 book chapters, 21 journal papers, and 15 conference papers in these domains.
Janet K. Allen holds the John and Mary Moore Chair and is Professor of industrial and systems engineering at the University of Oklahoma. She came to the University of Oklahoma in August 2009 where she and Professor Farrokh Mistree established the Systems Realization Laboratory, which is home to 16 researchers from mechanical engineering and industrial and systems engineering. The focus of Dr. Allen's research is engineering design and especially the management of uncertainty when making design decisions. Her interest in managing uncertainty extends to robust design, uncertainty quantification, information economics, and statistical and computational methods to facilitate engineering design. She has an ongoing interest in simulation and modeling in support of design decision making with a particular interest in the design of complex systems. This has led to her interest in the design of networks and supply chains. Professor Allen and her students have studied aerospace systems, materials, energy systems, mechanical systems, and design methods. She has a long-term interest in improving design pedagogy and a particular interest in educating graduate students. She is a Senior Member of AIAA and a Fellow of ASME.
Farrokh Mistree holds the L. A. Comp Chair in the School of Aerospace and Mechanical Engineering at the University of Oklahoma. Farrokh's current research focus is model-based realization of complex systems by managing uncertainty and complexity. The key question he is investigating is what are the principles underlying rapid and robust concept exploration when the analysis models are incomplete and possibly inaccurate? He has coauthored 2 textbooks, 1 monograph, and more than 400 technical papers dealing with the design of material, mechanical, thermal, and structural systems; ships and aircraft; and supply chains. Farrokh is a Fellow of ASME and an Associate Fellow of AIAA.