1 Introduction
Network analysts have often viewed networks from the top-down as opposed to the bottom-up, focusing upon the system-level properties of a network at the expense of the meso-level processes constituting a network’s emergent properties and meaning. With the rise of Exponential Random Graph Models (ERGMs) and Latent Space Models (LSMs) scholars, statistical and substantive alike, have prioritized studying the generative tendencies of networks. The foundational assumption invoked by these models, that there is a single network generating process, seems problematic. While studying network generation is certainly useful, it has often come at the cost of understanding variation within a network. If a network is a collection of actors and their overlapping ego-networks, a great deal can be gained by assessing variation across these ego-networks.Footnote 1
Another way of stating this problem is that network scientists have been very good at studying network structure, but have overlooked the particular roles that actors serve within these networks and the dynamics they contribute.Footnote 2 This focus on broader network structure is in spite of the rich theory often considered about the functions particular actors serve in networks. Only recently have scholars explicitly examined these roles within cross-sectional networks, producing the requisite analytical and methodological tools (Welser et al. Reference Welser, Cosley, Kossinets, Lin, Dokshin, Gay and Smith2011; Salter-Townshend and Murphy Reference Salter-Townshend and Murphy2015; Box-Steffensmeier et al. Reference Box-Steffensmeier, Campbell, Christenson and Navabi2018). Role analysis has a storied history, and while increasingly popular, the development of the methodological and conceptual tools necessary to perform it on common and increasingly important longitudinal networks has lagged behind. This prompts a series of motivating questions: How might one consider the function and nature of roles in evolving systems? What would an approach for detecting roles within longitudinally observed networks look like?
This manuscript presents a new way to consider networks, presenting a comprehensive guide for conceptualizing, theorizing, and detecting roles in longitudinal networks. Roles can be detected using a novel statistical innovation, the ego-Temporal Exponential Random Graph Model (ego-TERGM). The ego-TERGM builds upon its cross-sectional equivalent derived by Salter-Townshend and Murphy (Reference Salter-Townshend and Murphy2015) and introduced by Box-Steffensmeier et al. (Reference Box-Steffensmeier, Campbell, Christenson and Navabi2018). A Monte Carlo study and substantive application to Kapferer (Reference Kapferer1972)’s strike network demonstrate that the ego-TERGM is effective in classifying ego-networks according to their corresponding data generating process. This is accomplished through extracting longitudinally observed ego-networks, assessing their structure, and then sorting them into latent roles or clusters according to similarity and difference. While parameter estimates for network properties are the primary objects of interest for ERGM-family models, time-invariant role or cluster assignments for nodes are the primary objects of interest for the ego-TERGM.
The ego-TERGM shows great promise for Political Science. Consider Wendt (Reference Wendt1999)’s Social Theory of International Politics, one of the most influential and well-cited theories of International Relations that has defied systematic measurement and empirical assessment. Assessing the roles states adopt within international politics through examining the state interaction network, intrinsically a longitudinal and dynamic network, requires a longitudinal model capable of capturing temporal social dynamics. Through rigorously examining patterns of behavior between a state and their alters, the ego-TERGM offers an opportunity to discover the intersubjective and irreducible roles adopted by states and based upon role structure, whether a historical period reflects a Kantian, Hobbesian, or Lockean anarchy. Within American politics, much can be learned through examining the roles that congresspersons adopt when collaborating (Fowler Reference Fowler2006; Craig Reference Craig2017) or the roles that interest groups adopt in lobbying coalitions (Box-Steffensmeier et al. Reference Box-Steffensmeier, Campbell, Christenson and Navabi2018). These potential applications are examples of role-based questions that one can ask of longitudinal networks. While it is possible to pool these observations into a single time period (see Box-Steffensmeier et al. (Reference Box-Steffensmeier, Campbell, Christenson and Navabi2018) for such an example), it comes at the cost of sacrificing fine-grained temporal data. These applications illustrate the interesting questions that the ego-TERGM can provide answers to.
2 Role Analysis in Networks
Role analysis has a storied history across disciplines. Initially used to understand fundamental concepts in psychology such as belongingness, role analysis has permeated across disciplines, including: Sociology (Parsons Reference Parsons1951; Morris Reference Morris1971); American Politics (James Reference James1968; Alpert Reference Alpert1979; Box-Steffensmeier et al. Reference Box-Steffensmeier, Campbell, Christenson and Navabi2018); International Relations (Holsti Reference Holsti1970; Wendt Reference Wendt1999; Thies Reference Thies2017); Health (McKee Reference McKee1970); Religion (Källstad Reference Källstad1987); Education (Kremer Reference Kremer1983); Gender Studies (Komarovsky Reference Komarovsky1992); Law (James Reference James1968); and Management (Hrebiniak and Alutto Reference Hrebiniak and Alutto1972). Within Political Science, role analysis has recently been used to examine the roles that interest groups adopt within the environmental lobbying coalition. Box-Steffensmeier et al. (Reference Box-Steffensmeier, Campbell, Christenson and Navabi2018) find evidence of groups coordinating efforts at the center of the network (Coordinators) while seeking specialized knowledge and expertise from those on the periphery of the network (Peripheral Specialists). These groups stand in contrast to a bloc of equally positioned competitors serving a shared role (Teammates).
Role analysis refers to the process of examining the roles—positions, duties, or functions—that particular actors serve within a broader system, and the existence, generative process, or effects of these roles. In the aforementioned example, Box-Steffensmeier et al. (Reference Box-Steffensmeier, Campbell, Christenson and Navabi2018) perform a role analysis of the environmental interest group coalition, enumerating the network’s emergent roles and their contribution to collective lobbying efforts. Regardless of the objective, role analysis provides an opportunity to jointly examine both the broader system and its constitutive members.
Within social groups, actors can be thought to adopt certain roles. A role is typically defined with respect to the actor’s social position and the behavioral expectations associated with that actor’s position (Parsons Reference Parsons1951). Social role, as is defined for this article, borrows from the definition outlined by Gleave et al.: Social roles are defined as cultural objects widely accepted and understood within a community that are used to accomplish community-based objectives (Reference Gleave, Welser, Lento and Smith2009, 1). Within this context, it is possible for roles to be defined by the intersubjectively determined location of an actor within a network while leaving the potential for roles to be exogenously determined. This definition is widely used by scholars of role analysis and network analysis alike (Gleave et al. Reference Gleave, Welser, Lento and Smith2009; Salter-Townshend and Murphy Reference Salter-Townshend and Murphy2015; Box-Steffensmeier et al. Reference Box-Steffensmeier, Campbell, Christenson and Navabi2018)
The recent networks approach to role analysis, including the development of statistical models (Brandes and Lerner Reference Brandes and Lerner2007; Salter-Townshend and Murphy Reference Salter-Townshend and Murphy2015) and their subsequent applications (Box-Steffensmeier et al. Reference Box-Steffensmeier, Campbell, Christenson and Navabi2018), represent a break from convention. For decades, role analysis had been conducted using qualitative techniques. One canonical example explores the roles that countries adopted during the Cold War. Using interviews and policymakers’ statements from 1965 to 1967, Holsti (Reference Holsti1970) argued that states can adopt many different roles, including (but not limited to) Regional Leader, Regional Protector, and Mediator-Integrator.
While many applications of role analysis are theory rich, they often lack the adequate empirical strategies capable of rigorously measuring roles and considering the temporal and network dynamics that lead to their emergence. There are two sources for this gap. First, generating role data is a monumental undertaking. Social roles are reflective of a mutually constitutive process where actors are both adopting a role, and being assigned to a particular role. For Holsti (Reference Holsti1970) to truly consider roles, he must not just consider what policymakers are saying about their own country, but what other policymakers are saying about their country. Assuming there are 195 countries in the world, the analyst would have to examine
 $195^{2}$
or 38,025 interstate relationships. Assuming that roles may vary by year, all this work may only produce one year of role assignments. As such, approaches (qualitative or quantitative) typically pool across several years, are agnostic to the intersubjectivity of roles (Holsti Reference Holsti1970), and/or strictly focus upon one actor (Lake Reference Lake2013). Second, few models exist to examine the effect of network or temporal dynamics on the emergence of these roles. Given that roles are intrinsically a network phenomenon that are influenced by temporal dynamics, evaluating these interdependencies is necessary.
3 Inferring Roles from Longitudinal Networks
While network analysis has been integrated into the study of social roles, few techniques exit to infer roles from longitudinal networks.Footnote 3 Fewer attempts have been made to carefully consider and conceptualize the nature of roles within longitudinally-observed networks. This seems problematic as many well-known networks are observed over time (e.g. interstate conflict, friendship, military alliances, congressional cosponsorship and voting, migration). In this section, roles in time-varying networks are conceptualized, and the techniques for inferring them are discussed.
3.1 Conceptualizing Roles in Longitudinal Networks
Within cross-sectional networks, roles are treated as static. In the aforementioned application presented by Box-Steffensmeier et al. (Reference Box-Steffensmeier, Campbell, Christenson and Navabi2018), the temporal dynamics informing role assignment in the environmental lobbying coalition are not considered. This does not imply such dynamics do not exist, however. Their theory argues that to overcome the collective action problem associated with political lobbying, interest groups adopt roles to establish behavioral expectations. These roles may become consolidated with time, or vary significantly from year to year as salient issues evolve or group resources change.
One might be interested in two essential temporal dynamics associated with roles: stability and change.Footnote 4 While these two dynamics are different sides of the same coin, they must be considered as analytically distinct from a modeling perspective. Role stability refers to the process wherein the roles adopted within a network are static and do not vary over time. This might be a particular phenomenon associated with the roles of a network, or a modeling assumption. Consider the network of military alliances during the Cold War. America’s role as Chief Balancer is fairly stable and unlikely to have changed from the late 1940s to the late 1980s. Role stability may also be a modeling assumption akin to the implicit assumption of a time-invariant data generating process invoked by many statistical models that pool observations over time. The ego-TERGM presented in the following section is a pooled model that invokes this assumption, positing that roles are assumed to be stable and time-invariant within a clearly defined temporal domain. Role stability may also be invoked to produce parsimonious role assignments in a network with little autoregressive tendencies.
Role change refers to a process wherein the roles actors adopt within a network vary with time. Similar to role stability, role change may be a phenomenon associated with the roles of a network, or an explicit modeling assumption. The interstate conflict network is fairly dynamic, experiencing significant variation from year to year. A highly central node that may be a Pariah and involved in many conflicts in one year may not be a Pariah in the following year. In 1914 and 1915, Germany might have been considered a Pariah, only to enter the “Golden Era” and join many any countries less than a decade later as an Isolate in the conflict network. Role change may also be a modeling assumption, where a model explicitly attempts to account for the variation of role assignments from period to period.Footnote 5
3.2 Extant Strategies
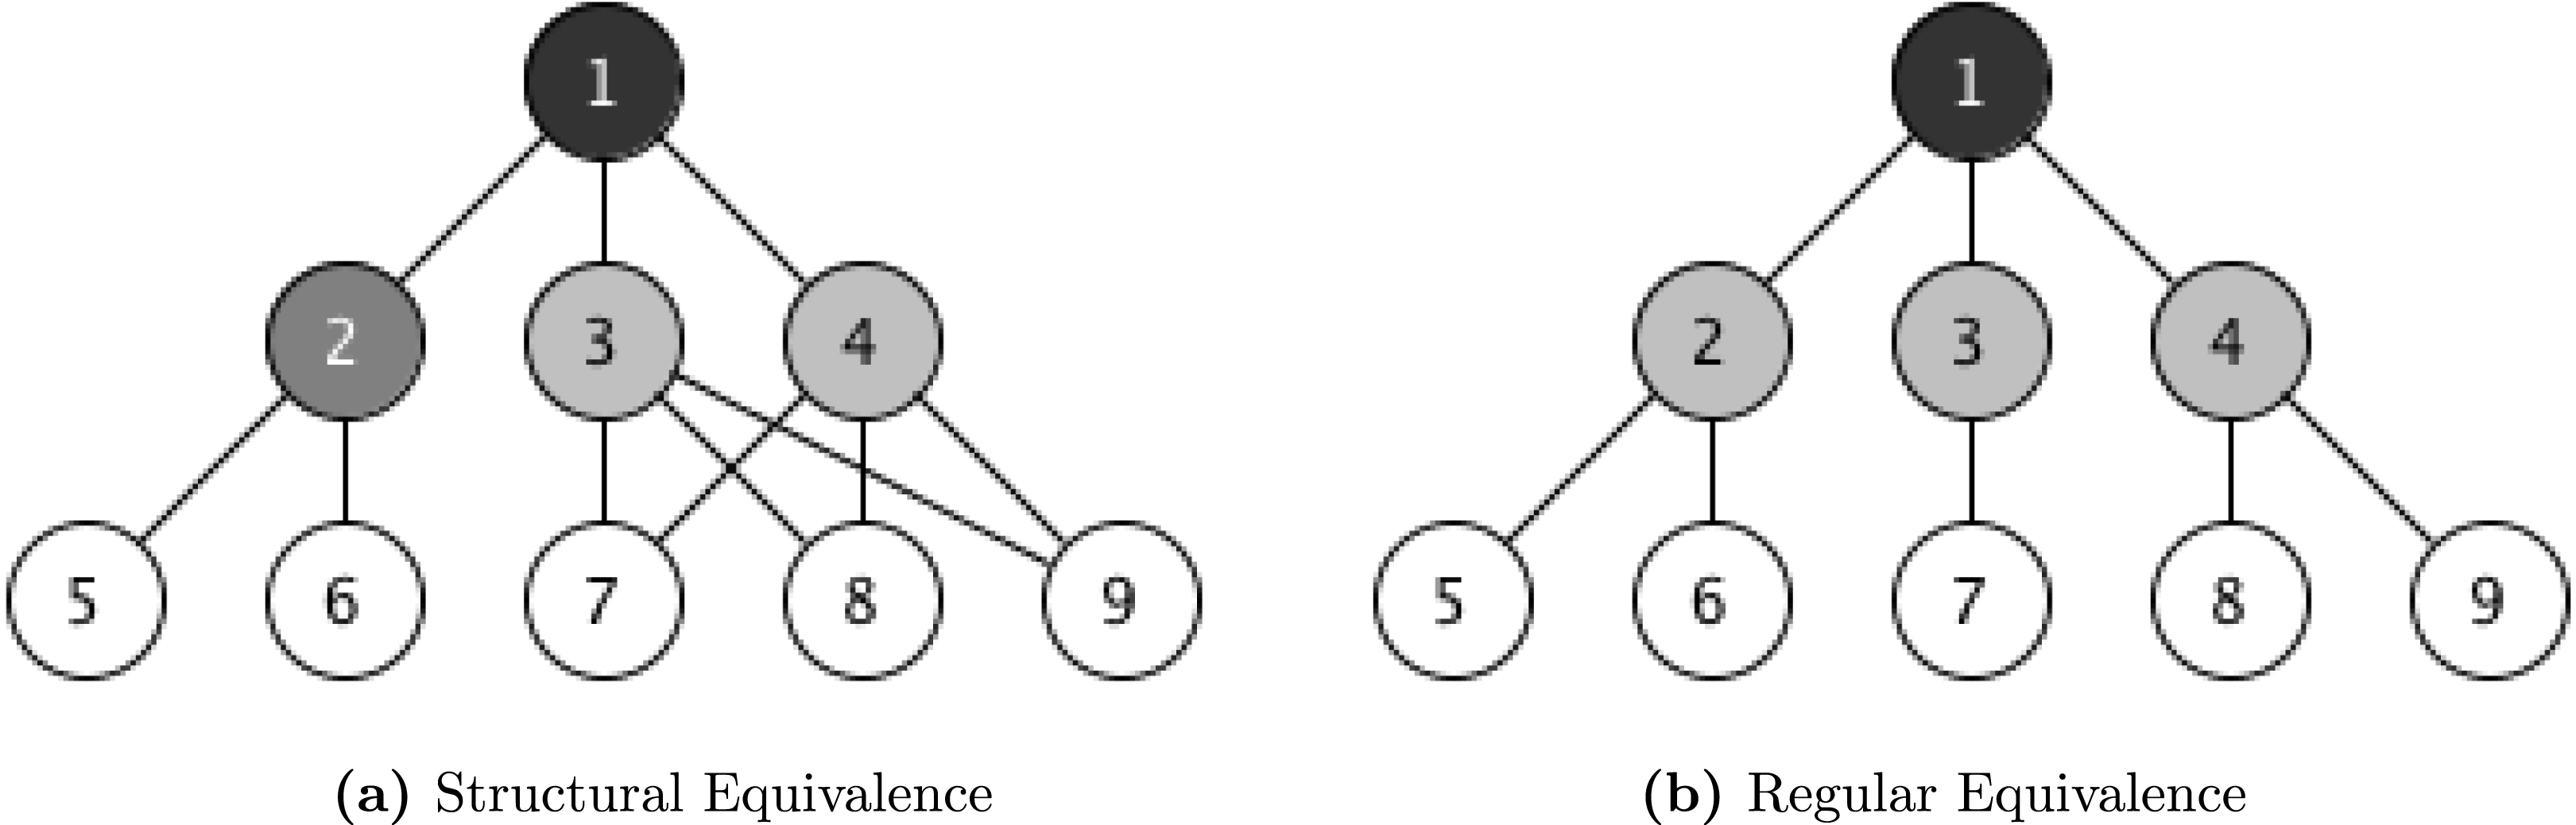
While techniques to explicitly infer roles from longitudinally observed networks are yet to be developed, there exist general techniques for cross-sectional networks that have been repeated for each period in a time series of networks. Those typically interested in inferring roles from longitudinal networks have calculated structural or regular equivalency scores for nodes at every time step. Structural equivalence refers to whether or not two actors occupy the same structural position within a network, or in other words, whether two nodes are connected to the same set of alters (Lorrain and White Reference Lorrain and White1971). If actors are structurally equivalent, then they are thought to occupy the same role. A simple example is shown in Figure 1(a), where four structurally equivalent sets exist:
 $\{1\},\{2\},\{3,4\}$
, and
 $\{5,6,7,8,9\}$
. In one featured application, Maoz et al. (Reference Maoz, Kuperman, Terris and Talmud2006) argue that actors occupying the same role or structural position should share an affinity toward one another, and as such, structurally equivalent states in international networks may be less likely to engage in conflict.
Structural and Regular Equivalence. Equivalent sets are share the same color.

An alternative to structural equivalence is regular equivalence, a method of graph partitioning based upon general patterns of connectivity (Borgatti and Everett Reference Borgatti and Everett1992; Everett and Borgatti Reference Everett and Borgatti1994). Formally, actors that have similar relations to members of other regular equivalent sets are said to be in the same set. This is a fairly intuitive concept—assume that there exist three colors of nodes: black nodes are connected to gray nodes, gray nodes are connected to black and white nodes, and white nodes are only connected to gray nodes. In this particular case, all black nodes are regularly equivalent, as are gray and white nodes. This is illustrated through the simple example in Figure 1(b), where the regularly equivalent sets are
 $\{1\},\{2,3,4\}$
, and
 $\{5,6,7,8,9\}$
. Similar to Maoz et al. (Reference Maoz, Kuperman, Terris and Talmud2006), Braithwaite et al. (Reference Braithwaite, Dasandi and Hudson2016) compute regular equivalence scores for countries within the trade network to detect the roles states adopt in the core–periphery structure of the international economic network. Using these positions, Braithwaite et al. (Reference Braithwaite, Dasandi and Hudson2016) find that the roles adopted within this core–periphery structure predict whether a state is more or less likely to experience civil conflict.
The aforementioned strategies are not without their limitations. First, and foremost, allowing roles to vary every year may make interpretation difficult. This is particularly true in highly dynamic networks where an actor’s position in the network changes frequently. Second, in the previous models, only network position informs role assignment. This is problematic as both endogenous topological features and exogenous node or dyad characteristics in a node’s ego-network may inform role assignments. The ego-TERGM provides a flexible modeling approach to detect time-invariant roles conditional upon a variety of network statistics, including both endogenous dependencies and exogenous covariates.
4 Introducing the ego-TERGM
The ego-TERGM is a finite mixture model that attempts to detect heterogeneity in the composition of each ego-network within a broader longitudinal network.Footnote 6 It does this by assigning each ego-network to a cluster according to the similarity of a set of TERGM parameters. This is accomplished through using an unsupervised latent class model based upon the mixture model-based finite clustering of TERGM parameters. In other words, the ego-TERGM attempts to cluster a set of nodes within a longitudinal network (egos) into a predefined number of time-invariant classes (clusters) according to the similarity of each longitudinal ego-network (TERGM model parameters).
4.1 Deriving the Ego-TERGM
The ego-TERGM is based upon a similar model derived for cross-sectional networks by Salter-Townshend and Murphy (Reference Salter-Townshend and Murphy2015) and introduced by Box-Steffensmeier et al. (Reference Box-Steffensmeier, Campbell, Christenson and Navabi2018), the ego-ERGM. The ego-ERGM, as a finite mixture model, assumes that each cross-sectional ego-network has probabilities associated with belonging to a user-specified and finite number of clusters, or roles,
 $G$
. For each possible role
 $g\in G$
there is some probability that the node belongs to that particular role. For all nodes, the naive probability of belonging to
 $g$
,
 $\unicode[STIX]{x1D70F}_{g}$
, sums to one across all
 $g\in G$
, creating a vector
 $\text{}\underline{\unicode[STIX]{x1D70F}}$
.Footnote
7
These probabilities are conditional upon a vector of role specific parameters,
 $\text{}\underline{\unicode[STIX]{x1D703}}_{g}$
, modeled and estimated through an ERGM. Note that
 $\boldsymbol{\unicode[STIX]{x1D703}}$
refers to the
 $G\times H$
matrix of model parameters where
 $H$
is equal to the number of terms specified and
 $\text{}\underline{\unicode[STIX]{x1D703}}_{g}$
refers to the
 $g^{th}$
row of matrix
 $\boldsymbol{\unicode[STIX]{x1D703}}$
. Salter-Townshend and Murphy (Reference Salter-Townshend and Murphy2015) model the prior mixture of data generating process as the probability of an ego-network
 $\mathbf{Y}_{i}$
:
 $$\begin{eqnarray}{\mathcal{P}}(\mathbf{Y}_{i}\mid \text{}\underline{\unicode[STIX]{x1D70F}},\boldsymbol{\unicode[STIX]{x1D703}})=\mathop{\sum }_{g=1}^{G}\unicode[STIX]{x1D70F}_{g}\exp \{\text{}\underline{\unicode[STIX]{x1D703}}_{g}^{\prime }h(\mathbf{Y}_{i})-\unicode[STIX]{x1D6FE}(\text{}\underline{\unicode[STIX]{x1D703}}_{g})\}.\end{eqnarray}$$
In Equation (1),
 $h(\mathbf{Y}_{i})$
refers to a series of endogenous and/or exogenous statistics computed on the network and
 $\text{}\underline{\unicode[STIX]{x1D703}}_{g}$
refers to the vector of model parameters for group
 $g$
. Those familiar with ERG-family models will acknowledge that the largest headache for using these models is the normalizing constant,
 $\unicode[STIX]{x1D6FE}(\text{}\underline{\unicode[STIX]{x1D703}}_{g})$
, which refers to the sum of all possible permutations of the network
 $\mathbf{Y}_{i}$
where the number of nodes remains constant and the number of ties varies from a perfectly empty network to a perfectly full network. This normalizing constant, necessary to calculate the probability of the observed network conditional on model estimates, becomes computationally intractable as the number of nodes in a network increases. As such, it is typically approximated through maximum pseudolikelihood estimation (MPLE) or Markov chain maximum likelihood estimation (MCMLE).Footnote
8
The mixture model for a cross-sectional network can be extended to a single time slice in a longitudinally observed network by conditioning on
 $q^{th}$
order autoregression. This produces the probability of observing a particular ego-network
 $\mathbf{Y}_{i}$
at time
 $t$
as a function of the mixing proportions for all clusters
 $\text{}\underline{\unicode[STIX]{x1D70F}}$
, model-based parameters of
 $\boldsymbol{\unicode[STIX]{x1D703}}$
and the prior
 $q$
observations of that particular ego-network:
 $$\begin{eqnarray}{\mathcal{P}}(\mathbf{Y}_{i,\,t}\mid \text{}\underline{\unicode[STIX]{x1D70F}},\boldsymbol{\unicode[STIX]{x1D703}},\mathbf{Y}_{it-q})=\mathop{\sum }_{g=1}^{G}\unicode[STIX]{x1D70F}_{g}\,\exp \{\text{}\underline{\unicode[STIX]{x1D703}}_{g}^{\prime }h(\mathbf{Y}_{it},\mathbf{Y}_{it-1},\ldots ,\mathbf{Y}_{it-q})-\unicode[STIX]{x1D6FE}(\text{}\underline{\unicode[STIX]{x1D703}}_{g})\}.\end{eqnarray}$$
This mixture model in Equation (2) sums over the ERGM for all groups
 $g\in G$
, where the probability of the network for group
 $g$
is a function of group-level parameters
 $\text{}\underline{\unicode[STIX]{x1D703}}_{g}$
, a series of statistics computed on the ego-network, and previous iterations of the ego-network normalized by
 $\unicode[STIX]{x1D6FE}(\text{}\underline{\unicode[STIX]{x1D703}}_{g})$
. From this conditional probability, the likelihood of observing a time slice of the broader network,
 $\mathbf{Y}_{t}$
, is derived by making the assumption that each ego-network is independently distributed and then taking the product of each ego-network’s mixture model from Equation (2):Footnote
9
 $$\begin{eqnarray}{\mathcal{P}}(\mathbf{Y}_{t}\mid \text{}\underline{\unicode[STIX]{x1D70F}},\boldsymbol{\unicode[STIX]{x1D703}},\mathbf{Y}_{t-q})=\mathop{\prod }_{i=1}^{N}\left[\mathop{\sum }_{g=1}^{G}\unicode[STIX]{x1D70F}_{g}\exp \{\text{}\underline{\unicode[STIX]{x1D703}}_{g}^{\prime }h(\mathbf{Y}_{it},\mathbf{Y}_{it-1},\ldots ,\mathbf{Y}_{it-q})-\unicode[STIX]{x1D6FE}(\text{}\underline{\unicode[STIX]{x1D703}}_{g})\}\right].\end{eqnarray}$$
This likelihood is then pooled over all time periods
 $t\in T$
by taking the product of each time-slice likelihood from Equation (3) to produce the likelihood of observing the full time series of networks
 $\mathbf{Y}_{T}$
. To produce independence across time periods, one need only condition upon a
 $q^{th}$
order autoregressive process (Cranmer and Desmarais Reference Cranmer and Desmarais2011; Desmarais and Cranmer Reference Desmarais and Cranmer2012):
 $$\begin{eqnarray}\displaystyle {\mathcal{P}}(\mathbf{Y}_{T}\mid \text{}\underline{\unicode[STIX]{x1D70F}},\boldsymbol{\unicode[STIX]{x1D703}},\mathbf{Y}_{t-q})=\mathop{\prod }_{i=1}^{N}\left[\mathop{\sum }_{g=1}^{G}\mathop{\prod }_{t=1}^{T}\unicode[STIX]{x1D70F}_{g}\,\exp \{\text{}\underline{\unicode[STIX]{x1D703}}_{g}^{\prime }h(\mathbf{Y}_{it},\mathbf{Y}_{it-1},\ldots ,\mathbf{Y}_{it-q})-\unicode[STIX]{x1D6FE}(\text{}\underline{\unicode[STIX]{x1D703}}_{g})\}\right]. & & \displaystyle\end{eqnarray}$$
Note that in Equations (3) and (4) the
 $i$
subscript on the left-hand side is removed to aggregate this up to the full network observed at a single time slice in Equation (3) and the full time series of networks in Equation (4). While this model is pooled, it also accounts for
 $q^{th}$
order autoregression for each network observed while iteratively incrementing
 $t$
for each time step. To reiterate, when moving from Equation (3) to Equation (4), the subscript
 $t$
becomes
 $T$
as the probability of all
 $\mathbf{Y}_{t}\in \mathbf{Y}_{T}$
is modeled in Equation (4).
As previously noted, there are two forms of independence that must be considered: the independence of ego-networks and the independence of time slices. First, it seems unclear whether each ego-network is independent as they are, almost by definition, overlapping to some degree. The inclusion of a node
 $j$
in the undirected ego-network of node
 $i$
necessarily implies that node
 $i$
is included in the undirected ego-network of node
 $j$
. Salter-Townshend and Murphy (Reference Salter-Townshend and Murphy2015) note this problem in their derivation of the cross-sectional ego-ERGM, noting that the model is more of a pseudolikelihood model than a true likelihood model. The consequence of violating this independence assumption, as noted by Brandes and Lerner (Reference Brandes and Lerner2007), Salter-Townshend and Murphy (Reference Salter-Townshend and Murphy2015), and Box-Steffensmeier et al. (Reference Box-Steffensmeier, Campbell, Christenson and Navabi2018), is that these nodes
 $i$
and
 $j$
are more likely to be assigned to the same cluster. In more general terms, these overlapping and adjacent ego-networks will lead ERG-based mixture models like the ego-ERGM and ego-TERGM to cluster proximal nodes at higher rates than distal nodes (Salter-Townshend and Murphy Reference Salter-Townshend and Murphy2015, 525). This phenomenon is a well documented feature, not a bug, of many other node clustering methods which do not sort nodes in dense subgraphs (Brandes and Lerner Reference Brandes and Lerner2007, 12). In many cases, this particular consequence may not be problematic if analysts expect structurally similar nodes to adopt the same role (Box-Steffensmeier et al.
Reference Box-Steffensmeier, Campbell, Christenson and Navabi2018, 220).
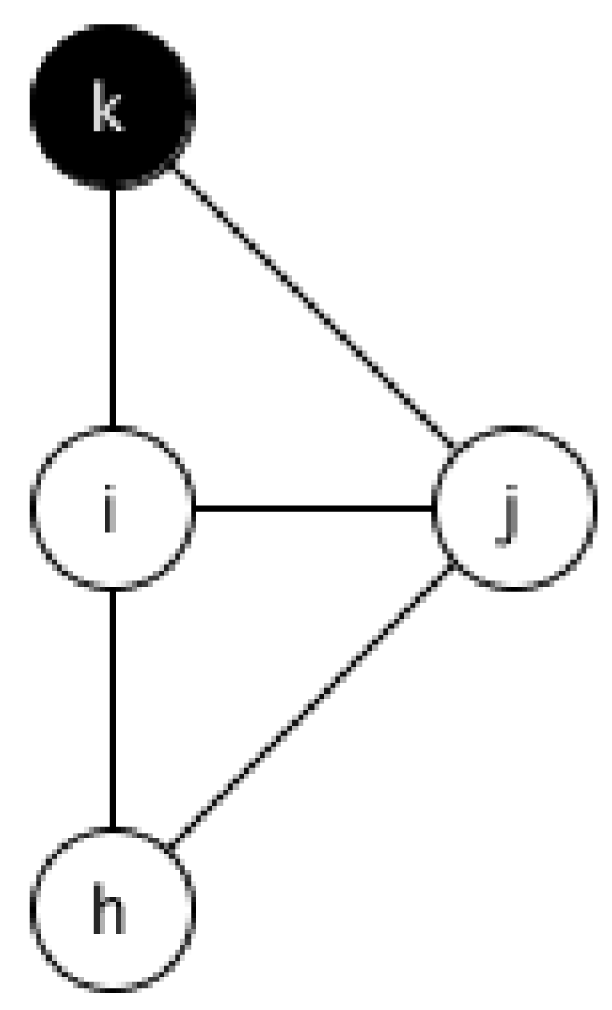
Consider a simple four node network illustrated in Figure 2 that contains nodes
 $h$
,
 $i$
,
 $j$
, and
 $k$
where
 $k$
is of some arbitrary type (partisan identification, etc.) that is distinct from other nodes in the network. A simple homophily model would assign nodes
 $h$
,
 $i$
, and
 $j$
all to the same role as their presence in each other’s ego-network necessarily implies that they each have the same covariate portfolio: three homophilous edges. In certain applications this implication may be more problematic than in others, any users of this technique must consider a violation of this assumption accordingly.
Simple example of overlapping ego-centric networks. Nodes are colored by some arbitrary type.

Second, by taking the product across all time slices, as done in Equation (4), one is assuming that conditioned upon
 $q^{th}$
order autoregression, each temporally observed ego-network is independent (Cranmer and Desmarais Reference Cranmer and Desmarais2011; Desmarais and Cranmer Reference Desmarais and Cranmer2012).Footnote
10
One is certainly not required to treat temporal dependence as a nuisance. The roles actors adopt may be informed by temporal dynamics associated with their ego-network such as a tendency toward tie stability, creation, or loss. Given the outstanding concern of potential dependence across ego-networks, one should view the likelihood previously presented in the vein of a pseudolikelihood similar to Salter-Townshend and Murphy (Reference Salter-Townshend and Murphy2015).
An expectation–maximization (EM) algorithm is then used to find maximum likelihood estimates for
 $\boldsymbol{\unicode[STIX]{x1D703}}$
as role assignments are unknown and missing parameters. These role assignments are captured through an unobserved parameter vector
 $\text{}\underline{Z}_{i}=(Z_{i1},Z_{i2},\ldots ,Z_{iG})$
where
 $Z_{ig}$
is the probability that node
 $i$
belongs to role
 $g$
.
 $\mathbf{Z}$
is an
 $N\times G$
matrix of latent and unobserved cluster assignment probabilities comprised row-wise by all vectors
 $\text{}\underline{Z}_{i}$
. It is noted here that these indicators are not subscripted by time, and thus, are assumed to reflect a process where a node maintains the same role
 $g$
over all time periods. As the number of possible roles
 $G$
is time-invariant, this is a pooled version of the model.Footnote
11
When this indicator is treated as missing data, the complete data log-likelihood for a particular time slice of the longitudinal network
 $\mathbf{Y}_{t}$
is derived as follows:
 $$\begin{eqnarray}{\mathcal{P}}(\mathbf{Y}_{t},\mathbf{Z}\mid \text{}\underline{\unicode[STIX]{x1D70F}},\boldsymbol{\unicode[STIX]{x1D703}},\mathbf{Y}_{t-q})=\mathop{\prod }_{i=1}^{N}\mathop{\prod }_{g=1}^{G}[\unicode[STIX]{x1D70F}_{g}\,\exp \{\text{}\underline{\unicode[STIX]{x1D703}}_{g}^{\prime }h(\mathbf{Y}_{it},\mathbf{Y}_{it-1},\ldots ,\mathbf{Y}_{it-q})-\unicode[STIX]{x1D6FE}(\text{}\underline{\unicode[STIX]{x1D703}}_{g})\}]^{Z_{ig}}.\end{eqnarray}$$
For the complete pooled model, one must simply take the product across all iterations of the network across time to get the ego-TERGM likelihood. To reiterate, in this case,
 $\mathbf{Y}_{T}$
refers to the time series of networks, producing the complete data likelihood for the pooled model:
 $$\begin{eqnarray}{\mathcal{P}}(\mathbf{Y}_{T},\mathbf{Z}\mid \text{}\underline{\unicode[STIX]{x1D70F}},\boldsymbol{\unicode[STIX]{x1D703}},\mathbf{Y}_{t-q})=\mathop{\prod }_{i=1}^{N}\mathop{\prod }_{g=1}^{G}\mathop{\prod }_{t=1}^{T}[\unicode[STIX]{x1D70F}_{g}\,\exp \{\text{}\underline{\unicode[STIX]{x1D703}}_{g}^{\prime }h(\mathbf{Y}_{it},\mathbf{Y}_{it-1},\ldots ,\mathbf{Y}_{it-q})-\unicode[STIX]{x1D6FE}(\text{}\underline{\unicode[STIX]{x1D703}}_{g})\}]^{Z_{ig}}.\end{eqnarray}$$
From this, the log-likelihood can be derived in Equation (7):
 $$\begin{eqnarray}\displaystyle \log [{\mathcal{P}}(\mathbf{Y}_{T},\mathbf{Z}\mid \text{}\underline{\unicode[STIX]{x1D70F}},\boldsymbol{\unicode[STIX]{x1D703}},\mathbf{Y}_{t-q})] & = & \displaystyle \mathop{\sum }_{i=1}^{N}\mathop{\sum }_{g=1}^{G}\mathop{\sum }_{t=1}^{T}Z_{ig}\,\log [\unicode[STIX]{x1D70F}_{g}\,\exp \{\text{}\underline{\unicode[STIX]{x1D703}}_{g}^{\prime }h(\mathbf{Y}_{it},\ldots ,\mathbf{Y}_{it-q})-\unicode[STIX]{x1D6FE}(\text{}\underline{\unicode[STIX]{x1D703}}_{g})\}]\nonumber\\ \displaystyle & = & \displaystyle \mathop{\sum }_{i=1}^{N}\mathop{\sum }_{g=1}^{G}\mathop{\sum }_{t=1}^{T}Z_{ig}\{\log \,\unicode[STIX]{x1D70F}_{g}+\text{}\underline{\unicode[STIX]{x1D703}}_{g}^{\prime }h(\mathbf{Y}_{it},\ldots ,\mathbf{Y}_{it-q})-\log \,\unicode[STIX]{x1D6FE}(\text{}\underline{\unicode[STIX]{x1D703}}_{g})\}.\end{eqnarray}$$
4.2 Model Estimation
As
 $\mathbf{Z}$
is a matrix of latent and unobserved cluster assignment probabilities, and the estimation of group-level parameters is contingent upon its composition, ego-TERGM estimation reflects a recursive process that requires an iterative estimation technique. To estimate the ego-TERGM, an EM algorithm is used with a two-step initialization procedure similar to that used by Salter-Townshend and Murphy (Reference Salter-Townshend and Murphy2015) to uncover the following:
∙
 $N\times G$
matrix of estimated probabilities for actor-level
$n_{i}$
role assignments (
$\hat{\mathbf{Z}}$
). Note that this matrix is not indexed by time, indicating that cluster assignments are time-invariant.
∙
$G$
length vector of estimated baseline probabilities of assignment (
$\hat{\text{}\underline{\unicode[STIX]{x1D70F}}}$
).∙
$G\times H$
matrix of estimated group-level parameters (
$\hat{\boldsymbol{\unicode[STIX]{x1D703}}}$
). As previously noted,
$H$
refers to the number of statistics computed on each longitudinally observed ego-network.Footnote
12


The estimation routine begins using a two-step initialization process. First, for each node that ever appears in
 $\mathbf{Y}_{T}$
, a TERGM is estimated using bootstrapped MPLE (Cranmer and Desmarais Reference Cranmer and Desmarais2011; Desmarais and Cranmer Reference Desmarais and Cranmer2012). To adjust for the influence of network size on parameter estimates, an offset term is included to adjust for network size (Krivitsky, Handcock and Morris Reference Krivitsky, Handcock and Morris2011). Second, once the parameters for each TERGM are estimated, they are clustered using a
 $k$
-means algorithm (Hartigan and Wong Reference Hartigan and Wong1979). This provides initial estimates for
 $\mathbf{Z}$
and
 $\text{}\underline{\unicode[STIX]{x1D70F}}$
which can then be passed on to the EM algorithm and used to maximize Equation (7) (Dempster et al.
Reference Dempster, Laird and Rubin1977). Role parameters
 $\boldsymbol{\unicode[STIX]{x1D703}}$
are then set equal to the cluster means for the group-based parameters.
From this initialization procedure, an EM algorithm is used to find the estimates for
 $\text{}\underline{\unicode[STIX]{x1D70F}}$
,
 $\mathbf{Z}$
, and
 $\boldsymbol{\unicode[STIX]{x1D703}}$
which were most likely to produce
 $\mathbf{Y}_{T}$
. EM algorithms, introduced by Dempster et al. (Reference Dempster, Laird and Rubin1977), are conventionally used to extrapolate unknown model information including missing data or parameters (Gill Reference Gill2014). As noted by Gill (Reference Gill2014), EM finds unbiased parameter estimates assuming that the likelihood function is unimodal. This assumption may vary according to the complexity of model specification, and as such, must be considered by the user.
Broadly, EM algorithms proceed in two steps. The first general step of an EM algorithm is to generate temporary data that represent a reasonable guess for unknown parameter values. In the case of the algorithm utilized here, mirroring that developed by Salter-Townshend and Murphy (Reference Salter-Townshend and Murphy2015), role assignments
 $\mathbf{Z}$
for iteration
 $u$
are computed based upon the pooled TERGM parameters for all observations
 $i$
at iteration
 $u-1$
. In the second step, parameter estimation proceeds as if there is complete data. For the ego-TERGM algorithm, the complete data log-likelihood presented in Equation (7) is maximized to update pooled ego-TERGM estimates. In more formal terms, the EM algorithm is written as follows:Footnote
13
1. Let
$u=0$
reflect the estimates from the initial
$k$
-means clustering initialization, where
$\text{}\underline{\hat{\unicode[STIX]{x1D70F}}}^{(0)}$
and
$\hat{\boldsymbol{\unicode[STIX]{x1D703}}}^{(0)}$
represent the initial estimates of the mixing proportions and centroids.2. E-Step: This step is repeated for all nodes and for all groups. Compute the expected role assignments for a particular node in a particular group,
$\hat{Z}_{ig}$
, based upon current model parameters where
$P(\mathbf{Y}_{iT}\mid \text{}\underline{\unicode[STIX]{x1D703}}_{g})$
can be understood as the conditional probability of observing the longitudinally observed ego-network
$\mathbf{Y}_{iT}$
conditioned on group-level parameters and mixing parameters: (8)$$\begin{eqnarray}\hat{Z}_{ig}^{(u)}=\frac{\hat{\unicode[STIX]{x1D70F}_{g}}^{(u-1)}P(\mathbf{Y}_{iT}\mid \text{}\underline{\hat{\unicode[STIX]{x1D703}}}_{g}^{(u-1)})}{\mathop{\sum }_{j}\hat{\unicode[STIX]{x1D70F}}_{j}^{(u-1)}P(\mathbf{Y}_{iT}\mid \hat{\text{}\underline{\unicode[STIX]{x1D703}}}_{j}^{(u-1)})}.\end{eqnarray}$$
3. M-Step: Maximize the expected complete data log-likelihood to yield new and updated parameter estimates:
(9)$$\begin{eqnarray}(\text{}\underline{\unicode[STIX]{x1D70F}}^{(u)},\hat{\boldsymbol{\unicode[STIX]{x1D703}}}^{(u)})=\text{argmax}_{\text{}\underline{\unicode[STIX]{x1D70F}},\unicode[STIX]{x1D703}}\mathop{\sum }_{i=1}^{N}\mathop{\sum }_{g=1}^{G}\mathop{\sum }_{t=1}^{T}\hat{Z}_{ig}^{(u)}\log [\unicode[STIX]{x1D70F}_{g}P(\mathbf{Y}_{it}\mid \text{}\underline{\unicode[STIX]{x1D703}}_{g})]].\end{eqnarray}$$
4. Check for convergence, if it has converged then stop, otherwise, move to the next iteration and increment
$u$
, returning to Step 2. Convergence occurs if the log-likelihood changes by less than
$10^{-6}$
.


4.3 Model Specification and Fit
The selection of terms to include in the sufficient network statistics for
 $h(\mathbf{Y}_{i})$
or the number of groups
 $G$
to fit is not clear cut. It is recommended that the analyst rely upon a combination of model selection tools (including the Bayesian Information Criterion or BIC), substantive intuition, and sensitivity analysis. The use of BIC may not always produce the best fitting model when used to select model terms as it is based upon pseudolikelihood and highly collinear ERGM terms (Hunter, Goodreau and Handcock Reference Hunter, Goodreau and Handcock2008). However, BIC has been found to be more effective in selecting appropriate values for
 $G$
(Salter-Townshend and Murphy Reference Salter-Townshend and Murphy2015). Regardless, caution is required and Kass and Raftery (Reference Kass and Raftery1995) recommend using a difference of ten or greater as suggestive evidence for the preferability of one model to another. BIC for the ego-TERGM is calculated using the estimated log-likelihood (
 $\hat{{\mathcal{L}}}$
), the number of roles specified (
 $G$
), the number of model terms (
 $H$
), the number of egos included in the network (
 $N$
), and the number of time periods (
 $T$
):
 $$\begin{eqnarray}BIC=2\hat{{\mathcal{L}}}-(GH+G-1)\log (NT).\end{eqnarray}$$
Unsurprisingly, model specification should be theoretically motivated. Presumably the analyst has some number of roles they expect to be present within the network, and this number of clusters should inform the value of
 $G$
chosen. Additionally, selecting a higher value for
 $G$
need not imply that
 $G$
clusters are actually fit. If the EM algorithm determines that assigning nodes to three roles produces the maximum likelihood, three roles will be fit, even if a
 $G>3$
is chosen. Alternatively, selecting a value
 $G=3$
will constrain the number of roles fit to at most three. The specification of terms for
 $h(\mathbf{Y}_{i})$
should also be theoretically motivated. These terms and the parameters associated with them are used to distinguish between roles and influence role assignments.
To assess the relative importance of
 $G$
values or particular terms to the prevalence of roles, a sensitivity based approach is recommended (Box-Steffensmeier et al.
Reference Box-Steffensmeier, Campbell, Christenson and Navabi2018). The intuition for
 $G$
selection is quite simple, if
 $G$
is changed but the cluster assignments remain unchanged, then
 $G$
might reflect a well-fitting value. For term selection, the intuition is still simple. Within an
 $h$
-dimensional Euclidean space, the inclusion of a given term
 $h\in H$
should transform the space and influence the probability that a node is assigned to a particular role.
This sensitivity analysis may be conducted two ways. First, one may look at the role assignments, defined as a node’s most likely cluster assignment, to determine if the substantive implications of clustering change by adjusting model specification. This is what is typically referred to as the role assignment through this manuscript. Second, one may look closer at the changes in the probability of assignments to assess if the role assignment becomes more or less certain by excluding a covariate.Footnote 14
4.4 Assessing the Role-Generating Process
While the ego-TERGM is first and foremost a clustering algorithm, designed to sort nodes into finite groups based upon a set of model terms, interpretable coefficients can be estimated that describe the role-generating process. Salter-Townshend and Murphy (Reference Salter-Townshend and Murphy2015) find that the centroids used to sort nodes cannot be interpreted as parameters describing the role-generating process. However, one may use pooled TERGMs to assess the structure of ego-networks associated with a role easily. Networks assigned to the same role are thought to be of a shared data generating process. Using cluster assignments from the ego-TERGM, networks are pooled into sets by common membership. A bootstrapped TERGM (Cranmer and Desmarais Reference Cranmer and Desmarais2011; Desmarais and Cranmer Reference Desmarais and Cranmer2012), specified as the analyst desires, is then estimated on the pooled networks. The SI Appendix contains a deeper discussion and proof of concept for this routine.
Unbiased likelihood estimates of the role’s generative structure will be estimated when the networks are independent of one another. In this case, two forms of dependence may induce bias. First, time slices belonging to the same ego-network may possess autoregressive tendencies and produce temporal dependence (Cranmer and Desmarais Reference Cranmer and Desmarais2011). As such, an analyst must condition out any autoregression prior to pooling. This is easily accomplished through including a memory term, such as tie stability, loss, or innovation, when calculating change statistics for a time slice prior to pooling and bootstrap sampling (Leifeld, Cranmer and Desmarais Reference Leifeld, Cranmer and Desmarais2017). Second, there may be dependence between overlapping ego-networks that include the same actors. This form of dependence may be difficult to condition out and will imply that TERGM estimates are highly influenced by high-degree nodes that appear in many networks. However, this may not necessarily be a significant problem or a “bug” as these high-degree nodes could be an important feature of the role’s generative structure. In other words, even if these high-degree nodes are included in multiple networks, these nodes may not be oversampled. In fact, it is possible their higher rate of inclusion is substantively expected. Regardless, an analyst must carefully consider these forms of dependence before using this routine—while estimates will be returned, they may not reflect the true likelihood estimates and must be interpreted accordingly.
4.5 Simulation Study
To assess whether the ego-TERGM is capable of detecting roles according to similarity in TERGM model parameters, a Monte Carlo simulation study was conducted as a proof of concept and to examine the conditions that influence model performance.Footnote
15
This study approximates the equivalent cross-sectional study of Salter-Townshend and Murphy (Reference Salter-Townshend and Murphy2015): 30 longitudinally observed ego-networks were simulated over five distinct time periods according to three distinct sets of model parameters or clusters.Footnote
16
This Monte Carlo has a
 $3^{2}$
factorial design, yielding nine treatment combinations. First, the size of each ego-network takes on one of three values per treatment combination:
 ${\mathcal{N}}_{ego}\in \{20,30,40\}$
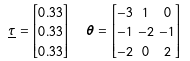
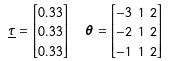
. Ego-network size is important to examine as it produces a multiplicative increase in the prevalence of triadic closure in the network and should produce greater consistency in model parameter estimates. Second, the mixture of data generating processes is allowed to vary according to three sets of parameters. The first mixture uses the simulation parameters from Salter-Townshend and Murphy (Reference Salter-Townshend and Murphy2015), presented in Table 1. This should represent the easiest experimental condition.Footnote
17
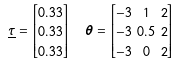
The second mixture uses the same terms as the prior mixture (Edges, GWESP (
 $\unicode[STIX]{x1D6FC}=0.8$
), GW Degree (
 $\unicode[STIX]{x1D6FC}=0.8$
)) but allows the degree of triadic closure to vary by a minuscule margin of
 $0.5$
while all other model parameters are held constant. These simulation parameters are presented in Table 2. The third and final set of parameters uses the same terms as the prior DGPs but allows the relative density of each DGP to vary by a minor amount, as evidenced by a change in the value of the edges term by
 $1$
. The density condition simulation parameters are presented in Table 3. One set of 90 networks observed over five time periods and three DGPs is simulated per experimental condition.Footnote
18
ERGM Parameter Values for Conventional DGP. Rows refer to roles and columns refer to parameters.

ERGM Parameter Values for Triadic Closure Condition. Rows refer to roles and columns refer to parameters.

ERGM Parameter Values for Density Condition. Rows refer to roles and columns refer to parameters.

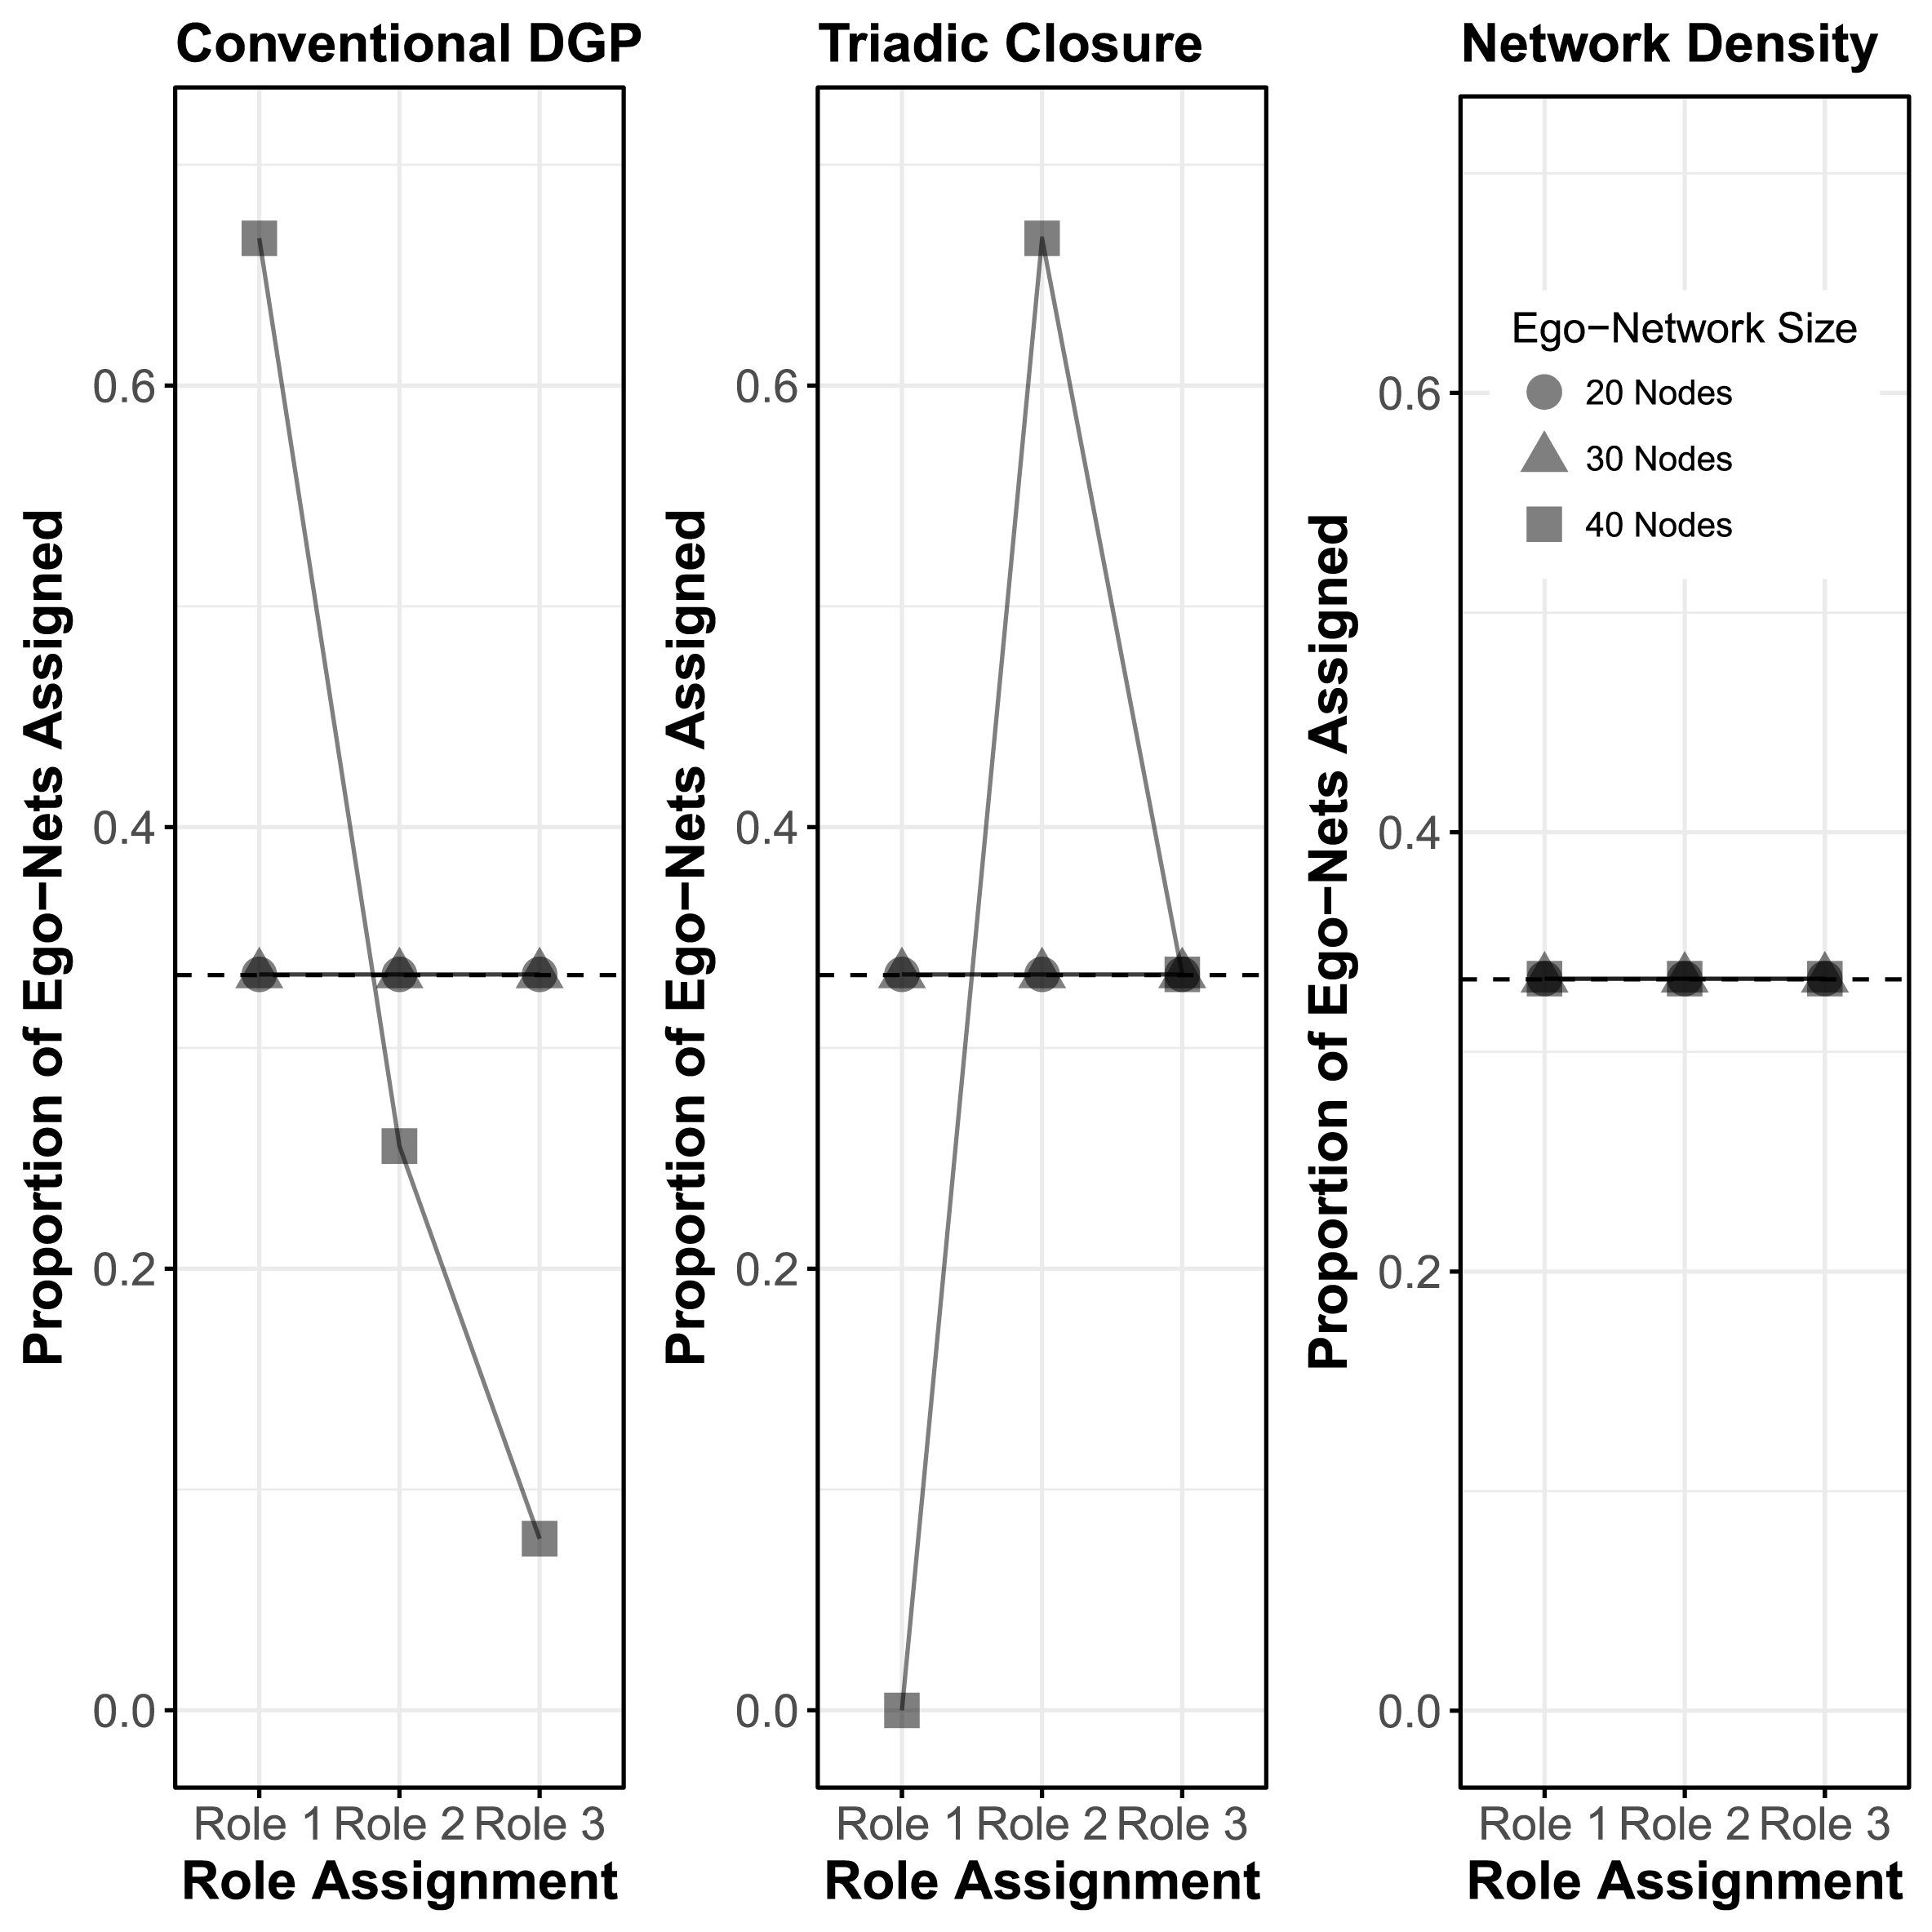
Overall, the results from the Monte Carlo, presented in Figure 3, are favorable. When considering the conventional Salter-Townshend and Murphy (Reference Salter-Townshend and Murphy2015) DGP with the simulation parameters presented in Table 1, ego-networks with a size between 20 and 30 nodes are accurately clustered 100% of the time. Problems appear to emerge when the size of the ego-network is 40, with a slight imbalance in the proportion of role assignments. This is likely a result of minuscule heterogeneity between mixtures that are amplified by the size of the network, which is to say, that Roles 1 and 2 appear to be relatively similar under the conventional DGP, and these similarities are amplified by a larger network and collinearity between model terms.
Ego-TERGM Monte Carlo Simulation Study Results. Each plot refers to a different mixture of data generating processes while the shape of points refers to different ego-network sizes. Dashed line at 0.33 refers to perfect classification.

For the second data generating process, presented in Table 2 with results in the second panel of Figure 3, the ego-TERGM appears to do well. The model fares exceptionally well when the size of each ego-network ranges between 20 and 30 nodes, achieving an accurate classification rate of 100%. However, when the size of the ego-networks becomes larger (40 nodes), only two roles are retrieved, with nodes that would otherwise be classified as Role 1 being classified as Role 2 nodes. This appears to be a function of the relative similarity of the GWESP simulation parameters for Roles 1 and 2 and the multiplicative nature of the GWESP statistic in large networks. A great degree of triadic closure creates problems for any clustering method as ego-networks approaching full connectivity and density are difficult to distinguish.
Finally, the model appears to perform exceptionally well when the only factor distinguishing between roles is the relative density of the ego-networks. For the density condition, with a DGP presented in Table 3 and results presented in the third panel of Figure 3, network size does not appear to matter. Regardless of ego-network size, nodes are accurately clustered with 100% accuracy.
The prior Monte Carlo study has demonstrated that the ego-TERGM fares well even under very difficult and potentially uncommon conditions. The model performs best with ego-networks between 20 and 30 nodes and when the key factor thought to influence heterogeneity in DGPs is relative network density. Alternatively, the model does not appear to do well in large networks where nodes are distinguished between minuscule differences in the rate of triadic closure. This is to be expected given the multiplicative relationship between network size and the possibility for triadic closure. This news is not damning as ego-networks with a size greater than 20 or 30 are relatively rare. Nevertheless, when analysts encounter such networks they must be careful when they expect a great degree of triadic closure. Overall, this demonstrates the promise of using network topology to cluster nodes according to similarity in DGPs. In the following section, the substantive importance of the ego-TERGM are presented in the form of a pedagogical application to the Kapferer (Reference Kapferer1972) strike network.
5 Pedagogical Application: Kapferer Strike Network
While the preceding sections have built the case for the internal validity of the ego-TERGM, a question remains—can the ego-TERGM illustrate substantively important roles? In this section the model is applied to a canonical longitudinal network, the Kapferer (Reference Kapferer1972) network of worker interactions during labor negotiations in a Zambian tailor shop. Examining this network is pedagogically useful as it can demonstrate the roles and role structure that emerge within a collective action context and a well-known network constituted by actors with different objectives.Footnote 19 Kapferer observed interactions within a Zambian tailor shop over a period of ten months, examining patterns of socioemotional interaction during wage negotiations. He observed the undirected network of 39 nodes in two-month-long waves, seven months apart, before and after an unsuccessful strike. In addition to gathering data on socioemotional interactions, Kapferer collected data on the social status ascribed to workers based upon their job.
Kapferer understood the importance of treating ego-networks as heterogeneous. Kapferer (Reference Kapferer1972) argued that to understand the structure of this network, one must develop actor-oriented approaches and treat structure as an emergent property of interaction, arguing that “Structure is not a given: it is itself the result of social process” (336). In other words, he viewed structure as emerging from a complex series of social interactions, including heterogeneity in the motives leading actors to form relationships. In his study, this proposition was confirmed. Seeing the status ascribed to a job as informing individual interests, and social interaction as an indicator for common interests among workers, Kapferer found a polarized structure for the tailor shop. This polarization was also a function of exogenous factors, finding that workers’ interests became increasingly divergent as one group took a position which alienated themselves from those in political power, officials at the local trade union branch, and conciliators at the union office. In addition to this polarized structure, social movement was a common feature of the network. As interests changed or workers spent time with different individuals, some workers were bound to change their place within the network.
Typically when one considers network polarization, one might expect a network tendency toward two distinct network communities (e.g., the partisan nature of the congressional cosponsorship network). Kapferer, instead, likely expected a core–periphery structure as there are incentives for actors to form rare relationships with peers of different statuses (Kapferer Reference Kapferer1972, 188). As such, there is a prior expectation that two prominent roles are likely to exist – In-Group and Out-Group. First, it is expected that most workers toward the core of the network would share common interests and form relationships accordingly. These workers are those who were likely in relative agreement about the strike and represented one end of the polarized structure (Kapferer Reference Kapferer1972). These nodes are referred to as In-Groupers. Second, it is expected that a relatively few number of workers would break with the dominant position within the network and would comprise the Out-Group role. These workers are referred to as Out-Groupers. It is expected that these nodes exist largely on the periphery of the network as they reflect the other end of Kapferer (Reference Kapferer1972)’s polarized structure.
While primary emphasis is placed on these two previously mentioned roles, an additional role might be expected for those workers who either go from having many (or few) relationships in one period to having few (or many) in the other. These workers are referred to as Movers.Footnote 20
A pooled ego-TERGM with a
 $G$
value of 3 was estimated to understand the structural roles that workers adopt within this undirected network. When sampling each ego-network, first-order alters and the relationships among them are considered. To assist with model identification, each ego-network must have at least five nodes to be included. Only one worker, Worker 20, is excluded in this way. Selecting the minimum network size parameter requires balance, if this size is too small there may be insufficient information for the initialization procedure, if too large then meaningful and interesting role dynamics may be lost. The value of five was chosen to ensure all ego-networks were large enough to allow for model estimation. The minimum network size parameter is not directly related to the selection of
 $G$
and only indirectly related in that once accounting for network size, there must be sufficient networks for
 $G$
clusters to be fit. In addition, it should be noted that Kapferer’s strike network is a network constituted by overlapping ego-networks, in which case, one should acknowledge that nodes that are clustered more closely together are more likely to be assigned to the same role (Brandes and Lerner Reference Brandes and Lerner2007; Salter-Townshend and Murphy Reference Salter-Townshend and Murphy2015; Box-Steffensmeier et al.
Reference Box-Steffensmeier, Campbell, Christenson and Navabi2018).
To distinguish among these roles, four model terms are specified for the ego-TERGM: the number of edges within the network, a nodal covariate for eigenvector centrality, a nodal covariate for standardized degree centrality, and a heterophily term for the status ascribed to the job each node has in the shop.Footnote 21 While some features, such as a tendency toward triadic closure or shared partners, may be thought to influence role assignment, their inclusion as model terms created identification problems. However, they are later used to assess role generative structure.Footnote 22 These model terms are theoretically motivated and based upon the preceding discussion of the In-Groupers, Out-Groupers, and Movers roles. My interpretation and substantive discussion will largely follow Kapferer (Reference Kapferer1972) in focusing on the two main factions of the network – In-Groupers and Out-Groupers. Given that status homophily is an important feature of this network, it is not expected that the heterophily term will distinguish between these two factions. It is nevertheless included as it is an important feature of the network. Alternatively, a tendency toward triadic closure may distinguish among these roles. In particular, it would make sense for there to be a strong tendency toward triadic closure in the ego-network of In-Groupers that might not exist for Out-Groupers. There may also be a greater tendency to form ties with highly central nodes (with respect to eigenvector and degree centrality) within the local ego-network for In-Groupers than Out-Groupers. As such, node covariates for both terms are used.
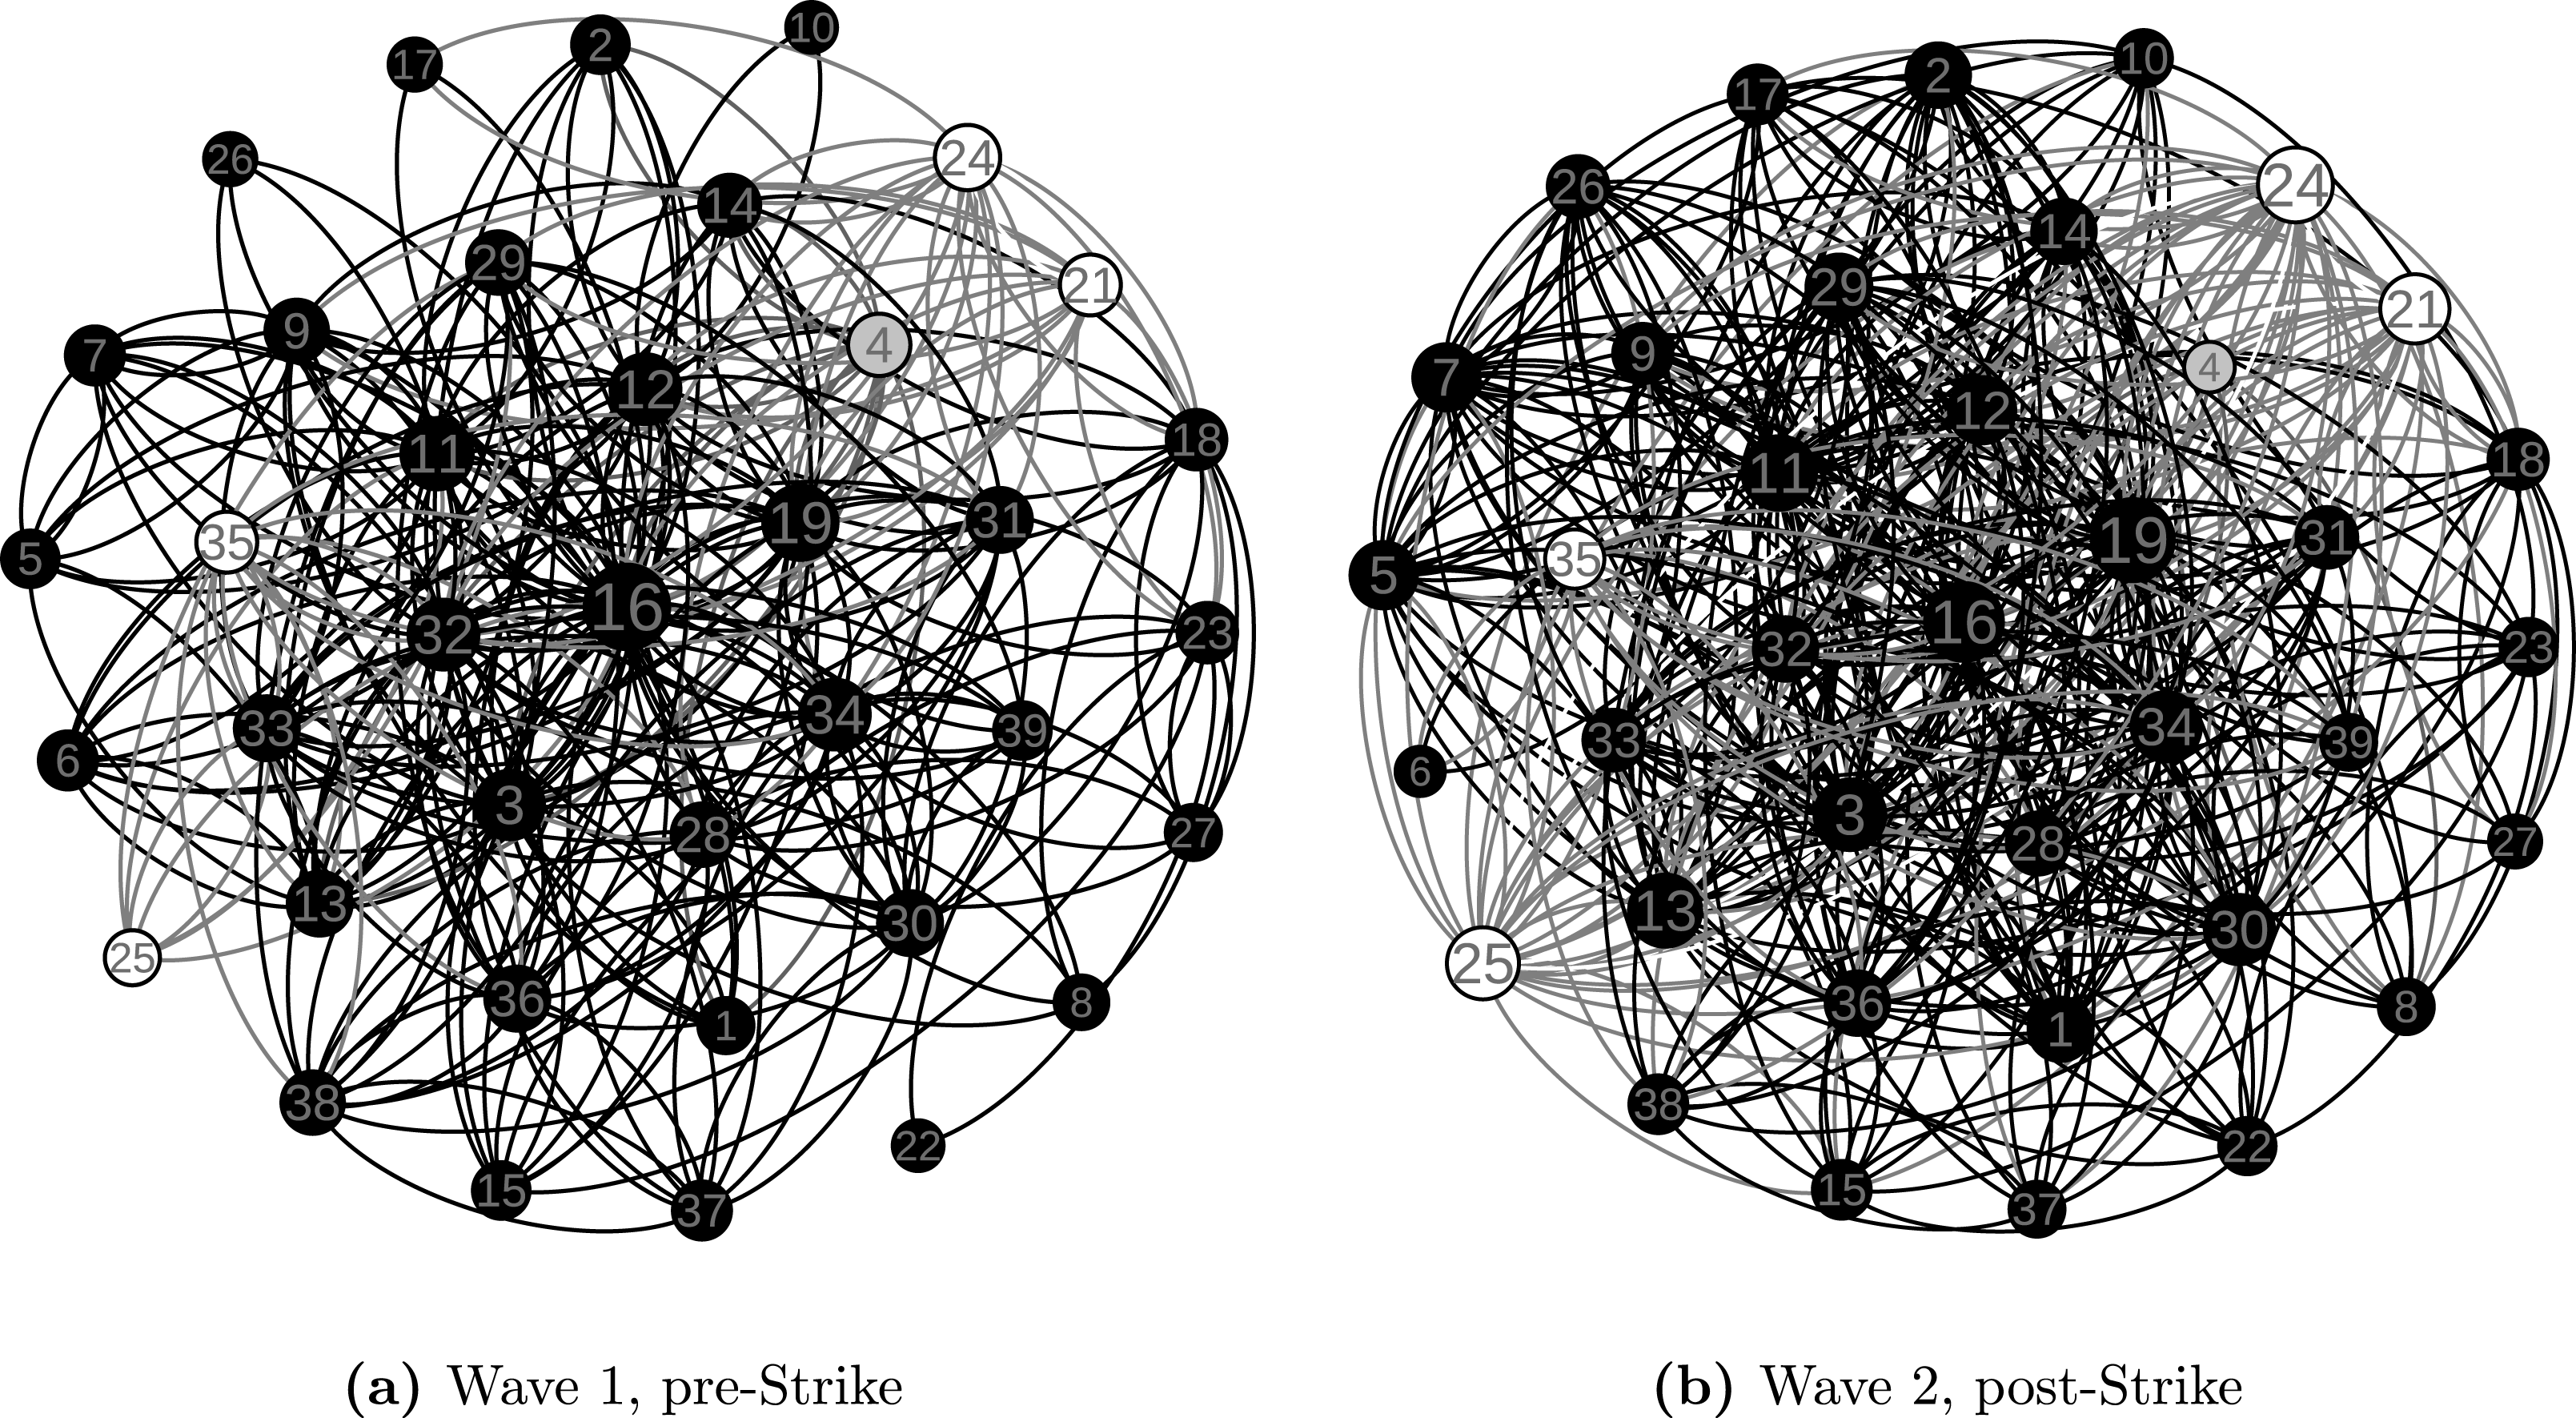
Kapferer Network Role Assignments. Nodes are colored according to role assignment and sized according to degree. Networks plotted using a Fruchterman–Reingold projection for Wave 1 with Wave 2 adopting the same node positions. Model BIC is -13689.82.

Results from this model are presented in Figure 4. Workers are colored by their maximum probability of role assignment and sized by degree. This figure presents strong support for the previous theory. Three sets of workers emerge, reflecting both the core–periphery structure and the Movers role previously hypothesized. The workers colored in black appear to reflect the In-Groupers role, constituting the majority of the network while residing primarily within its core. The workers colored in white, which exist on the periphery of the network and make up a minority of the network, reflect the Out-Groupers role. The remaining node, colored in gray, reflects the Movers role and has at least five connections in one period and less than five in the other.
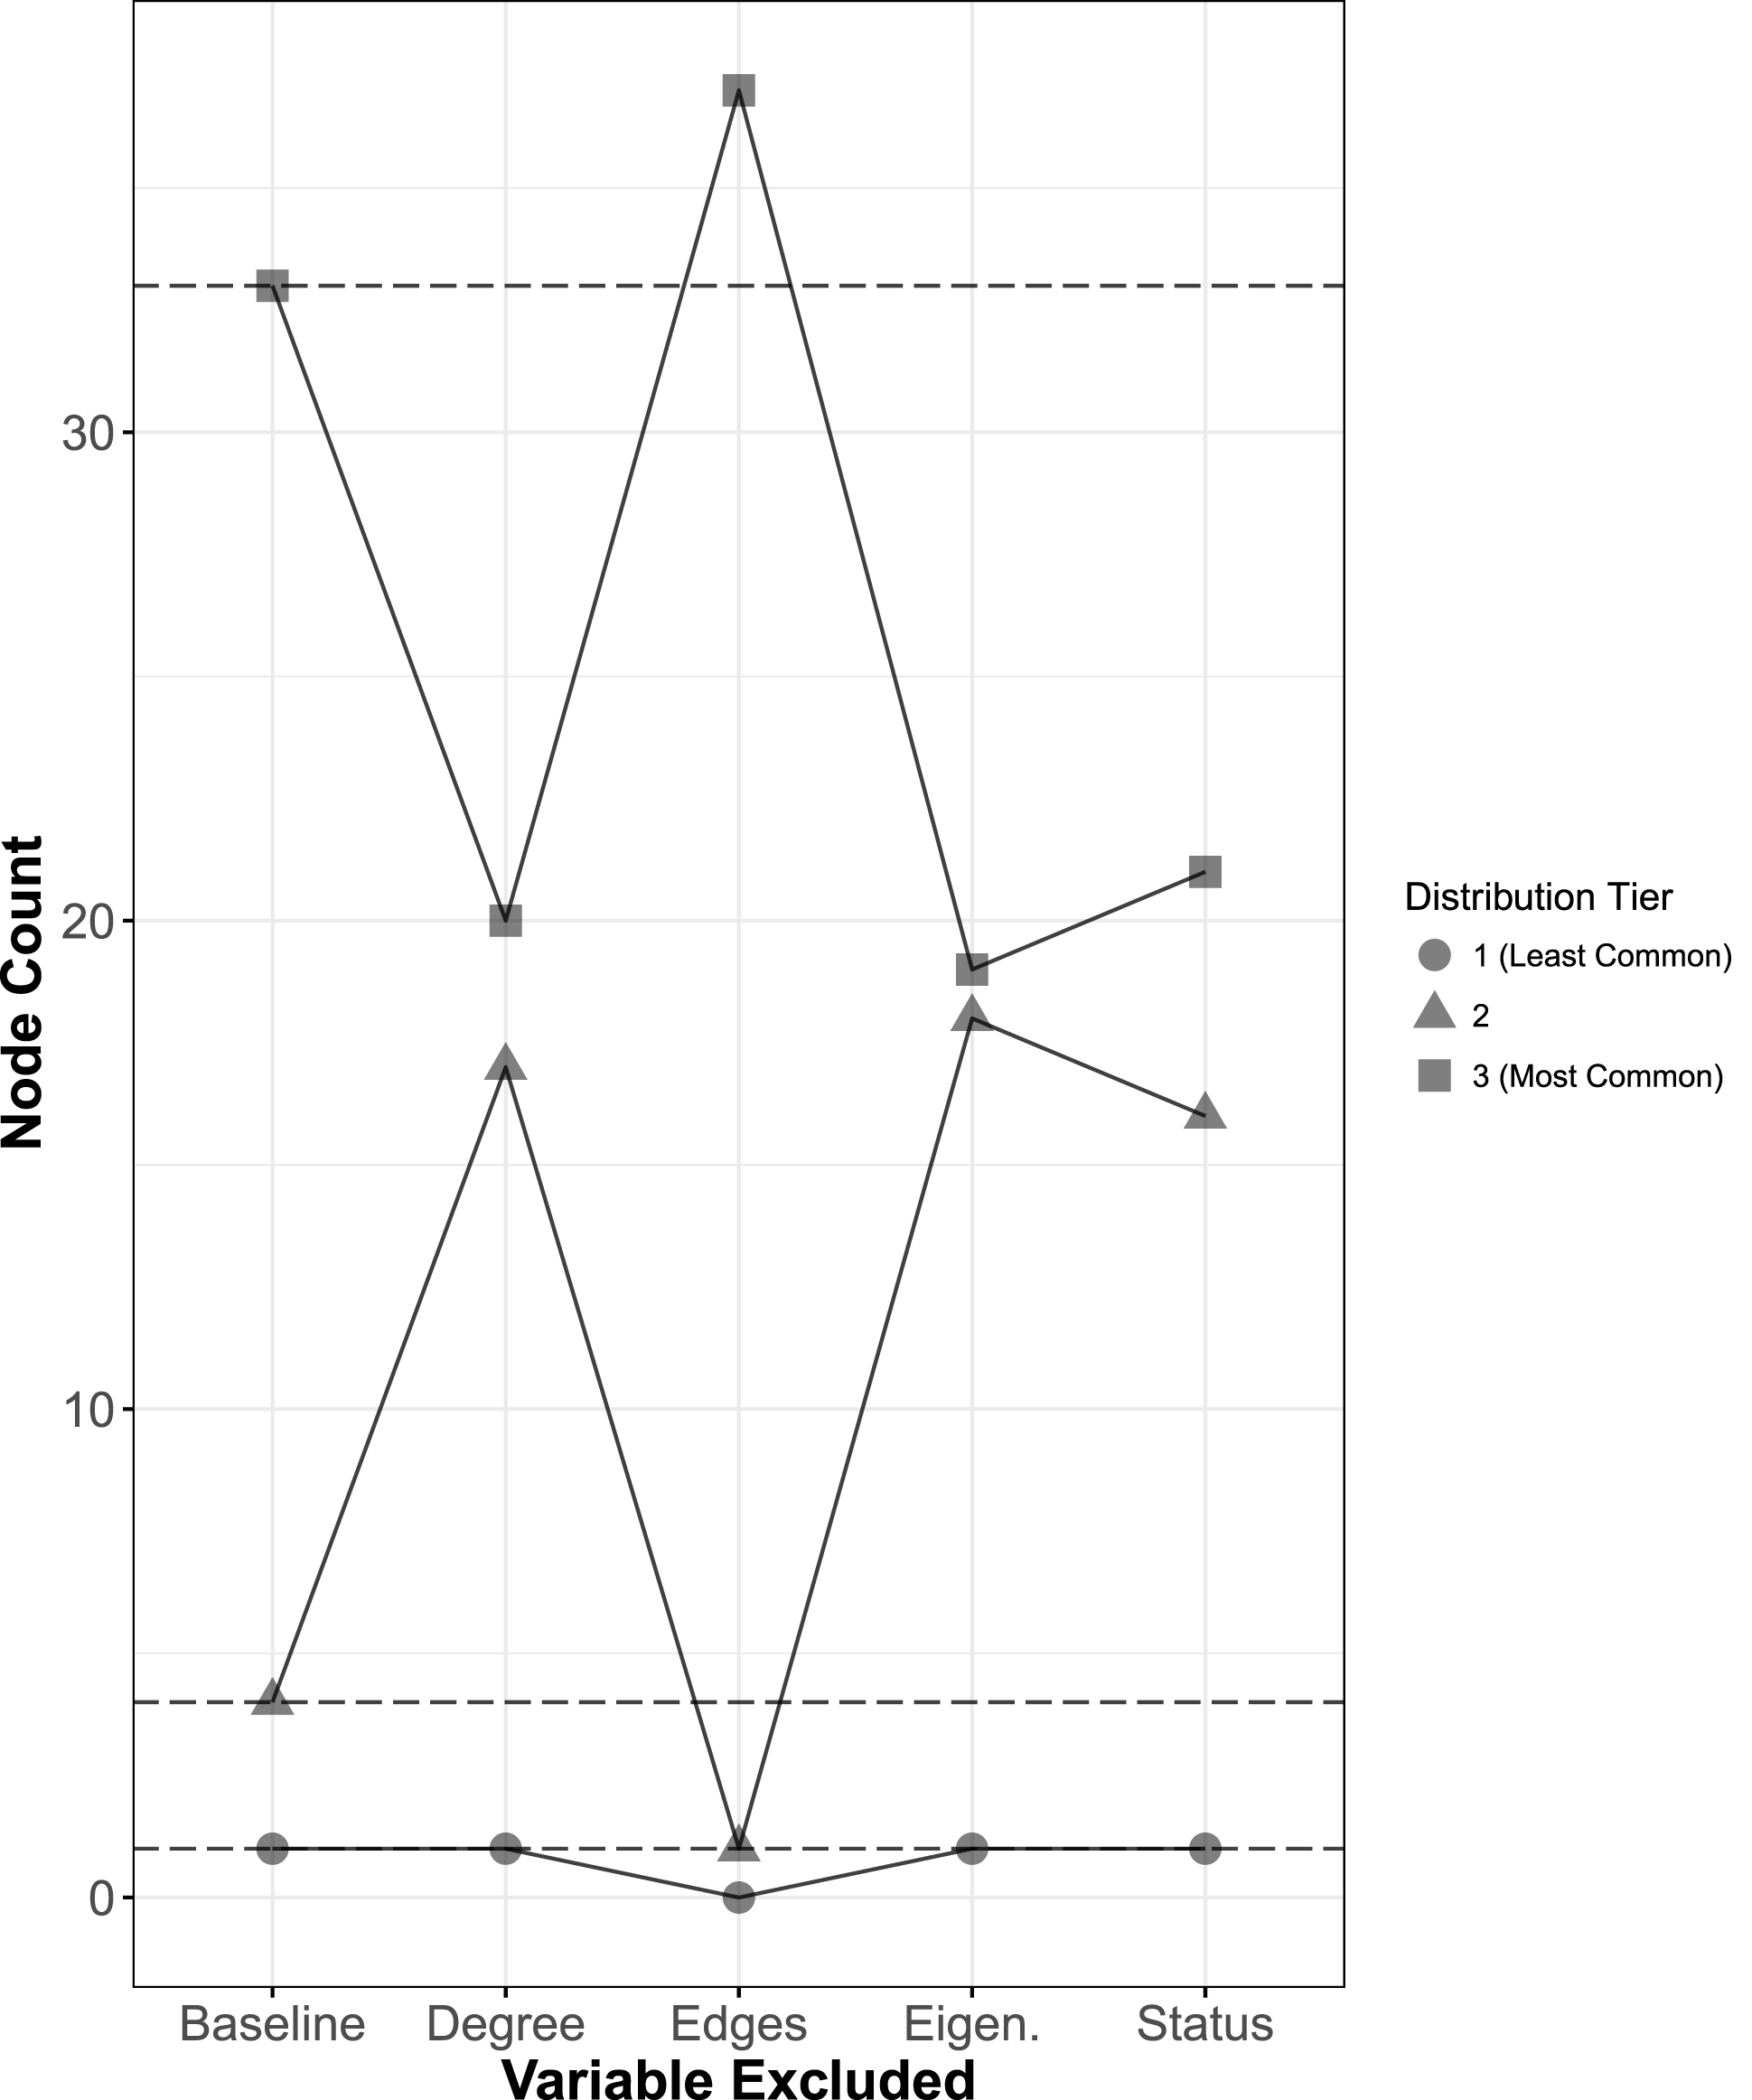
To assess model fit and how sensitive role assignments are to the inclusion of particular covariates, four different ego-TERGMs are estimated with one variable iteratively excluded from the previously described model. Sensitivity analysis for the Kapferer application demonstrates that each term included in the model—edges, eigenvector centrality, degree centrality, and status homophily—contributes to the role assignments in some meaningful way. In other words, the iterative exclusion of each term results in changes in cluster assignments.
Figure 5 presents a graphical representation of these results. Recall that label switching makes direct comparison of the size of each cluster difficult. As a heuristic, cluster sizes are sorted according to the smallest (Least Common) to largest (Most Common) size within a model and compared to their counterpart in another model. Baseline assignments appear to be highly informed by each term as the exclusion of model terms leads to dramatic changes in each cluster’s size. Overall the eigenvector and degree centrality terms appear to exercise the most influence, as their removal leads to a dramatic decrease in the largest role, In-Groupers, and an increase in the number of Out-Groupers. This indicates that when including both of these covariates, the model gains useful information that assists in distinguishing between these two roles. A similar pattern plays out, to a lesser extent, for both the status heterophily term and the node covariate for degree centrality.
Kapferer Sensitivity Analysis. Groupings refer to the largest to smallest cluster sizes. Dashed lines refer to the cluster sizes for the baseline model.

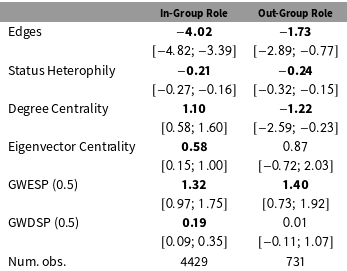
To further understand the generating process for the In-Groupers and Out-Groupers role, a pooled TERGM is fit to both roles according to the routine outlined in Section 4.4. In addition to the four terms used in the ego-TERGM—node covariates for eigenvector centrality and degree centrality, status heterophily, and edges—measures of triadic closure and shared partners are included. This measure, Geometrically Weighted Edgewise Shared Partners (GWESP), allows the analyst to measure triadic closure while down-weighting the prevalence of expected triangles to assist in model fit (Snijders et al. Reference Snijders, Pattison, Robins and Handcock2006). To measure a tendency toward shared partners in a network, the Geometrically Weighted Dyadwise Shared Partners (GWDSP) term is used. The estimation of a pooled TERGM using these statistics should provide unbiased estimates of the role generative structure assuming the independence of the pooled ego-networks. In this application the network experiences an exogenous shock that should mitigate the autoregressive tendency of the network (Kapferer Reference Kapferer1972). However, the problem of overlapping ego-networks persists. As such, the estimates of this routine are more reflective of pseudolikelihood estimates.
Table 4 presents the results of the pooled TERGMFootnote 23 for the In-Group and Out-Group roles.Footnote 24 As Kapferer (Reference Kapferer1972) expected, the two roles do not appear to differ in the tendency of actors to form relationships with workers out of their status-group. Additionally, the average ego-network of an In-Grouper is typically comprised of workers with higher levels of degree centrality. This is expected given the core position that In-Groupers typically occupy. Counterintuitively, the two roles do not differ in their tendency to form cliques, as evidenced by a consistently positive effect for GWESP. In-Groupers also appear to have ego-networks constituted by nodes with higher eigenvector centrality relative to Out-Groupers, perhaps reflecting In-Groupers’ relative “popularity” within the network. Finally, In-Groupers appear to have a greater tendency toward sharing common partners than Out-Groupers which may make sense given their position at the core of the network.
TERGMs fit on Pooled Kapferer Group Assignments, 500 Replications. Bolded coefficients refer to estimates whose 95% confidence interval does not include 0.

This application of the ego-TERGM to the Kapferer strike network finds rigorous empirical support for a core–periphery theory that many at the time found both interesting and inspiring (Heisler Reference Heisler1973; Heath Reference Heath1974; Bailey Reference Bailey1975). In testing a core–periphery theory of actor-oriented network development, a theory ripe for the ego-TERGM, three results are unearthed. First, the core–periphery role structure appears to be particularly sensitive to the number of edges within the ego-networks and the eigenvector centrality node covariate. This indicates that In-Groupers and Out-Groupers may sort on these two covariates. Second, pooled TERGMs indicate that the largest difference in the role generative structure for these two networks appears to be in their relative tendencies to form ties with highly central workers with respect to degree, with the feature being much more common for In-Groupers than Out-Groupers. In-Groupers also appear to have a greater tendency toward being popular, measured by GWDSP, relative to their Out-Grouper counterparts. Third, and most importantly, the ego-TERGM is capable of uncovering regularities consistent with theoretical expectation. While providing empirical support for Kapferer (Reference Kapferer1972)’s hypotheses is important, this application demonstrates that the ego-TERGM can recover known role structure.
6 Conclusion
Increasingly network analysts are interested in analyzing the latent structural roles that exist in complex social systems (Brandes and Lerner Reference Brandes and Lerner2007; Welser et al. Reference Welser, Cosley, Kossinets, Lin, Dokshin, Gay and Smith2011; Box-Steffensmeier et al. Reference Box-Steffensmeier, Campbell, Christenson and Navabi2018). While it is fortunate that techniques exist for inferring and detecting these roles in cross-sectional networks (Salter-Townshend and Murphy Reference Salter-Townshend and Murphy2015), this literature will soon stagnate without a means of assessing roles in longitudinally observed networks. In this manuscript, such a tool is introduced. The ego-TERGM is a mixture model capable of examining the time-invariate roles that exist within these increasingly examined longitudinal networks through comparing the ego-network of one actor to others. Not only is the ego-TERGM computationally efficient, made possible through the use of an EM algorithm, but a Monte Carlo simulation study and pedagogical application to the Kapferer (Reference Kapferer1972) demonstrate that it is exceptionally accurate in classifying roles.
By thinking outside of the approaches designed to assess the generative structure of an entire network, such as the ERGM and the LSM, analysts can learn a great deal through assessing subnetwork variation and heterogeneity. The ego-TERGM provides a novel opportunity to analyze the roles constituting a network and may offer a number of empirical insights. In addition, a conceptual framework for analyzing roles in dynamic networks is presented.
Extending the ego-ERGM to account for temporal dynamics allows for the principled consideration of role stability or change, providing means to test previous theories integral to social networks. This methodological and conceptual innovation makes it possible to answer a number of classic political questions beyond those considered in the application, including the roles underlying international politics (Holsti Reference Holsti1970; Wendt Reference Wendt1999; Lake Reference Lake2013; Mitzen Reference Mitzen2013) and congressional collaboration (Fowler Reference Fowler2006; Craig Reference Craig2017).
Consider one of the larger problems plaguing the field of International Relations. For decades International Relations scholars have acknowledged that military alliances can serve a litany of purposes (Holsti Reference Holsti1970; Schroeder Reference Schroeder1994). However, due to the difficulty in considering the different purposes alliances could serve and the monumental undertaking in collecting data on them, analysts have simply assumed that military alliances are means of balancing or countering an external security threat (Leeds et al. Reference Leeds, Ritter, Mitchell and Long2002). The ego-TERGM offers the opportunity to infer these latent purposes simply conditional upon indicators that may distinguish one alliance from another. This provides an opportunity to unify theory with practice, and to examine whether states and alliances all serve the same purpose (Waltz Reference Waltz1979), or whether they adopt specialized roles (Schroeder Reference Schroeder1994). The ego-TERGM also shows great promise in examining American politics, especially congressional collaboration and interest group coalitions. Within congress, actors are typically thought to adopt roles consist with their leadership position (e.g., majority leader, whip, etc.). The ego-TERGM offers an opportunity to assess whether roles emerge beyond these simple positions through examining congressional collaboration networks (Fowler Reference Fowler2006; Craig Reference Craig2017). In addition, it provides an opportunity to further the literature on interest group coalitions. The roles uncovered by Box-Steffensmeier et al. (Reference Box-Steffensmeier, Campbell, Christenson and Navabi2018) reflect the roles interest groups adopt when lobbying on environmental issues. Examining the temporal dynamics of coalition politics may shed light on how these coalitions evolve within different policy issues and may answer the fundamental question of politics: who gets what, when, and how?
Supplementary material
For supplementary material accompanying this paper, please visit https://doi.org/10.1017/pan.2018.20.