Introduction
Two basic features of the dynamics of a population are average abundance, whether a species is common or rare, and temporal population variability, whether abundance fluctuates widely from year-to-year or not. For many insects with annual life cycles, year-to-year changes in abundance are thought to be associated with short-term environmental change, for example, a warm spring, a drought, or a sudden change in host–plant availability. If such environmental factors are primary determinants of population variability, then species with similar life histories living in the same habitat would be expected to have similar levels of population variability. For such species, however, PV is often a species-specific trait (Cappuccino Reference Cappuccino1987; Lamb et al. Reference Lamb, MacKay and Alyokhin2011; Galloway and Lamb Reference Galloway and Lamb2015). Furthermore, populations from different habitats sometimes exhibit similar population variabilities, in spite of differences in environmental fluctuations that occur among their habitats (Lamb and MacKay Reference Lamb and MacKay2010; Lamb et al. Reference Lamb, MacKay and Wool2012). On the other hand, differences between habitats can affect population variability, as illustrated by the higher variability for populations of a leaf beetle (Coleoptera: Chrysomelidae) in host monocultures than in natural stands of the host (Dalin et al. Reference Dalin, Kindvall and Björkman2009). Life histories seem to be adapted in ways that affect population variability. For example, host-specificity is thought to affect population variability of insects, although the test of this hypothesis proved equivocal (Redfearn and Pimm Reference Redfearn and Pimm1988). In general, traits that influence temporal population variability of insects are poorly understood, and rarely examined in long-term studies that might provide robust tests of hypotheses.
Here we focus on the hypothesis that an introduced population is more temporally variable than a native one. We propose that the native population has had a longer time than the introduced one to adapt to aspects of the local habitat that cause population fluctuations. We suspect such adaptations would result in a fine tuning of responses to environmental change in a way that stabilises population dynamics. Rarely have native and introduced species been compared in this way, but in one of the few cases a native aphid showed lower population variability than two introduced ones (Lamb et al. Reference Lamb, MacKay and Alyokhin2011), consistent with the hypothesis.
To test the hypothesis, we compared temporal population variability of two herbivores that occur together in southwestern Québec, Canada, feed on the same host, carrots (Daucus carota var. sativus Hoffmann; Apiaceae), and are subject to the same short and long-term changes in weather. The carrot weevil, Listronotus oregonensis (LeConte) (Coleoptera: Curculionidae), is an indigenous species in North America (Simonet Reference Simonet1981), whereas the carrot rust fly, Psila rosae (Fabricius) (Diptera: Psilidae), was introduced from northern Europe late in the 19th century (Metcalf Reference Metcalf1999). Both are pests of commercial carrots growing in the muck soils where the study was conducted. As part of a pest management programme, adults of both species were sampled twice weekly from traps during the spring, summer and autumn for 33 years from 1983 to 2015. The hypothesis is refuted if this population of introduced carrot rust fly varies to a similar or lesser extent than that of the native carrot weevil. This hypothesis cannot be confirmed by comparison of only two species, but the similarity of the life histories of these two herbivores, and the long record of their population fluctuations at one location provide an opportunity to assess whether the hypothesis warrants further investigation for other introduced and native species.
We assume that trap catches provide an estimate of annual abundance, one that reflects year-to-year fluctuation in abundance for the two species. Trap catches of adults of these species are correlated with larval populations within host–plant roots (G.B., unpublished data). The temporal population variabilities of the two species were quantified by the metric PV (Heath Reference Heath2006). This metric is a proportion between 0 and 1, calculated as the sum of the absolute values of differences between all possible pairs of annual estimates of abundance in a time series, divided by the number of such differences. It has advantages compared with metrics such as standard deviation or coefficient of variation of annual abundance that previously were used for this purpose (Heath Reference Heath2006). For example, PV can be estimated for many distributions of annual abundance (Heath Reference Heath2006) and is normally distributed (Heath Reference Heath2006; Lamb et al. Reference Lamb, MacKay and Alyokhin2017). The metric PV is robust for various patterns of seasonal abundance (Lamb et al. Reference Lamb, MacKay and Alyokhin2013), and it is possible to statistically distinguish values of PV differing by as little as 0.06 in a range of 0–1 with time series of 15 or more years (Lamb et al. Reference Lamb, MacKay and Alyokhin2017). The metric PV has been used to test hypotheses about factors that affect temporal population variability for a leaf beetle (Dalin et al. Reference Dalin, Kindvall and Björkman2009), five aphid (Hemiptera: Aphididae) species (Lamb and MacKay Reference Lamb and MacKay2010; Lamb et al. Reference Lamb, MacKay and Alyokhin2011, Reference Lamb, MacKay and Wool2012), and five species of bird lice (Phthiraptera: Menoponidae, Philopteridae) (Galloway and Lamb Reference Galloway and Lamb2014, Reference Galloway and Lamb2015). The use of PV to investigate temporal population variability in a few vertebrate populations is summarised in these publications.
Materials and methods
The species studied
The carrot weevil is native to northeastern North America and its larvae feed in the roots of several wild plants including Umbelliferae (Boivin Reference Boivin1999). The carrot weevil has been reported as a pest of cultivated carrots, parsley, and celery in North America since the end of the 19th century (Whitcomb Reference Whitcomb1965; Simonet Reference Simonet1981). The adults overwinter in reproductive diapause and emerge in early spring. Females begin to oviposit when carrots reach the third true-leaf stage. Although adults are capable of flight, they disperse relatively short distances, usually by walking. In the 1980s, there was one generation per year in southwestern Québec (Boivin Reference Boivin1985), and when first generation adults appeared, in August and early September, day length was below 14 hours and the average temperature was below 25 °C. Under these conditions, the females enter reproductive diapause directly, thereby conserving resources for the following spring (Stevenson and Boivin Reference Stevenson and Boivin1990). As the local climate gradually warmed, first generation adults emerged earlier, thus under a longer photoperiod and a somewhat higher temperature. Under these conditions, an increasing proportion of females did not enter reproductive diapause and started to oviposit in late summer, producing a second generation. Thus, starting in the 1990s, a second generation appeared in late summer (Boivin Reference Boivin1999).
The carrot rust fly is also a pest of carrots but was accidentally introduced from northern Europe and was first found in Ottawa, Ontario, Canada in 1885 (Metcalf Reference Metcalf1999). In southwestern Québec, there are two generations per year and pupae overwinter (Boivin Reference Boivin1987). The adults oviposit in the soil near the carrot plant and the first-instar burrows into and feeds on the root radicels before entering the main root where it completes development (Degen et al. Reference Degen, Stadler and Ellis1999). The last instar exits the root and pupates a few centimetres from the root. The damage from the two pests can be distinguished as the carrot weevil larvae mostly feed on the upper third of the carrot root, whereas most of the damage from carrot rust fly larvae are in the lower half of the root.
Sampling
The study was conducted in carrot plots at the experimental farm of Agriculture and Agrifood Canada at Ste-Clotilde (45°09'N, 73°41'W) in southwestern Québec, Canada, in an area of muck soil that has been actively farmed for vegetables since the 1950s. Carrots, cultivars varied with the years, were cultivated from 1983 to 2016 in the same field. The carrot plot, 30 m by 30 m, was moved every few years 50 m away within the same field, to avoid buildup of carrot root knot nematodes (Meloidogyne hapla Chitwood; Nematoda: Heteroderidae).
Adults of the carrot weevil were captured in wooden plate traps, baited with a carrot, and covered by a wooden plate that permitted weevils to move in and out of the trap (Boivin Reference Boivin1985). Weevils accumulated in the trap, where they were counted in situ, before being released back into the population. Six traps were placed 5 m within the field and sampled twice weekly beginning in late April or early May and continuing until late September or October. The average catch per trap from six traps estimated the abundance of the weevil for each sample date. The baited traps were most attractive in spring but less so late in summer when the traps competed with a large population of carrots in the field.
Carrot rust fly adults were captured on yellow sticky traps (Stevenson Reference Stevenson1976; Boivin Reference Boivin1987). Three to six traps were placed 2 m apart, 1 m above the ground, and 4 m outside the carrot plot. Traps were monitored twice weekly over the same period as for carrot weevil, and the average catch per trap estimated abundance for each sample date.
For both species, seasonal patterns of abundance were assessed to determine which parameters might be most useful for estimating annual abundance. Zero-counts in samples after the first generation separated the generations in nearly all cases for both species. The total catch per trap for a generation, and total catch per trap for the year were calculated and used to estimate the abundance for a generation or the annual abundance, respectively. Population variability for each generation and species were estimated by PV using spreadsheets of trap catches (Microsoft® Excel 2010; Redmond, Washington, District of Columbia, United States of America), based on the formula provided by Heath (Reference Heath2006). We also estimated PV for some shorter time series to provide replicate estimates.
The relationship between annual abundance for the two species was assessed by Pearson’s Product Moment Correlation (SYSTAT Software 2009). The difference in PV between species was assessed by a t-test with three consecutive 11-year time series, or two 16–17-year time series, providing replicate estimates (SYSTAT Software 2009). Changes in PV over time (i.e., three consecutive 11-year time series) were analysed using general linear model and linear regression analyses (SYSTAT Software 2009).
Results
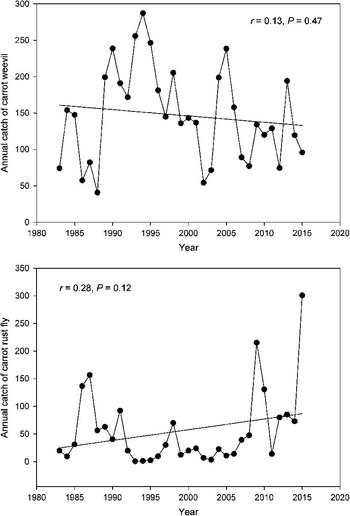
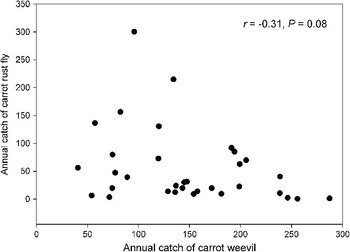
Generation 1 of the carrot weevil peaked in mid-May, earlier than the average peak for carrot rust fly that occurred on 7 June. Generation 2 of the carrot weevil was nearly always small, about 2% of generation 1, and not detected in five of 32 years, so that this second peak in late July was sometimes difficult to identify. Generation 2 of the carrot rust fly peaked in early September at more than twice the level of generation 1. The populations of carrot weevil and carrot rust fly neither increased or decreased significantly over the 33 years (Fig. 1). The annual catch of carrot rust fly was not significantly correlated with that of carrot weevil (r=−0.31, P=0.08, n=33), and therefore populations of the two species did not fluctuate together in response to year-to-year environmental change (Fig. 2).
The annual catch per trap (mean of six traps) for carrot weevil and carrot rust fly over 33-year time series of twice weekly samples, with the regression line relating catch to year (r is the correlation coefficient of the relationship, and P is the probability that the slope of the regression differs from 0).

The relationship between the annual catch per trap (mean of six traps) for carrot rust fly and carrot weevil over 33-year times series of twice weekly samples (r is the correlation coefficient of the relationship, and P is the probability that the coefficient differs from 0).

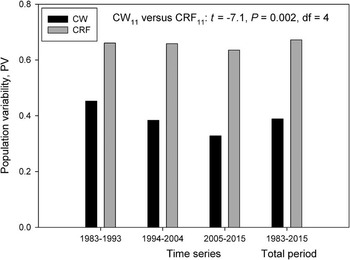
The estimate of PV for annual abundance over 33 years was lower for carrot weevil, 0.39, than for carrot rust fly, 0.67 (Fig. 3). This difference was significant based on a t-test, using three consecutive 11-year time series for each species as replicate estimates (Fig. 3) (SYSTAT Software 2009).
Population variability, estimated as PV (see text), of the annual catch per trap (mean of six traps) for carrot weevil (CW) and carrot rust fly (CRF), based on three successive 11-year time series and the 33-year time series. Results of a t-test comparing PV for the two species, using 11-year time series as replicates, are provided.

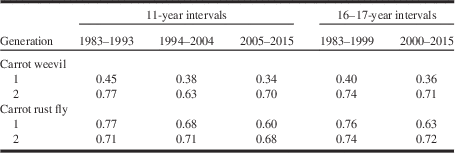
The PV values for the annual catch declined over three decades, by 27% for carrot weevil but only 4% for carrot rust fly (Fig. 3). A general linear model (SYSTAT Software 2009) confirmed the difference between the two species (F=121, P=0.002, df=1), but not the decline over three decades (F=7, P=0.08, df=1), although linear regression detected a decline in PV for carrot weevil (F=259, P=0.04, df=2). The possible decline in PV over time was analysed separately for the two generations using a general linear model (SYSTAT Software 2009). For generation 1, both species showed a decline in PV with time (species effect: F=259, P=0.001, df=1; time interval effect: F=41, P=0.008, df=1). The decline in PV was from 0.45 to 0.34 for carrot weevil and from 0.77 to 0.60 for carrot rust fly (Table 1). Regression slopes for the decline were −0.053 (±0.008, P=0.09, n=3) for carrot weevil, and −0.089 (±0.004, P=0.03, n=3) for carrot rust fly, a steeper decline for the latter species. For generation 1, declines in PV were also evident for two consecutive 16–17-year time series, 10% for carrot weevil and 17% for carrot rust fly (Table 1). For generation 2, no decline in PV (P>0.05) was detected for either species, although the trend was for lower PV for both species in the second half of the time series (Table 1). The decline in PV for both species was primarily due to a decline for generation 1.
Changes in population variability over time for two generations of carrot weevil and carrot rust fly in southern Québec, measured as PV (see text), for three consecutive 11-year or two consecutive 16–17-year intervals from a 33-year time series of abundance (annual number of adults per trap for each generation).

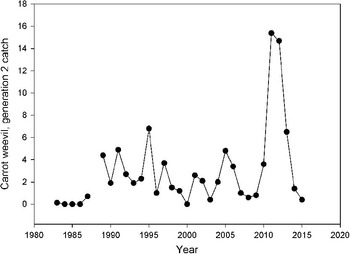
For a 33-year time series, generations 1 and 2 of carrot rust fly had the same PV, 0.71, but PV values for carrot weevil were 0.39 for generation 1 compared with 0.70 for generation 2. Generation 2 was so small for carrot weevil that this generation had little influence on the PV for annual abundance that was the same as for generation 1. The high PV for generation 2 of carrot weevil was due in part to the increasing trend in abundance for that generation (Fig. 4). Generation 2 was 0 or close to 0 from 1983 to 1987, fluctuated around two weevils (0–7 weevils) until 2010, before peaking in 2011–2012 at over 14 weevils per trap (Fig. 4).
The annual catch per trap (mean of six traps) for second generation carrot weevils over a 33-year time series of twice weekly samples.

Discussion
This comparison of annual abundance of carrot weevil and carrot rust fly populations living in the same habitat is consistent with the hypothesis that the temporal population variability of an introduced species is higher than that of a native one. The PV of 0.67 for carrot rust fly is substantially higher than the PV of 0.39 for carrot weevil. Lamb et al. (Reference Lamb, MacKay and Alyokhin2017) have shown that differences as small as 0.06 units of PV are reliably distinguished using 15-year time series for three species of Aphididae (Hemiptera), and so a difference of 0.28 units for a 33-year time series represents a clear difference. Furthermore, using three 11-year time series as replicates confirmed the difference in PV between the two species. The lower PV of a native species compared with an introduced one provides the first confirmation of this phenomenon, that was first proposed based on comparison of PV for native and introduced aphids (Lamb et al. Reference Lamb, MacKay and Alyokhin2011). Rising or declining abundance increases PV (Lamb et al. Reference Lamb, MacKay and Alyokhin2011) but cannot explain the differences in PV between carrot weevil or carrot rust fly because neither species shows a trend in abundance over the 33-year time series. The species did not fluctuate together, providing no evidence that they respond similarly to year-to-year environmental change.
For a population of the introduced carrot rust fly, a PV of 0.67 was intermediate among those for two introduced (0.77, 0.83) and three native aphid (Hemiptera: Aphididae) species (0.59, 0.58, 0.65) (Lamb and MacKay Reference Lamb and MacKay2010; Lamb et al. Reference Lamb, MacKay and Alyokhin2011, Reference Lamb, MacKay and Wool2012). The PV of 0.39 for carrot weevil is the lowest observed so far for any herbivorous insect, including Diptera and aphids mentioned above, and also a leaf beetle with PV values of 0.42 and 0.60 in natural stands and monocultures of willow (Salix Linnaeus; Salicaceae), respectively (Dalin et al. Reference Dalin, Kindvall and Björkman2009). The similarly low PV for the beetle in natural willow stands and that of the carrot weevil, begs two questions: would the PV for a population of carrot weevils developing in a natural habitat also be lower than that from a monoculture, and are PV values for herbivorous Coleoptera generally lower than those for herbivorous Diptera and Aphididae? Some species of ectoparasites of birds (Pthiraptera), with markedly different life histories than these herbivores, exhibit PV values (0.32, 0.35) slightly lower than that of the two Coleoptera, but other bird lice have PV values ranging from 0.44 to 0.55 (Galloway and Lamb Reference Galloway and Lamb2014, Reference Galloway and Lamb2015).
Populations of native species may be less variable because they have had a longer time to adapt to the characteristics of their habitats that cause temporal variation in abundance. If so, as an introduced species adapts to its new habitat, its population would be expected to become less variable with time. That phenomenon was observed for the carrot rust fly, with a lower PV at the end than at the beginning of the study, particularly for generation 1. The observed drop in PV of 17% was substantial considering that the evolutionary changes that caused this reduced variability took place over 33 years, about 25% of the time that the species has been present in North America.
The first generation of the carrot weevil also showed a decline in PV over the study, although less of a decline than carrot rust fly. This decline in PV could reflect the fact that the carrot weevil, although indigenous to the area of study, was originally attacking wild Umbelliferae. The populations found in southwestern Québec probably switched to cultivated carrots, an introduced species in North America, early in the 20th century, when the muck soil typical of this region started to be exploited. Another interesting aspect of the life history of this species is the appearance of a second generation over the last 25 years, in response to an increase in temperature. How the second generation, if it continues to increase in size, will affect the variability in abundance of this species remains to be determined. At present the PV of the second generation of carrot weevil is higher (PV=0.70) than for the first generation (PV=0.40), possibly reflecting the fact that the second generation arose recently.
The native carrot weevil and introduced carrot rust fly provide an example of how the temporal variability of populations decreases with the length of time they are in a habitat. Nevertheless, this is only one example of two species from the same agricultural habitat. Further examples and an understanding of the factors that contribute to PV are needed to confirm this hypothesis. Are the two carrot pests adapting their life histories to this new habitat in a way that stabilises their populations, are natural enemies adapting to these hosts in a new environment in a way that stabilises host populations, or are changes in abiotic conditions associated with climate change stabilising the populations?
Acknowledgements
The authors would like to thank Danielle Thibodeau, Josiane Vaillancourt, and Julie Frenette for technical assistance.