Since the passage of the Employee Retirement Income Security Act (ERISA) in 1974, corporate pension liabilities have become part of corporate liabilities, so that beneficiaries can in principle use the firm assets to cover any deficit with respect to accrued liabilities in case of termination of a pension plan. However, the practice of reporting pension liabilities at their historical value prevented beneficiaries and shareholders of the sponsor companies to correctly assess the impact of changes in market and credit risk factors on the value of the pension obligation. The situation is changing with the enforcement of international accounting standards SFAS 87.44 and IAS19.78, which recommend that pension obligations be valued on the basis of a discount rate equal to the market yield on AA corporate bonds, but this approach is still not fully satisfactory because it prescribes the use of the same market rate to discount all pension liabilities regardless of the sponsor credit rating, pension funding situations and asset allocation policy.
This paper introduces a formal model for the joint pricing of corporate bonds, equities and pension liabilities, viewed as contingent claims written on the operating assets of the firm and the financial assets held by the pension fund, in the spirit of the corporate debt model of Merton (Reference Merton1974). Despite its stylized nature, it can take into account a variety of factors. We include the tax advantage to debt and the bankruptcy costs, which have been long been recognized as important in the literature on corporate capital structure, and we discuss the impacts of surplus sharing rules between pensioners and other stakeholders and of the presence or the absence of the Pension Benefit Guaranty Corporation. It is important to stress that the goal of such a stylized model is not to generate quantitative recommendations that could be applied to actual pension funds, but instead to provide insights on how the various decisions made by the sponsor and the pension fund can impact the no-arbitrage values of claims issued by these entities.
In this regard, our paper is related to several strands of the literature. The first body of papers has focused on optimal portfolio choice in the presence of liabilities, but has abstracted away from the presence of the sponsor, although it can make up, at least partly, for deficits (Merton, Reference Merton1993; Sundaresan and Zapatero, Reference Sundaresan and Zapatero1997; Rudolf and Ziemba, Reference Rudolf and Ziemba2004; van Binsbergen and Brandt, Reference van Binsbergen and Brandt2007; Detemple and Rindisbacher, Reference Detemple and Rindisbacher2008; Martellini and Milhau, Reference Martellini and Milhau2012). The second strand to which our paper is related includes papers that have studied the pension fund problem from a corporate finance perspective (Sharpe, Reference Sharpe1976; Treynor, Reference Treynor1977; Black, Reference Black1980; Tepper, Reference Tepper1981; Harrison and Sharpe, Reference Harrison, Sharpe, Bodie and Shoven1983; Bicksler and Chen, Reference Bicksler and Chen1985; Bodie, Reference Bodie1990; Scherer, Reference Scherer2005; Kocken, Reference Kocken2009), but, with the exception of Harrison and Sharpe (Reference Harrison, Sharpe, Bodie and Shoven1983), were cast in a one-period model and did not conduct a formal analysis of the dependence between the aforementioned decisions and the rational pricing of liabilities. A common feature of most of these models is that they predict extremal solutions to the optimal pension funding and investment policy problems involving either funding as little as possible and using allocation decisions to maximize default risk so as to take advantage of the insurance provided by the nation-wide pension guarantee fund if it exists (Sharpe, Reference Sharpe1976), or funding to the greatest extent and investing fully in safe liability-matching assets to capture the preferential treatment of pension plans under current tax law (Black, Reference Black1980; Tepper, Reference Tepper1981). Harrison and Sharpe (Reference Harrison, Sharpe, Bodie and Shoven1983) also obtain corner solutions in pension funding and investment strategies while simultaneously taking into account the tax and insurance effects, depending on whether the insurance or the tax effect dominates. One exception is Bicksler and Chen (Reference Bicksler and Chen1985), who show that interior solutions could exist in the presence of frictions such as pension termination costs and progressive and asymmetric corporate income tax structure. Finally, our paper is related to the literature on the rational valuation of liability streams. Sundaresan and Zapatero (Reference Sundaresan and Zapatero1997) also provide a valuation formula for liability obligations, but without taking into account default risk. Lucas and Zeldes (Reference Lucas and Zeldes2006) focus on the pricing of market risks in liabilities (in particular, the pricing of uncertainty in earning growth), while we also price the credit risk component, which turns out to be sizable. The paper by Inkmann et al. (Reference Inkmann, Blake and Shi2017) is closely related to ours in that it also introduces an ‘integrated asset-liability management’ framework where pension liabilities are part of corporate liabilities, the sponsor's assets and pension assets are modeled separately and the fair value of liabilities depends on both. It also calculates an endogenous discount rate that reflects the funding ability of the pension plan and its sponsoring company, and therefore implicitly depends on the chosen asset allocation. But the pension plan is less integrated with the sponsor in our framework than in theirs because we allow for the possibility that pension surpluses are shared between equity holders and pensioners, as opposed to being returned in full to the sponsor. Another difference is that we explicitly model the default of the sponsor, as Merton (Reference Merton1974), and we take into account the bankruptcy costs that are associated with default. Overall, we recover many insights presented by Inkmann et al. (Reference Inkmann, Blake and Shi2017) in a simpler framework, thus emphasizing the robustness of these insights. The most substantial marginal contribution of our paper with respect to theirs is perhaps to show that surplus sharing rules can be used to mitigate the conflicts of interest between pension plan members and shareholders.
Our paper thus contributes to the literature on pension economics by valuing pension liabilities as defaultable claims issued by the sponsor company to workers and pensioners. Our results also have several micro implications, for the managers of firms and pension funds, and macro implications, for pension fund regulators. On the macro side, we find that the fair liability value is a decreasing function of the sponsor's leverage ratio, so that discount rates for liabilities should take into account the whole firm's financial situation. Regulatory valuation based on a uniform discount rate for all firms may underestimate or overestimate the fair value depending on the sponsor's financial health. On the micro side, we find that equity value depends on the funding status of the pension plan, thereby providing a potential explanation to the empirical findings showing that this status is reflected in equity prices (Franzoni and Marin, Reference Franzoni and Marin2006; Jin et al., Reference Jin, Merton and Bodie2006; Picconi, Reference Picconi2006) and credit spreads (Martin and Henderson, Reference Martin and G.V.1983; Carroll and Niehaus, Reference Carroll and Niehaus1998). We also find that a greater funding level has a positive impact on the firm's credit ratings. Regarding the effect of investment decisions in the pension fund, we find that a more aggressive investment policy has a positive effect on equity value but a negative one on pension claim value, at least if pension surpluses go to equity holders and the returns on pension assets are positively correlated with the firm's operating value: this is an example of asset substitution in the sense of Jensen and Meckling (Reference Jensen and Meckling1976). An optimal level of risk taking from pensioners' perspective may exist, on the other hand, if the correlation is negative.Footnote 1 In general, shareholders and pensioners can disagree on the optimal degree of risk taking by the pension fund, since a more risky investment strategy raises the likelihood of a partial recovery of pension claims, while it allows shareholders to reduce the burden on contributions needed to meet expected pension payments.
In the rest of the paper, we first present our integrated asset-liability management model, and we then present the results of comparative static analysis conducted with respect to capital structure, investment policy and pension funding decisions. The last section of the paper concludes.
1. The model
Our model extends Merton (Reference Merton1974) by introducing the assets and liabilities of a defined-benefit pension fund. Assets are a new state variable, which adds to the firm's asset value in Merton's model, and liabilities can be regarded as a form of debt partially secured by the assets of the pension fund and its sponsor.
1.1 State variables
Uncertainty in the economy is represented by a standard probability space $( {\Omega , \;{\cal A}, \;{\rm {\opf Q}}} )$ , where ${\cal A}$
 is a sigma-algebra on Ω and ℚ is a probability measure on $( {\Omega , \;{\cal A}} )$
 . ℚ is interpreted as the pricing measure, or risk-neutral measure, which means that the market price of a replicable payoff is equal to the expected discounted value of this payoff. The interest rate r is assumed to be constant. Following Merton (Reference Merton1974), we assume that all payments made by the firm or the pension fund occur at a future date T.
At the initial date (date 0), the initial owners of the firm divide an initial capital x among the industrial projects of the firm and the financial assets of the pension fund. The amounts of money respectively allocated to these projects are denoted with V 0 and A 0. We assume that any contribution made to the pension fund is tax-deductible, which means that the real cost for the sponsor of a contribution A 0 is (1 − θ) A 0, where θ denotes the corporate tax rate.Footnote 2 We will thus impose the budget constraint

The operating assets of the firm have an after-tax unlevered value denoted with V, which follows a Geometric Brownian motion:

where z V is a standard Wiener process. This firm issues fixed-rate debt with face value D and maturity T.
The defined-benefit pension fund is committed to make a fixed payment L at date T to pensioners. Its initial assets A 0 are invested in a risky asset S, which can be thought of as some policy portfolio, and in the cash account B. A fixed-mix allocation to these assets is maintained, with the weight ω in the risky asset. Under the risk-neutral probability measure, S and B evolve as:

where z S is another Wiener process, with a correlation coefficient ρ with z V.
Because the interest rate is constant, the cash account plays the role of a perfect liability-hedging portfolio, so the fixed-mix strategy can be regarded as a liability-driven investing strategy that combines a performance-seeking portfolio and a liability-hedging portfolio. A straightforward application of Ito's lemma shows that the terminal value of pension assets is

The choice of a fixed-mix policy is done for parsimony, in order to have a single parameter describing the riskiness of the strategy, but the model can accommodate arbitrary investment policies.
1.2 Payoffs to stakeholders
The economic agents that we consider in this paper are those who hold claims written on the assets of the firm and possibly on those of the pension fund:
• the beneficiaries of the pension plan (collection of workers and retirees of the sponsor firm),Footnote 3
• the equity holders (or shareholders) of the sponsor company,
• the holders of bonds issued by the sponsor company.
Following Merton (Reference Merton1974), we assume that default can only be triggered at time T. A pension contract is a collateralized form of debt held by the pensioners of the firm, where the pension fund assets serve as a collateral. In case the pension fund is insolvent (A T < L), the sponsor is called to make a contribution L − A T, which is only paid if the sponsor can absorb it, that is if the operating assets V T are sufficient to cover the deficit: in this case, pensioners receive L as promised; otherwise default is triggered.Footnote 4 In the opposite case, where the pension fund enjoys a surplus (A T > L), this surplus is shared between equity holders and pensioners, with the former receiving a fraction γ of the after-tax surplus.Footnote 5 That said, surplus sharing rules in various countries are very complex, and negative contributions rarely take place in practice, so that the usual answer to a situation of overfunding of a pension plan is a ‘contribution holiday’ for the sponsor. For these reasons, we have taken 1 as the base-case value for γ, but we also discuss the implications of taking γ equal to 0, that is of keeping all surpluses within the fund.
Equity holders are responsible for paying back debt, and they receive the aggregate asset of the firm and pension fund A T + V T, net of the payments to pensioners and bondholders if the firm does not default at time T. If the firm defaults, they receive nothing. They are also entitled to the total tax savings at time T, equal to the sum of tax saving on interest payments and tax saving on contribution from the sponsor. Formally, these tax savings are respectively expressed as θ(D − D p) and θ(L − A T)+, where D p = De −rT is the present value at time 0 of the promised repayment to bondholders.
We now summarize the payoffs to each group of claim holders at time T, in the various states of the world. For notational concision, we let

denote the pension surplus.
(I) If A T + V T ≥ L + D, equity holders receive a positive payoff if debt is redeemed in full.
(1) If A T ≥ L and V T ≥ D, the firm pays D to debtholders, and pensioners receive L + (1 − γ)C T, that is the promised payoff L plus a fraction 1 − γ of pension fund surplus. Equity holders receive the remaining assets of the firm plus the remaining part of the surplus and the tax shield. The payoff to them is thus V T − D + γC T + θ(D − D p);
(2) If A T ≥ L and V T < D, pensioners still receive L + (1 − γ)C T. Default can be avoided if V T + γC T ≥ D, in which case bondholders receive D and equity holders get V T − D + γC T + θ(D − D p). Otherwise, bankruptcy is triggered, entailing a loss αV T to third parties under the form of bankruptcy costs. Bondholders receive the proceeds of the liquidation, (1 − α)V T, plus the fraction γ of the surplus, and equity holders receive nothing;
(3) If A T < L and V T ≥ D, the sponsor company makes a final additional contribution L − A T to the pension plan so that pensioners can receive the promised payment L. Bondholders also receive the promised payment D and equity holders receive the remaining asset of the firm plus the tax shield, A T + V T − L − D + θ(D − D p) + θ(L − A T).
(II) If A T + V T < L + D, equity holders receive nothing.
(1) When A T < L and V T < D, both the firm and the pension fund default on their obligations. Pensioners receive the totality of the pension assets (due to the collateralized nature of pension obligations) plus some fraction q of the proceeds (1 − α)V T of the liquidation of the firm's assets, after bankruptcy costs. Assuming equal seniority between bondholders and pensioners, q must be equal to ${{L-A_T} \over {D + L-A_T}}$
 .Footnote 6 In other words, both pensioners and debtholders receive an amount proportional to the remaining amount which is due to them before liquidation (L − A T for pensioners, and D for bondholders). Pensioners thus receive A T + q(1 − α)V T, and bondholders are paid (1 − q)(1 − α)V T.
(2) If A T ≥ L and V T < D, pensioners receive L + (1 − γ)C T. The amount available for debt payment is V T + γC T, which is strictly less than D. Hence default is triggered: bondholders get (1 − α)V T + γC T, and equity holders receive nothing.
(3) If A T < L and V T ≥ D, the firm defaults, so bondholders receive (1 − q)(1 − α)V T and pensioners receive A T + q(1 − α)V T.Footnote 7

These payoffs can be formally written using the indicator function of a subset of Ω, denoted as ${\tf="Bbold10" 1}$ :


The payoffs to equity holders and bondholders in the model of Merton (Reference Merton1974) are recovered when the pension fund is removed from the analysis, that is when both A 0 and L are set to zero.
1.3 Prices of the claims
The fair values at time 0 of the pension fund liabilities and of corporate bonds are:


They can be interpreted as the cost of issuing these claims for the corporation. It is important to emphasize that the private valuation of these claims for pensioners is in general lower than the issuance cost borne by the firm, and this for at least two related reasons. First, the pension claims are not tradable, so their private value should include a discount rate reflecting their illiquidity. Second, employees of the firm are under-diversified with respect to the sponsor company risk, to which their human capital already shows a strong exposure. The non-tradable nature of the claim prevents employees from hedging away this risk.Footnote 8 In the absence of information regarding preferences, endowments, trading and consumption strategies for employees, we may only recognize that L 0, the cost of issuing these claims for the pension fund, provides an upper bound for their private value for pensioners. However, our model is cast in a complete market setting, so that any exposure to pension liability claims could in principle be hedged away through a suitably designed dynamic replication strategy involving two risky assets which are the stock index and the sponsor company stock, in addition to the risk-free asset. In such a complete market situation, the value and the cost of the pension claims are identical.
The actual payment L T to pensioners can be decomposed as $L_T^1 + L_T^2$ , where $L_T^1$
 is the access to the promised payment and the recovery payment, that is the sum of the first two terms in (2), and $L_T^2$
 is the access to pension fund's surpluses, that is the last term in (2). Denoting with $L_0^1$
 the present value of $L_T^1$
 , we can define a credit spread s L as the amount to be added to the risk-free rate to recover the fair value of liabilities when discounting the promised benefits:

$L_0^1$ equals Le −rT if pensioners always receive the promised payment, and more generally, the difference between $L_0^1$
 and the present value of L indicates whether they are likely or not to receive the contractual payment. By construction, the spread s L is nonnegative. It is to be compared with the spread s reg which is given by the regulator and used to compute the regulatory liability value as $L^{{\rm reg}} = e^{-( {r + s_{{\rm reg}}} ) T}L$
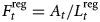
 , and the regulatory funding ratio as $F_t^{{\rm reg}} = A_t{\rm /}L_t^{{\rm reg}}$
 . Consistent with the prescription of the US regulation, we interpret s reg as the spread between Treasury and AA-bonds. We can define the credit spread for corporate bonds in the same way, through

The price of equities at date 0 is given by

The total value of the firm and pension fund is the sum of the market values of the claims, L 0, E 0 and D 0. We can rewrite it in a different way, using the notions of tax shield and bankruptcy costs (see Leland (Reference Leland1994) for similar expressions when there is no pension fund):

The present values of these quantities are denoted with BC 0 and TS 0. It is straightforward to verify that we have, in any state of the world:
L T + E T + D T = V T + A T + TS T − BC T.
Multiplying each side by the discount factor e −rT and taking risk-neutral expectations, we obtain two equivalent expressions of the total value:

In case the firm is not subject to taxation (θ = 0) and there are no liquidation costs (α = 0), the total value is just x, and is thus independent from capital structure, pension funding and portfolio allocation decisions.
2. Impact of decisions made by the firm and pension fund
In this section, we study the impact of the choices regarding the firm's capital structure, the funding level and the investment strategy for the pension fund. The first two decisions are made by the initial owners of the firm, while the third is the responsibility of the fund's investment team. To do this, we numerically compute the prices of the claims for different combinations of parameter values.
We define a set of base-case parameter values as follows. The short-term interest rate is r = 4%, the corporate tax rate is θ = 35% and the regulatory spread is s reg = 100 basis points. In the event of a liquidation following bankruptcy, the firm owners have to give up a fraction α = 50% of the proceeds. x, the total capital to be split across the sponsor and the pension fund, is only a scaling variable that multiplies all claim values, so its value is irrelevant and it can be set to 100 without loss of generality. The face value of debt and the promised payment to pensioners, D and L, are both set to 50, but we will let L vary in the comparative static analysis below. In the base case, the pension fund is fully funded in the regulatory sense, so the initial asset value is $A_0 = Le^{-( {r + s_{reg}} ) } = 30.33$ . Consequently, the amount invested in the firm is V 0 = x − (1 − θ)A 0 = 80.29. The volatilities of the firm's value process and the risky asset in the pension fund's portfolio are σ V = 20% and σ S = 30% and their base-case correlation is ρ = 50%. The horizon is T = 10 years. The base-case allocation to equities and cash in the pension fund is 50%–50%.
The payoffs L T, E T and D T have complex option-like forms with barriers, so there is no analytical expression for their prices. We estimate these prices through Monte-Carlo simulations, by generating 100,000 scenarios for the pension fund's assets and the firm unlevered value and averaging the corresponding outcomes for the payoffs.
2.1 Leverage decisions
We first analyze the impact of leverage decisions on the total value of the firm and the fair liability value, for different values of the promised payment L. Since the initial endowment to the pension fund cannot exceed x, the following condition must be satisfied:

Given our base-case parameters, the upper bound is equal to 253.6.
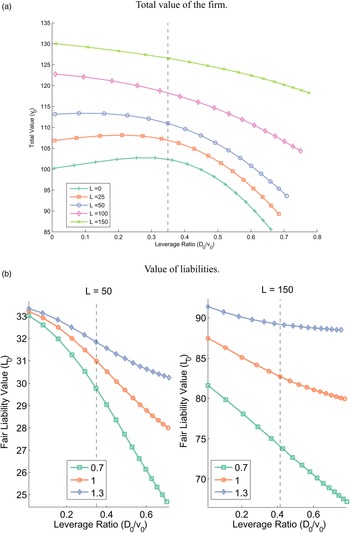
The leverage ratio is defined as the market value of corporate debt over the sum of bond and equity values, and it characterizes the capital structure. In the presence of frictions (taxes and bankruptcy costs), the trade-off theory of the capital structure suggests that an optimal leverage decision can be achieved so as to maximize total firm value. Intuitively, one expects that a firm without a pension fund will optimally take on more debt than an otherwise identical firm sponsoring a pension plan, since the latter firm has already issued a form of debt by committing to a payment to retired employees. Panel (a) of Figure 1 shows the total value of the firm and the pension fund as a function of the leverage ratio D 0/v 0, by letting the face value of debt vary. It confirms that the value-maximizing leverage ratio is a decreasing function of the promised payment to pensioners. Hence, to the extent that L can be anticipated by the sponsor at the time it chooses its level of debt, the presence of the pension fund should have an impact on the leverage decision.Footnote 9
Impact of leverage decisions. (a) Total value of the firm. (b) Value of liabilities. In Panel (a), the total value is plotted against the leverage ratio for different values of the promised payment to pensioners, L, while keeping the initial endowment to the pension fund equal to the regulatory liability value. In Panel (b), the fair value of liabilities is plotted against the leverage ratio, and the initial asset value of the pension fund is set to 70%, 100% or 130% of the regulatory liability value. The vertical dashed lines identify the leverage ratio in the base case, where L = 50.
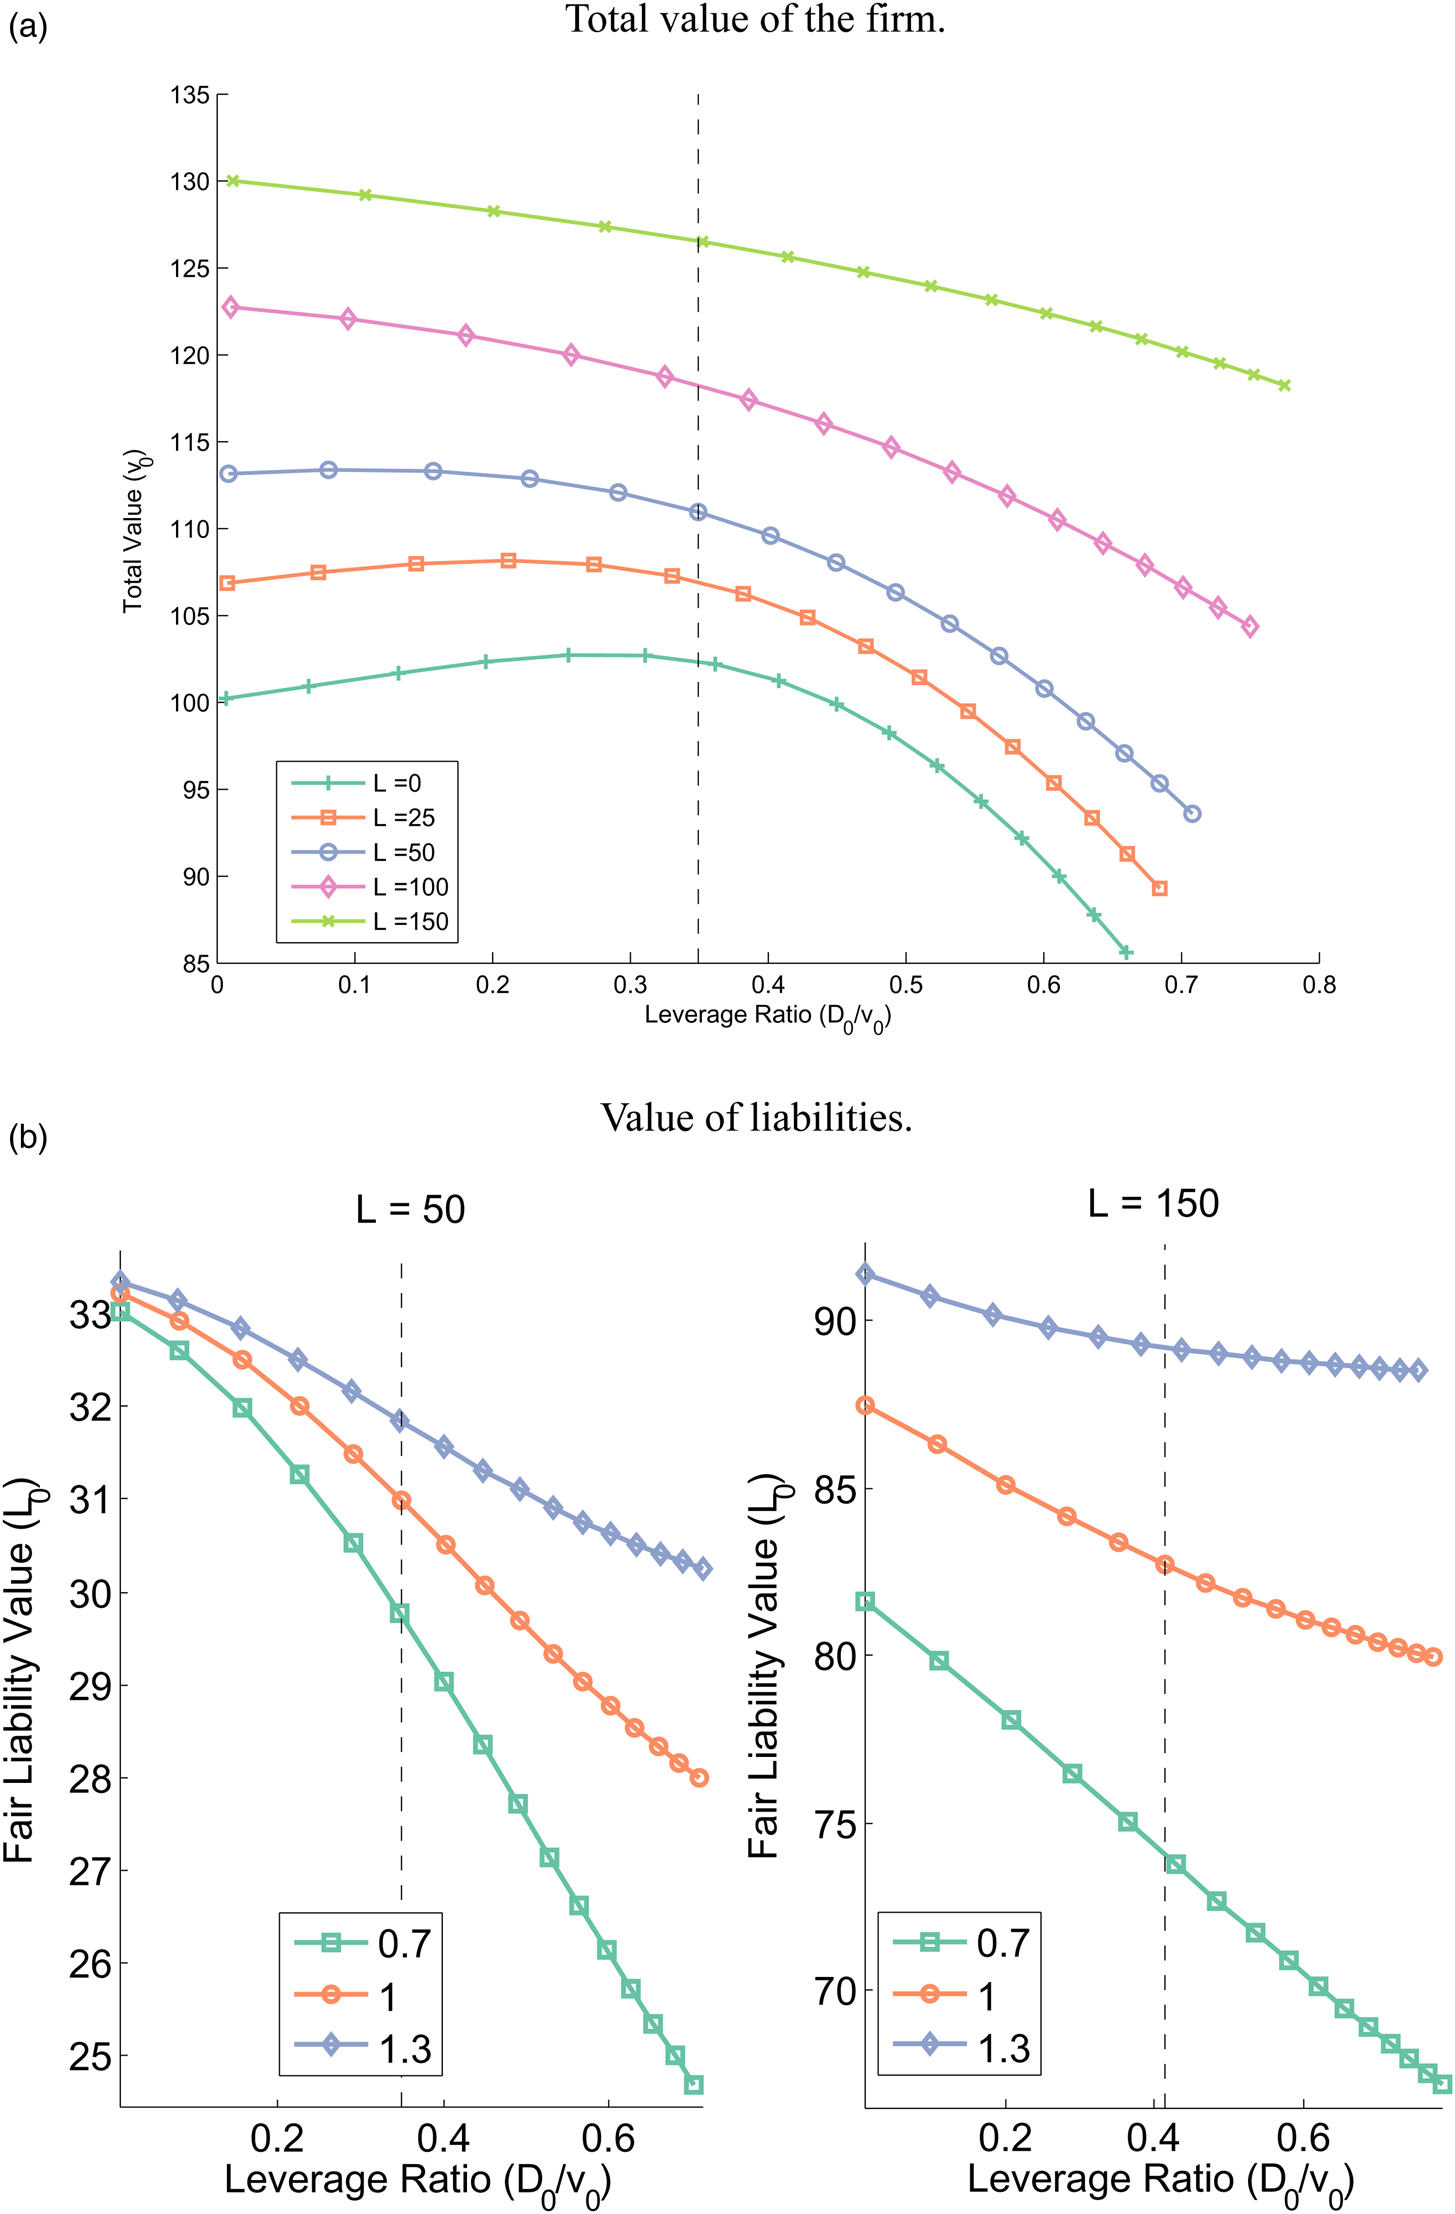
In the absence of the pension fund, i.e., for L = 0, the optimal leverage ratio is 36.2%, a value that is of the same order of magnitude as those obtained in dynamic capital structure models: for example, Leland (Reference Leland1994, Reference Leland1998) or Ju and Ou-Yang (Reference Ju and Ou-Yang2006) find leverage ratios ranging from 30% to 50% depending on parameter values. The collateralized nature of the pension obligations and the existence of potentially complex surplus sharing rules imply, however, that debt held by pensioners and debt held by bondholders are not perfect substitutes one for another. The main insight that we obtain from Panel (a) of Figure 1 is that the existence of a pension plan should have an effect on capital structure decisions.
Panel (b) of Figure 1 takes the reciprocal perspective and plots the fair liability value L 0, as a function of the leverage ratio. The calculation is done for two values of L (50 and 150) and three values of the initial funding ratio (70%, 100% and 130%), so as to capture situations where the sponsor fully funds its pension plan and situations where it leaves it with a deficit. The initial funding ratio is computed in the regulatory sense: for a given target $F_0^{{\rm reg}}$ , the initial endowment is set to $A_0 = F_0^{{\rm reg}} L_0^{{\rm reg}}$
 . Because of the tax savings, the actual cost for the sponsor is (1 − θ)A 0 and the remaining capital V 0, implied by equation (1), is assigned to industrial projects. Panel (b) of Figure 1 shows that other things being equal, pensioners will prefer a sponsor firm with a small amount of outstanding debt to a heavily indebted one, since a more financially constrained firm is less likely to be able to afford making additional contributions if needed. The impact of the leverage ratio is far from negligible: for an initially fully funded pension plan in the base case, increasing the leverage ratio from 15% to 45% leads to a decrease in liability value from about 32 to 29. In line with the intuition, we find that for a given level of funding, liability value is lower if promised payments to pensioners represent a large fraction of firm's total commitments (L = 150 versus D = 50) than if they are of the same order of magnitude as debt (L = D = 50). One important finding is that the regulatory liability value, which is 30.33 when L = 50, overestimates the fair value of liabilities for highly leveraged firms, while it underestimates it for firms with little debt outstanding. For firms with large commitments to pensioners (L = 150) and a pension plan with an initial funding ratio of 70% or 100% only, liabilities are found to be undervalued, whatever the capital structure of the sponsor company. While these effects are straightforward from a qualitative standpoint, one of the contributions of the model is to show that the over/under-estimation can be quantitatively large for reasonable parameter values. From an accounting regulation perspective, this result makes a case for the use of an endogenous rate to discount liabilities, as opposed to a uniform rate for all firms.
2.2 Allocation decisions
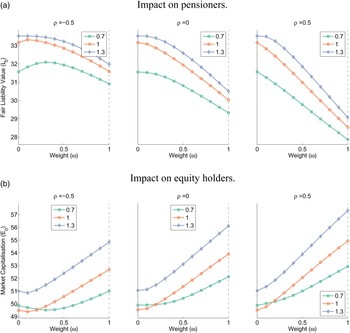
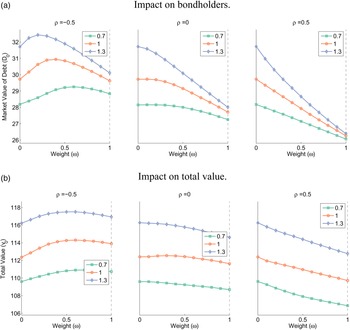
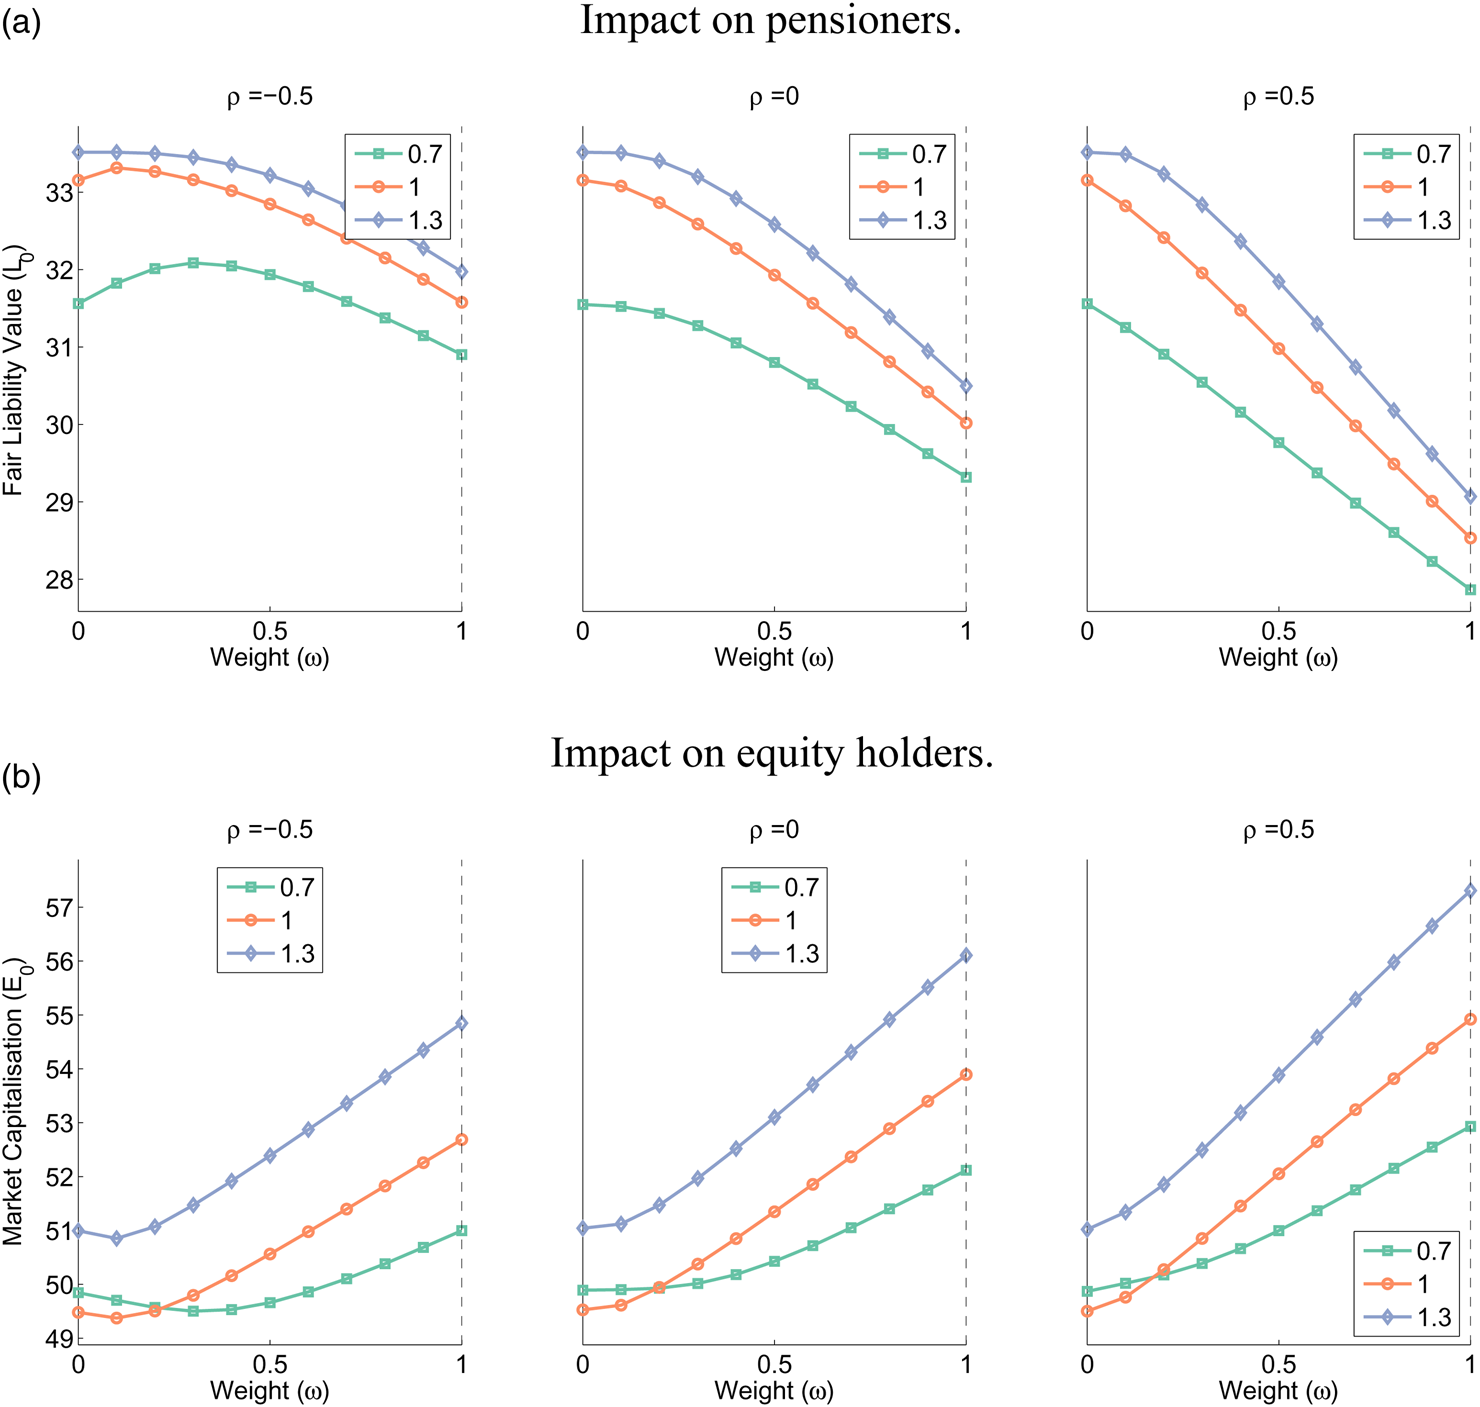
We now turn to the impact of pension fund allocation decisions on the values of the various claims. Figures 2 and 3 display the market values of claims held by pensioners, bondholders and equity holders as functions of the allocation ω to stocks, for different values of the regulatory funding ratio, and three values of the correlation between the firm value V the risky asset S (ρ = −0.5, 0 or 0.5). To save space, we have focused on the case where equity holders have access to surpluses, which corresponds to γ = 1. Figures for the case where pensioners are entitled to surpluses (γ = 0) are available in the online Appendix.
Impact of allocation decisions on pensioners and equity holders. (a) Impact on pensioners. (b) Impact on equity holders. These figures perform comparative static analysis with respect to the allocation to the risky asset, ω, for various levels of the regulatory funding ratio (70%, 100% and 130%) and the correlation ρ between the firm's unlevered value and the risky portfolio held by the pension fund. All other parameters are fixed at their base-case values. The vertical dashed line identifies the base case value of ω.
Impact of allocation decisions on bondholders and total value. (a) Impact on bondholders. (b) Impact on total value. These figures perform comparative static analysis with respect to the allocation to the risky asset, ω, for various levels of the initial funding ratio (70%, 100% and 130%) and the correlation ρ between the firm's unlevered value and the risky portfolio held by the pension fund. Unless otherwise indicated, parameters are fixed at their base-case values. The vertical dashed line identifies the base-case value of ω.
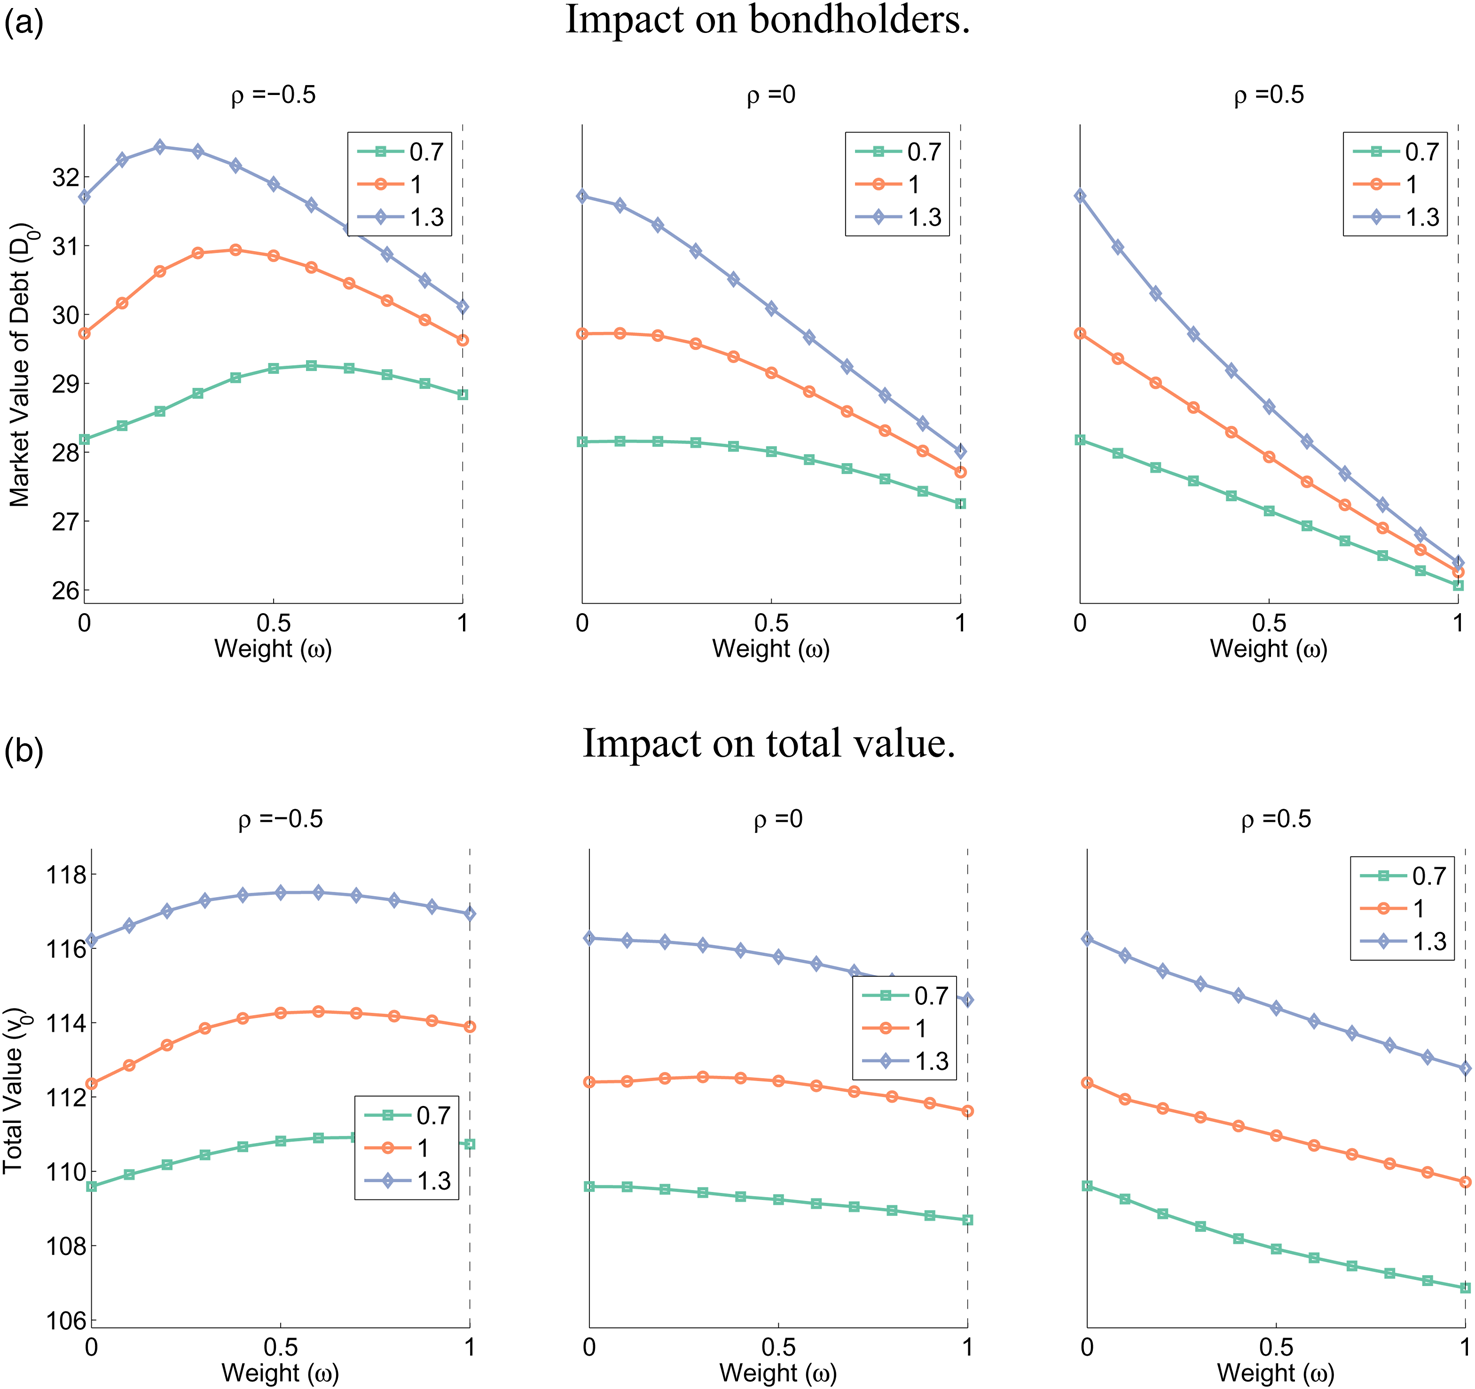
Figure 2 shows that the fair value of payment to pensioners, L 0, is in general a decreasing function of ω. An explanation is as follows. The actual payoff to pensioners if they have no access to surpluses can be approximated as the minimum of A T + V T and L, and is equal to it if V 0 = 0. More generally, the option that pays min (L, A T + V T) involves a short position in a call written on A + V with strike price L. Because the call has positive vega, L 0 is thus decreasing in the volatility of A + V. For a positive or zero correlation between S and V, increasing ω only leads to a higher volatility of A + V, hence to a lower L 0. But for a negative correlation, there may exist a value of ω between 0 and 1 that minimizes this volatility, hence maximizes L 0. This maximum value only exists if the pension fund is not too highly funded at date 0, because if the funding ratio is sufficiently high and the pension fund only invests in the safe asset, the promised payment is made in all scenarios. In this case, nothing is gained for pensioners if the pension fund takes a more risky strategy.
When equity holders are entitled to the full surplus of the pension fund, the actual payoff of equities can be approximated as (A T + V T − L − D)+, an approximation that is exact if θ = 0. This is the payoff of a call written on A + V with strike price L + D. Hence, equity value is increasing in the volatility of A + V, which accounts for the increasing pattern observed on most curves of Panel (a) in Figure 3. But as argued previously, this volatility reaches a minimum for an interior value of ω when the correlation between S and V is negative. So, equity value is minimal for this particular value of ω. As a matter of fact, we observe that E 0 is minimum for some non-trivial value of ω when ρ is negative, but this minimum is only visible if the initial funding ratio is not too high, here <130%. As evidenced by Figures 2 and 3, this increase in shareholder value as a function of increasing volatility of the pension fund assets comes at the cost of related decreases in pensioners' and bondholders' wealth, which is a clear case of asset substitution (see Jensen and Meckling, Reference Jensen and Meckling1976). It is shown in the online Appendix that when equity holders have no access to surpluses (γ = 0), increasing the riskiness of the pension fund allocation strategy leads to a decrease in equity value, especially for high funding ratios.
In unreported results, we have also analyzed the impact of allocation decisions on the fair values of pension liabilities and equities in the presence of conditional inflation indexation. This form of pension compensation is encountered in the Netherlands, where pensioners are entitled to receiving inflation-linked payments if and only if the funding ratio reaches a sufficiently high level. These results show that the allocation to the stock index that maximizes the value of the claim is strictly greater with than without conditional inflation indexation, and is therefore closer to the 100% allocation that maximizes equity value. Hence, introducing conditional indexation enables to reduce the conflicts of interests between pensioners and equity holders as to the riskiness of the investment policy taken by the pension fund. This effect is formally similar to the effect of granting partial access to pension fund surpluses by the means of a lower coefficient γ.
A comparison between Figures 2 and 3 shows obvious similarities between the fair value of the promised payment to bondholders and the fair value of pension payments, with a key difference again related to the collateralized nature of pension liabilities. That pension assets serve as a collateral for pension liabilities explains why the fair value of pension claims is greater than that of corporate bonds when promised payments are the same (L = D = 50). When the funding level decreases, on the other hand, the diversification benefits start to become effective, provided the correlation ρ is negative, so the volatility of A + V reaches a minimum for a value of ω lying strictly between 0 and 1. This results in a maximum for D 0.
It appears that in general, the total firm value v 0 is maximized for a zero investment in the risky asset, except when the correlation ρ is negative: in this case, an interior optimal weight may exist. For an initial funding level of 70% or 100%, the optimal weight is close to 50%, and it grows to 70% for a funding of 150%.
2.3 Funding decisions
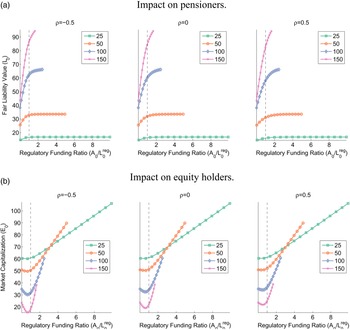
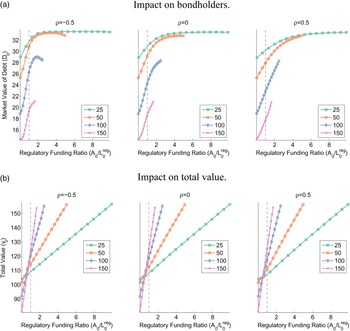
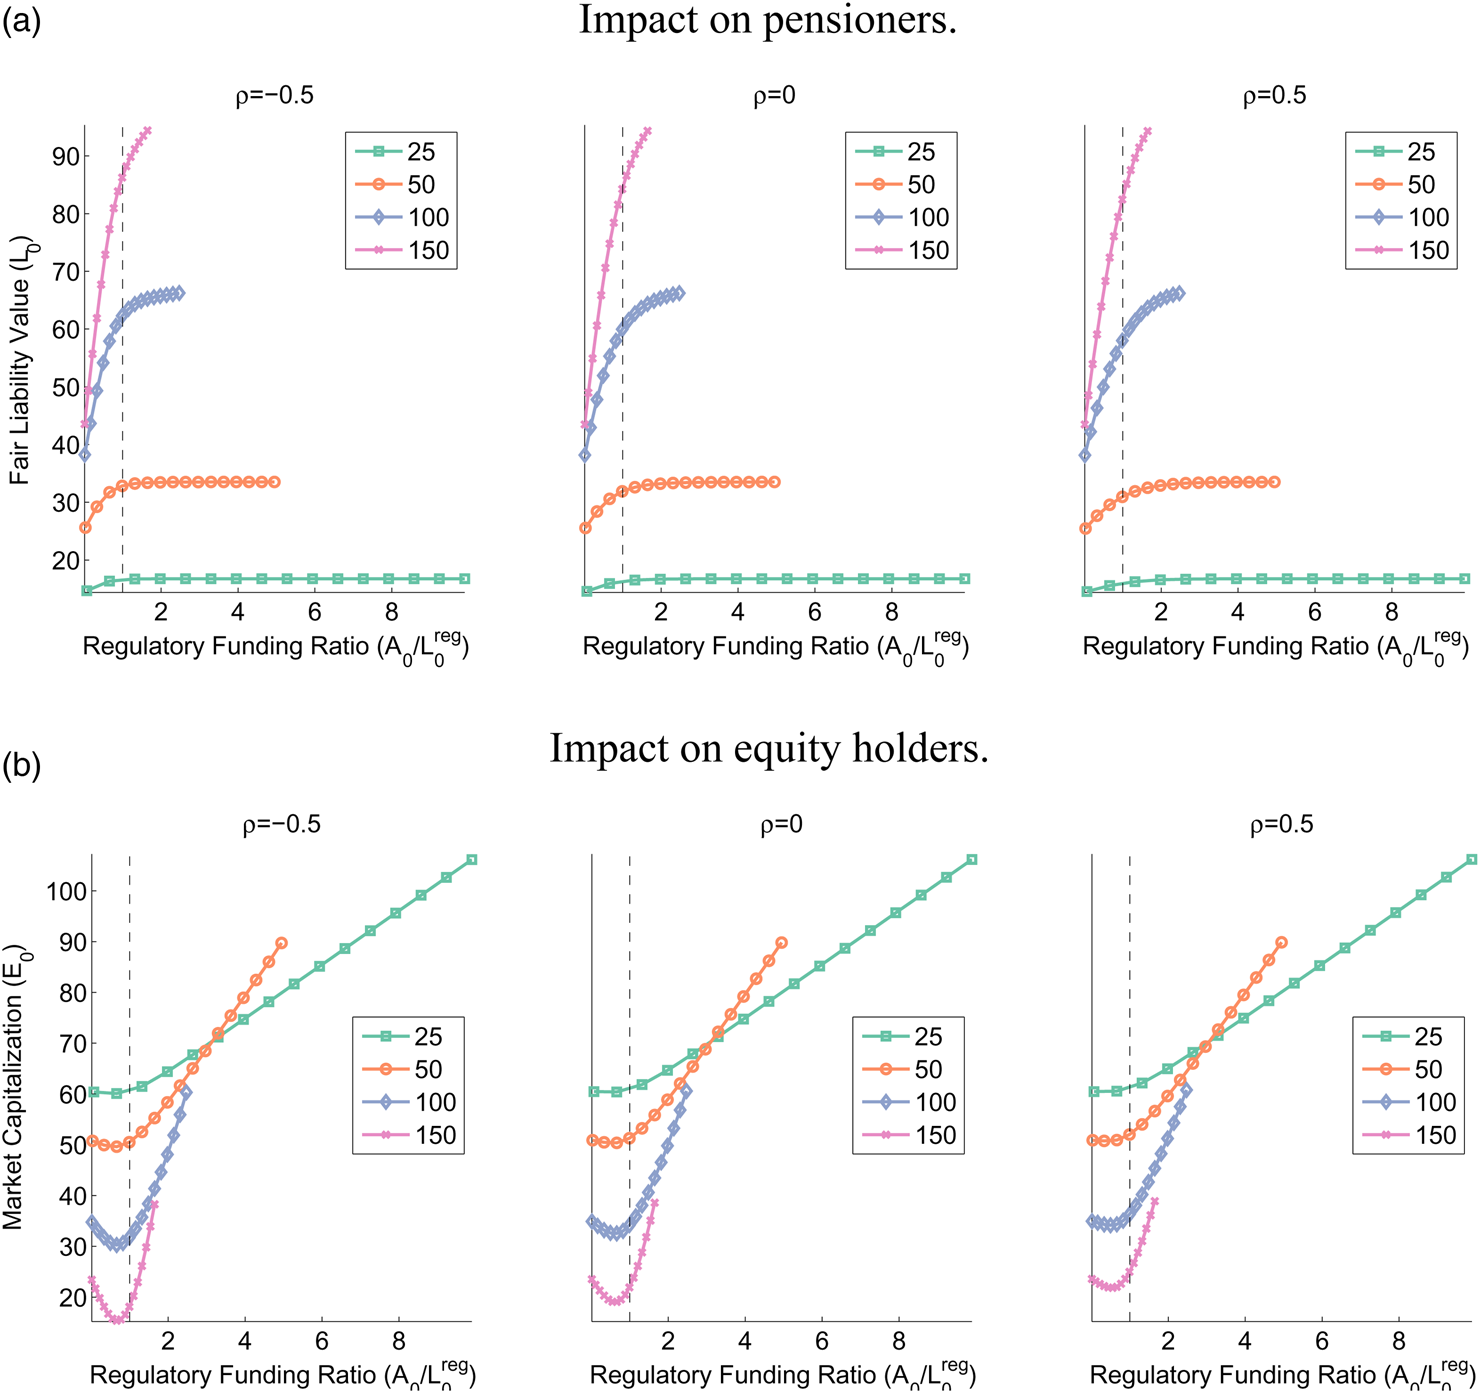
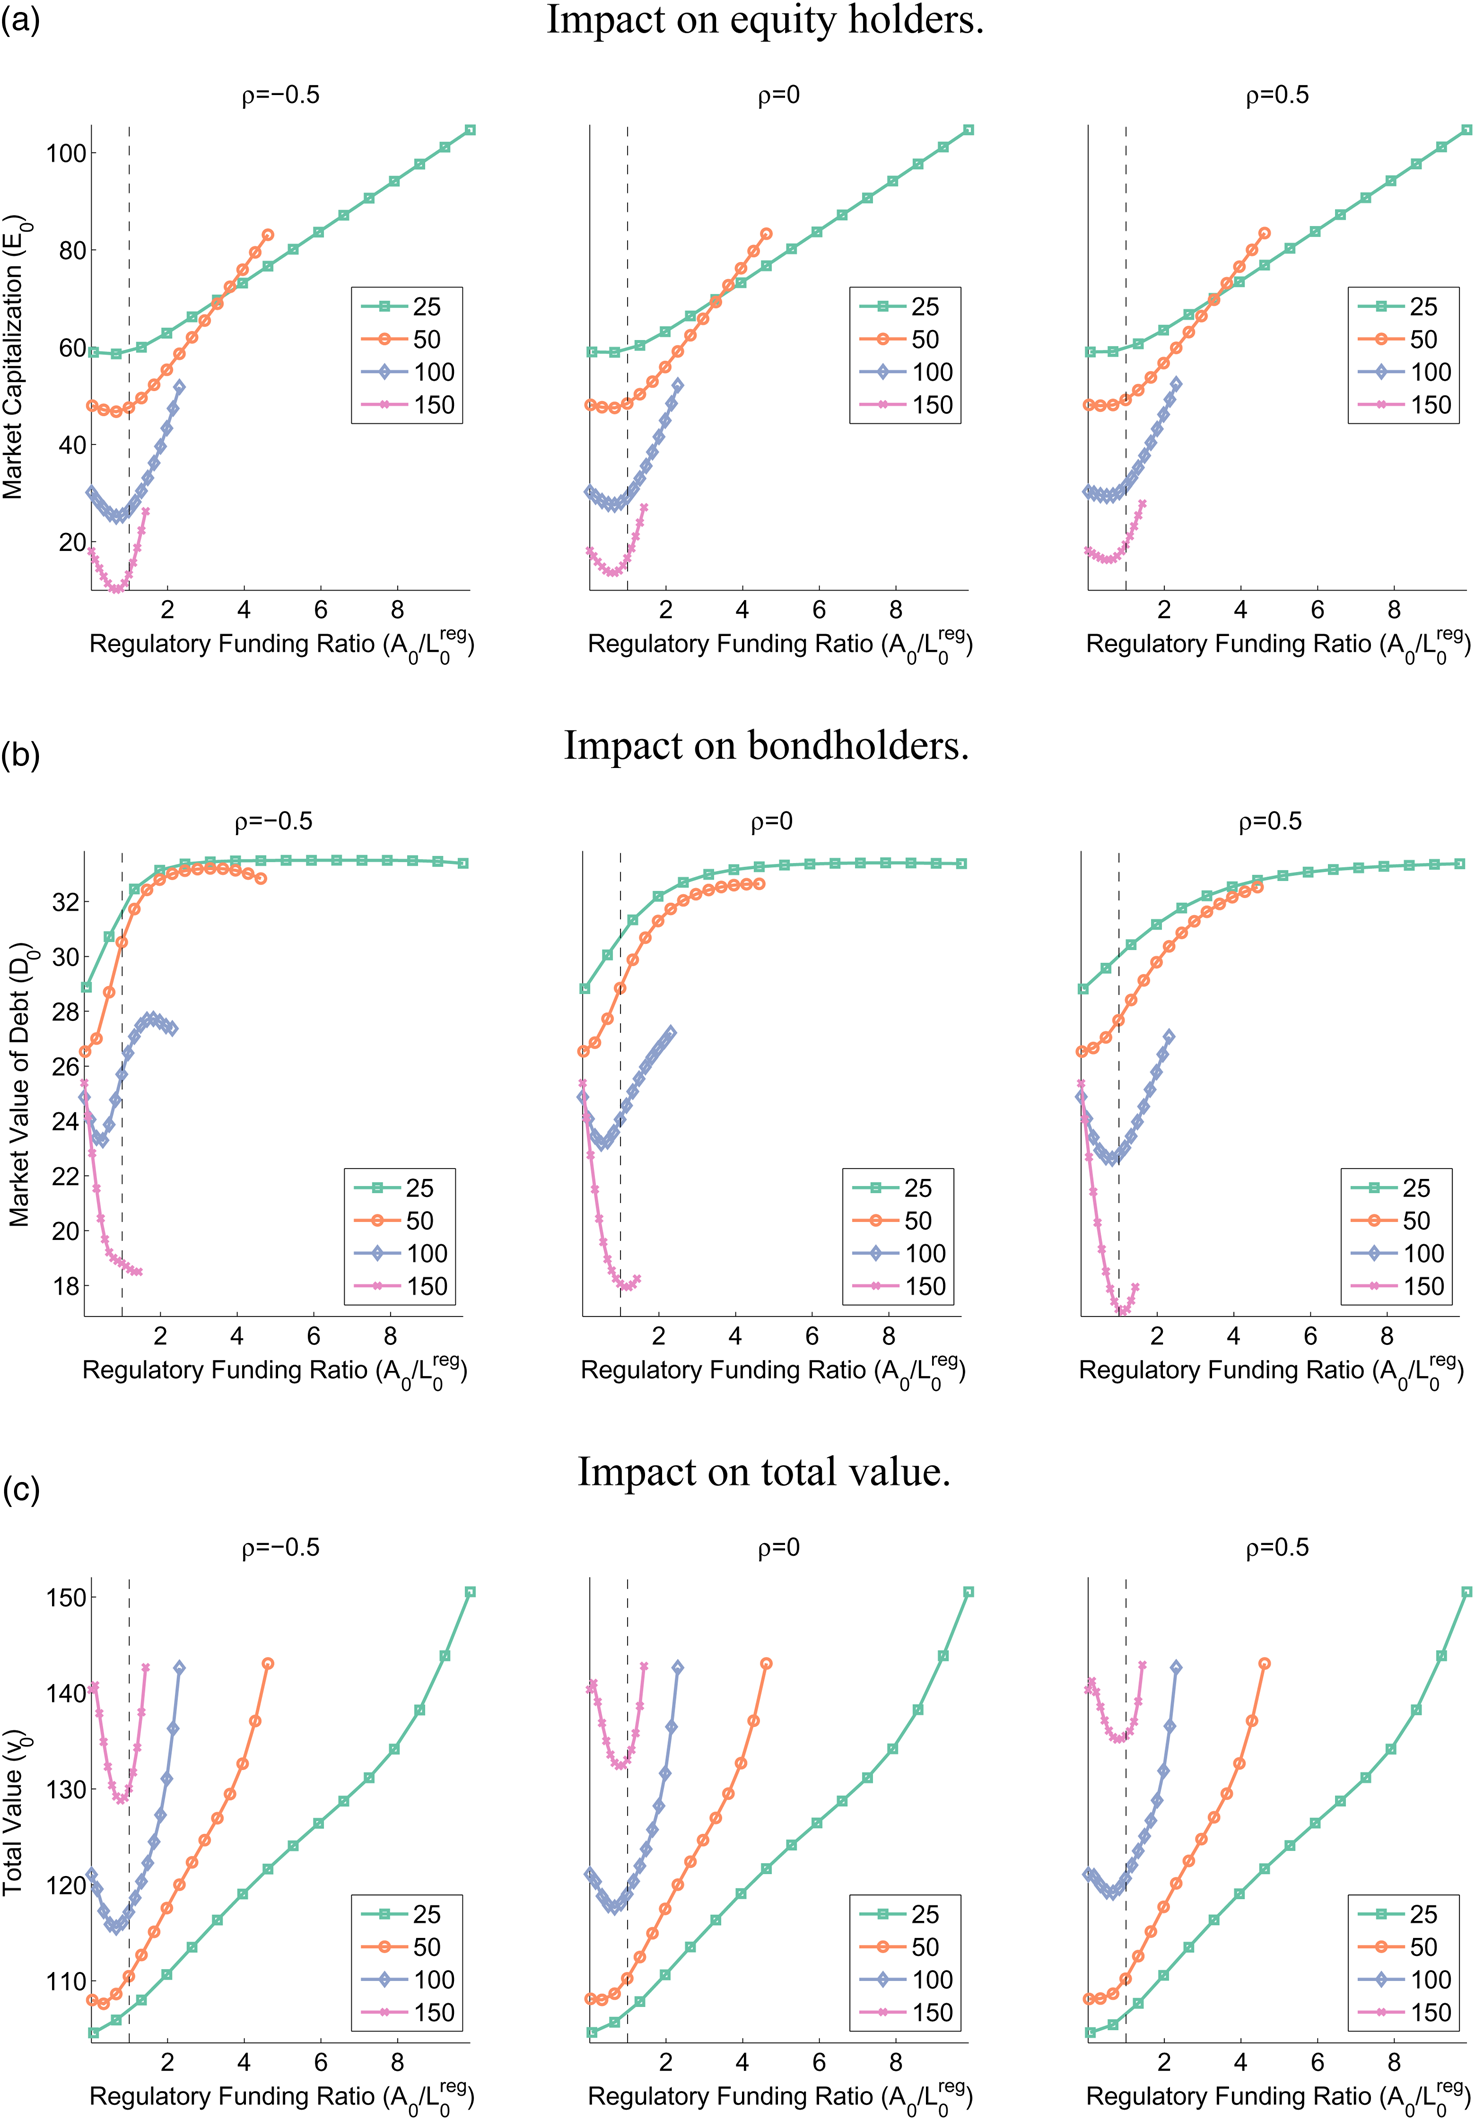
Funding decisions are made by the initial owners of the firm at time 0, who decide how to allocate the initial capital x to the firm (V 0) and the pension fund (A 0). Figures 4 and 5 show the impact on the various claim values of changes in the initial pension assets, A 0. Figure 4 confirms that pensioners always benefit from increases in funding to the pension plan because the pension fund is more likely to deliver the promised payment if it is well funded than if it receives a low initial endowment.
Impact of funding decisions on pensioners and equity holders. (a) Impact on pensioners. (b) Impact on equity holders. These figures plot the regulatory funding ratio of the pension fund against the fair liability value and equity value for different values of the promised payment to pensioners, L (25, 50, 100 and 150). The curves are parametrized by A 0, the initial capital made available to the pension fund. Unless otherwise indicated, other parameters are fixed at their base-case values. The vertical dashed line represents the regulatory funding ratio in the base case.
Impact of funding decisions on bondholders and total value. (a) Impact on bondholders. (b) Impact on total value. These figures plot the regulatory funding ratio of the pension fund against the bond value and the total firm value for different values of the promised payment to pensioners, L (25, 50, 100 and 150). The curves are parametrized by A 0, the initial capital made available to the pension fund. Unless otherwise indicated, other parameters are fixed at their base-case values. The vertical dashed line represents the regulatory funding ratio in the base case.
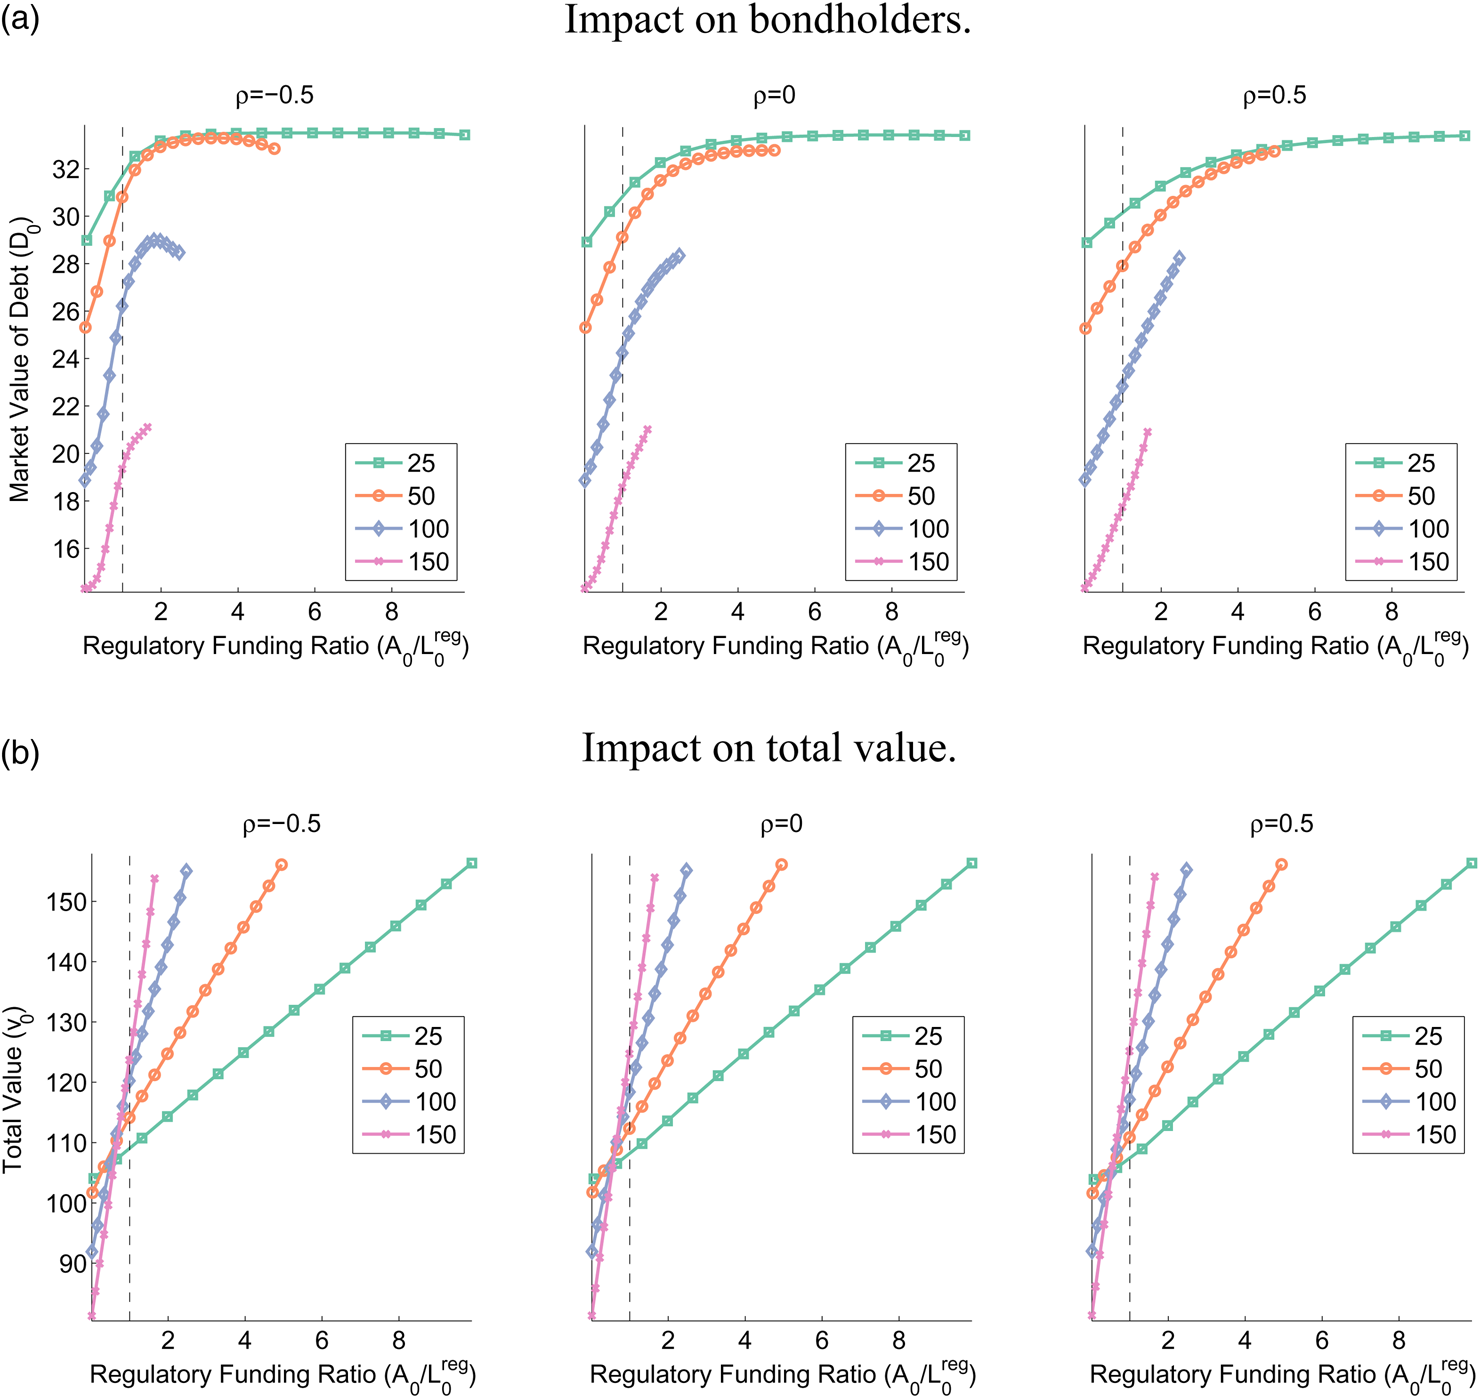
The impact on equity holders is ex ante also straightforward: increases in funding lead to increases in benefits from the tax advantage because the initial contribution is tax-deductible, and therefore lead to higher equity value. This intuition is confirmed in Panel (b) of Figure 4 in the case where the promised payment to pensioners is low: then, negative contributions from the pension fund to the sponsor are likely to take place, so that the money invested in the pension plan is not lost for equity holders, and they benefit from the tax deductibility of the initial contribution, without any negative counterpart. On the other hand, for larger promised benefits (L = 100 or more), an increase in funding starting from low levels can lower equity value: in such situations where it is highly unlikely that pension assets will ever be in excess of pension liabilities, one additional dollar invested in the pension fund is certain to be lost for shareholders, who would prefer having it invested in the firm. The results in the online Appendix show that when equity holders have no claim on pension surpluses, equity value is a decreasing function of the capital invested in the pension fund.
Increases in funding ratio have two competing effects on bond value. On the one hand, it is in bondholders' interest that the firm be able to redeem its debt without having to contribute to the pension plan: this calls for high initial funding ratios. On the other hand, such high ratios reduce the amount of capital invested in the firm and make it more likely that the firm cannot redeem debt in full. So, there is a tradeoff between making an initial contribution or a deferred contribution to the pension plan. When equity holders have access to surpluses, like in Figure 5, a lower initial contribution is likely to result in a larger future contribution, so it has no positive effect for bondholders, and bond value is increasing in the initial funding ratio.Footnote 10 In the online Appendix, we consider the case where surpluses go to pensioners, and the tradeoff clearly appears: exceedingly large funding ratios are regarded as undesirable by bondholders because the firm cannot take over large future surpluses.
Figure 5 suggests that a higher funding level unambiguously leads to higher total firm value. When equity holders have full access to surpluses, this comes as no surprise because making a large initial contribution enables to take more benefit from the tax regime, and exceedingly large surpluses can be returned to the firm so that it does not lead to increases in the likelihood of bankruptcy. When pensioners have access to surpluses (see the online Appendix), greater contributions still lead to greater tax shield benefits, but also to higher bankruptcy probability. However, we find that the total value in that case is still an increasing function of the funding level, which shows that the present value of the tax savings increases faster than bankruptcy costs.
3. Impact of pension guarantee
The costs of corporate default have so far been assumed to be borne by the pensioners, who may not get their promised payment if the pension fund is insolvent and the sponsor is unable to cover the deficit. We now introduce a pension benefit guarantee corporation (PBGC), which is intended to provide pension benefits for pensioners of companies that are in distress. In the US, the PBGC provides protection, but the protection is limited to a statutory maximum amount ($60,136 in 2016 for employees retiring at age 65). One could price this so-called pension put and obtain its rational value as a function of the pension funding status, the firm's capital structure, and the pension fund allocation policy (see Marcus, Reference Marcus, Bodie, Shoven and Wise1987; Hsieh et al., Reference Hsieh, Chen and Ferris1994; Boyce and Ippolito, Reference Boyce and Ippolito2002). If the PBGC charges sponsors a premium proportional to the actual credit riskiness of liabilities, the costs are transferred to shareholders. In practice, pension insurance is not fairly priced because the premium actually paid is independent of both capital structure and pension fund allocation, and it is in practice mostly underpriced for the most vulnerable companies, so motives for asset substitution (extracting value from the PBGC, i.e., from other, healthier, companies) remain intact (see Sharpe (Reference Sharpe1976) or more recently Bodie (Reference Bodie1996) for a discussion of the pension put, and also Bodie et al. (Reference Bodie, Light, Mørck and Taggart1985) for empirical evidence that the PBGC creates an incentive for distressed companies to underfund their pension plan and invest in risky assets).
3.1 Payoffs to claimholders
In the US, the actual provisions of the PBGC as defined by the ERISA are as follows. The sponsoring firms with defined-benefit plans must enroll in the pension benefit insurance program of the PBGC which insures pension benefits up to a fraction λ of the promised payment L. Under ERISA, the PBGC can preempt assets of the sponsor, to the limit of 30% of their value. This preemptive right is senior to all unsecured liabilities of the company except wages.
We now rewrite the payoffs to each group of claimholders in the presence of the PBGC. Where A T ≥ L or A T + V T ≥ L + D, there is no need for the PBGC to intervene, since the assets of the firm and the pension fund are sufficient to cover a deficit. Hence the payoffs to each group are identical to the payoffs in the absence of the PBGC (see item I. in the above payoff list). But if A T + V T < L + D and A T < L, the firm does not have enough assets to make up for the deficit of the plan, so liquidation takes place. Then, the PBGC can withdraw a fraction p of the assets net of bankruptcy costs, where:

Putting together pension fund assets and a fraction p of the firm's assets, the amount available to compensate pensioners is A T + p(1 − α)V T. Since this quantity is less than L, the PBGC must intervene to close the gap, up to a fraction λ of the face value of liabilities. Finally, pensioners and bondholders receive, respectively

We may therefore define the value of the pension put as P 0 = E ℚ[e −rTP T] where:Footnote 11

It can be checked that we have, almost surely:

Taking the present value of this equality, we get that the total value of the firm, is:

Here the initial amount of capital available to the firm, x, needs to be allocated to the firm's investment projects (V 0), to the pension plan net of the tax shield ((1 − θ)A 0), and to the pension put purchased from the PBGC. Let $P_0^{{\rm reg}}$ be the premium charged by the PBGC to the firm, so that the new budget constraint, replacing (1), reads

and the total value is

Comparing this expression and the total value in the absence of a guarantee fund (see (11)), we obtain that

If the PBGC sells the put at fair value, i.e., if $P_0^{{\rm reg}} = P_0$ , the value of the firm with the guarantee is equal to the value without the guarantee. But the share of total firm value that goes to each of the three groups of claimholders is still impacted by the presence of the PBGC. In practice, the premium that the PBGC charges the sponsor is not equal to the fair value of the put, and corresponds to some fraction η of the regulatory value $L_0^{{\rm reg}}$
 . The total value of the firm will be increased if the pension put is underpriced $( P_0 > P_0^{{\rm reg}} )$
 and decreased if it is overpriced $( P_0 < P_0^{{\rm reg}} )$
 .
3.2 Numerical results
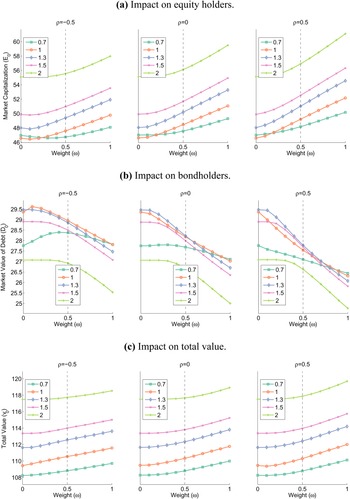
We let λ = 0.85, as in Bicksler and Chen (Reference Bicksler and Chen1985), and η = 0.1. This means that the PBGC charges the sponsor an amount equal to 10% of the regulatory value $L_0^{{\rm reg}}$ , and that its contribution is capped to 85% of promised pension payments.
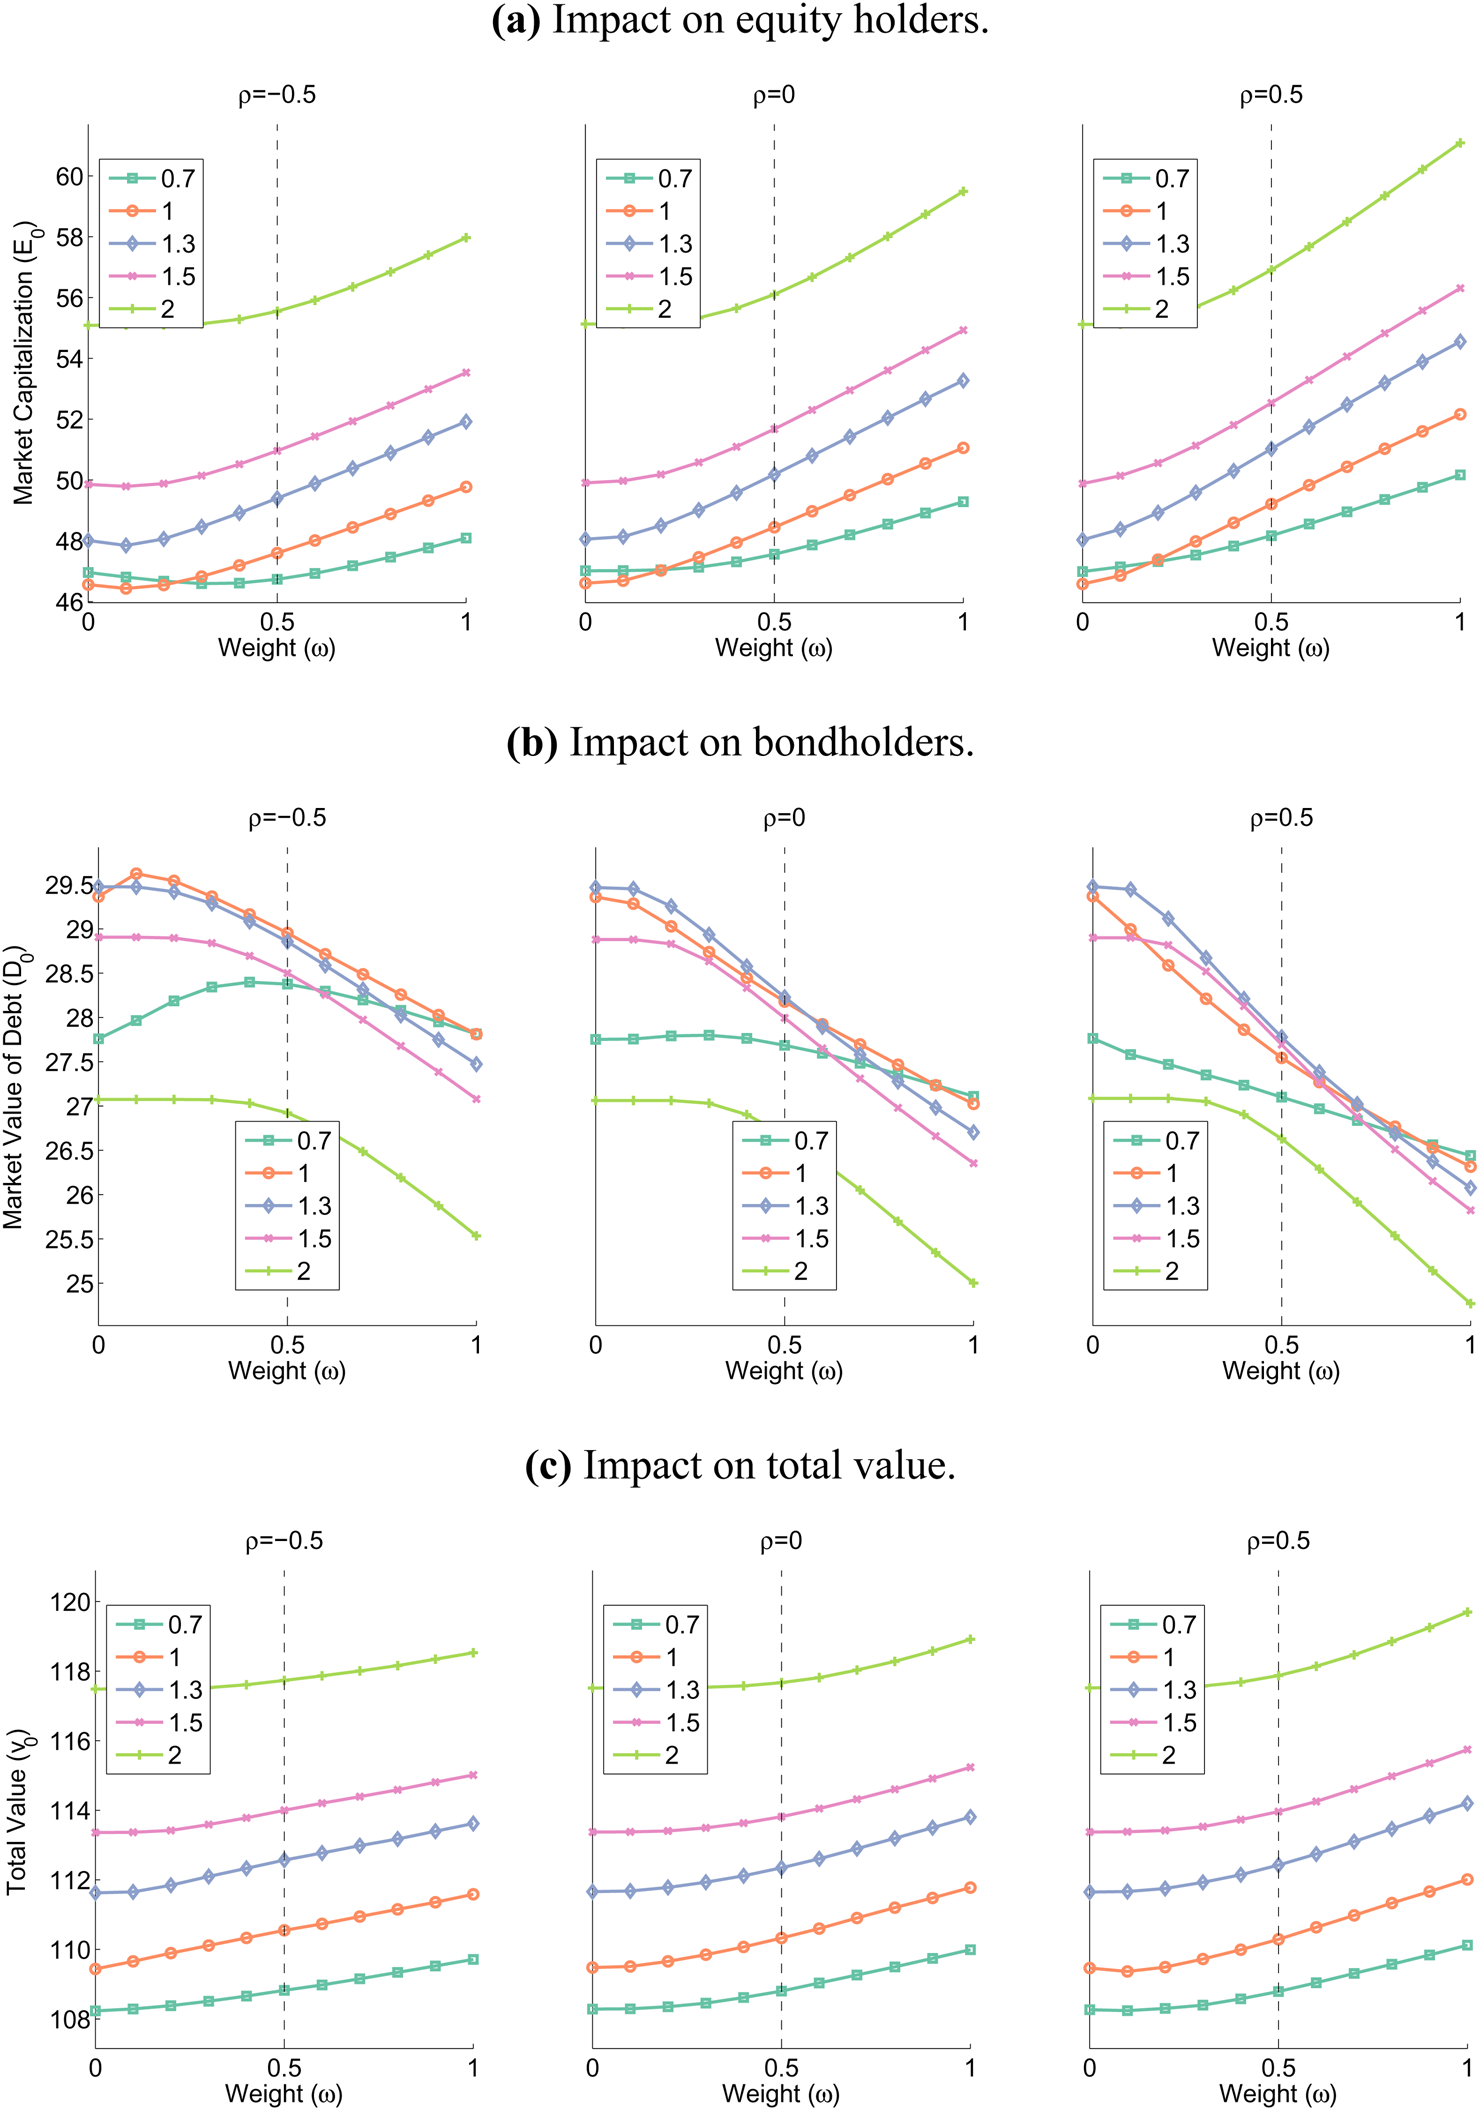
Figure 6 shows the impact of allocation decisions on the values of the claims held by equity holders and bondholders, and on the total firm value. The value of pension claims is not shown because the presence of the PBGC makes it almost insensitive to the investment policy, unless the funding ratio is very low and the policy is very aggressive: in this case, the pension fund can face so large a gap that the PBGC will not completely cover it, so liability value is adversely impacted. For equity holders and bondholders, the effect of allocation decisions is qualitatively similar to what it is without the pension guarantee (see Figures 2 and 3). Being entitled to surpluses, equity holders prefer a risky strategy, while bondholders have a more conservative view on the amount of risk that the pension fund should take. They have an indirect claim on pension assets through the surplus sharing rule, but they have only a limited access to upside since they do not receive more than the face value of debt: as a result, they are short a put on pension assets, so they are hurt by an increase in the volatility of pension assets. Although pensioners are in principle concerned with these effects, they are protected by the pension guarantee, so asset substitution takes place only between equity holders and bondholders.
Impact of allocation decisions in the presence of the PBGC. (a) Impact on equity holders. (b) Impact on bondholders. (c) Impact on total value. These figures perform comparative static analysis with respect to the allocation to the risky asset, ω, for various levels of the regulatory funding ratio (70%, 100%, 130%, 150% and 200%) and the correlation ρ between the firm's unlevered value and the risky portfolio held by the pension fund. Unless otherwise indicated, parameters are fixed at their base-case values. The vertical dashed line identifies the base case for ω.
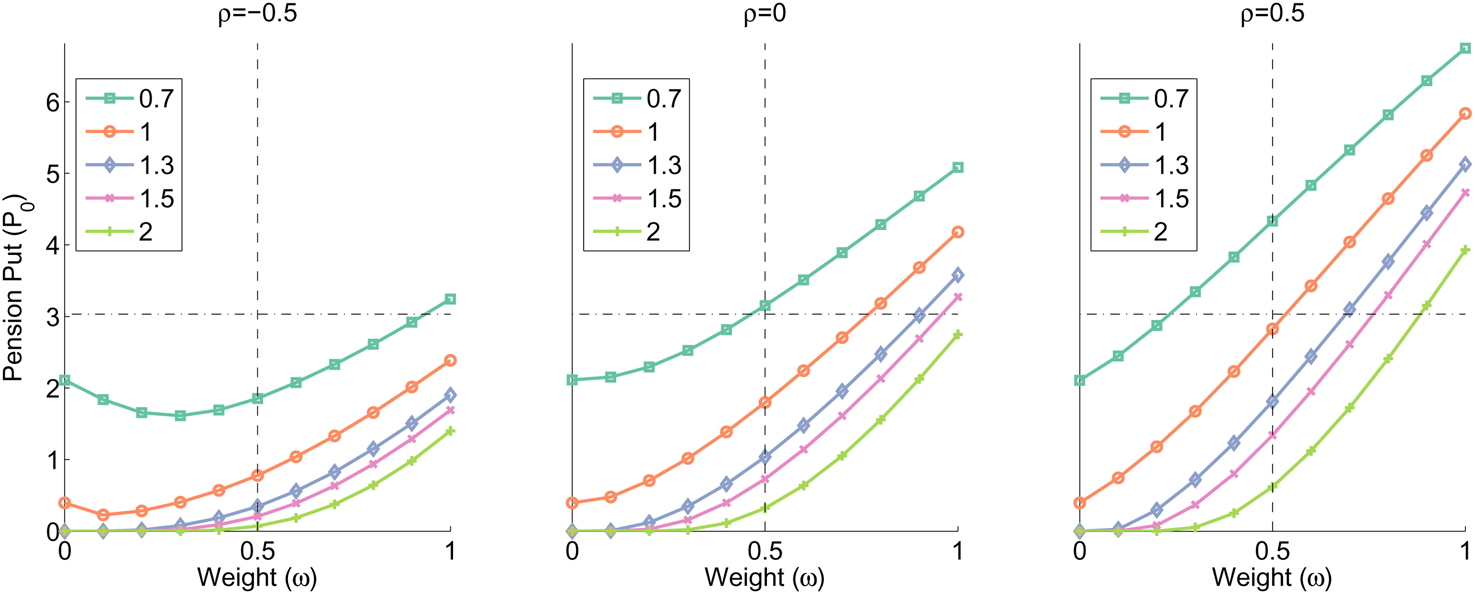
The analysis of the strategy maximizing the pension put in Sharpe (Reference Sharpe1976) and Bicksler and Chen (Reference Bicksler and Chen1985) suggests that it is optimal for shareholders to maximize the benefits obtained from the mispricing of the pension put, which is highest when the allocation to the risky asset is maximal, as confirmed in Figure 7. For a negative value of the correlation parameter ρ, there is in fact an interior value of the allocation that minimizes the value of the pension put, because the volatility of the aggregate assets of firm and pension fund is minimal for some non-trivial allocation to the risky asset. Figure 7 also suggests that the difference between the fair value of the pension put P 0 and the regulatory value for the pension put $P_0^{{\rm reg}}$ can be positive or negative depending on parameter values, and can be substantial. Looking at the overall effect on total firm and pension value in Figure 6, we see that only extreme allocations are optimal, with an optimal allocation that can be ω = 0 or ω = 1.
Impact of allocation decisions on the pension put. These figures perform comparative static analysis with respect to the allocation to the risky asset, ω, for various levels of the regulatory funding ratio (70%, 100%, 130%, 150% and 200%) and the correlation ρ between the firm's unlevered value and the risky portfolio held by the pension fund. Unless otherwise indicated, parameters are fixed at their base-case values. The vertical dashed line identifies the base case for ω and the dash-dot line represents the regulatory premium $P_0^{{\rm reg}}$ .
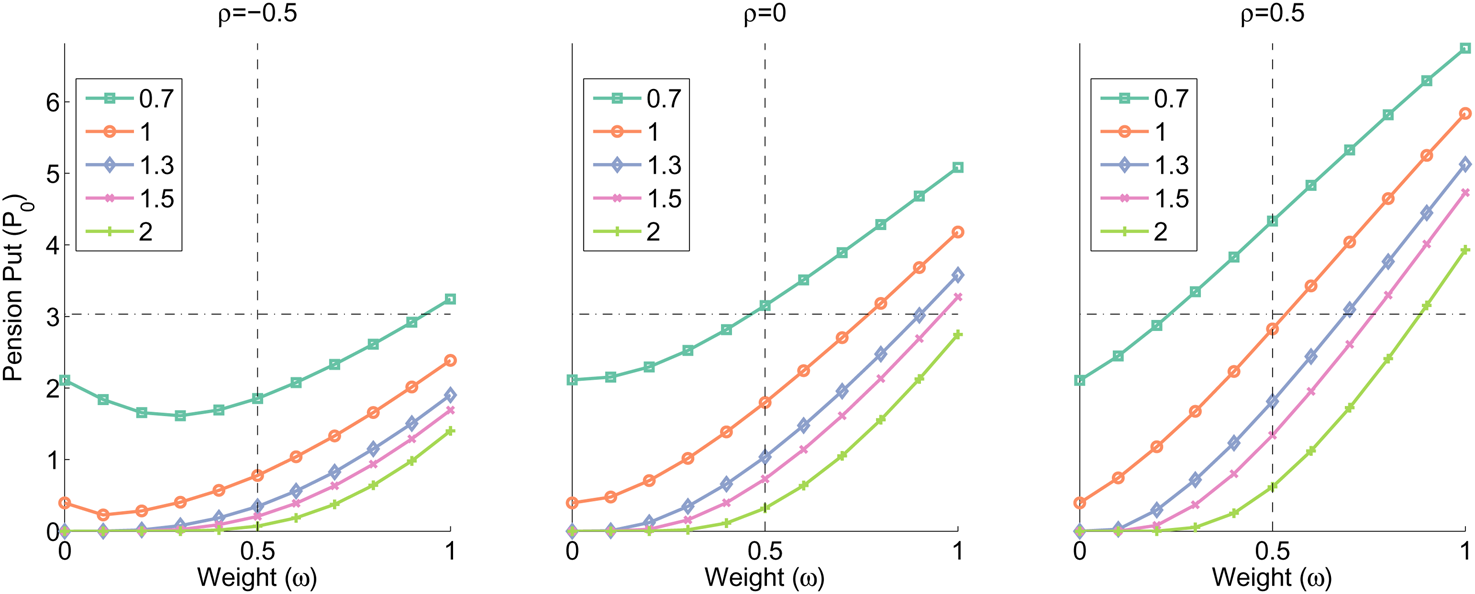
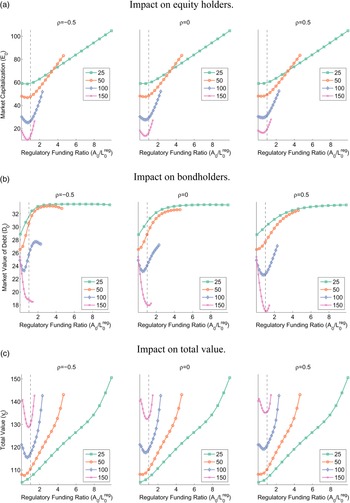
Figure 8 focuses on the impact of funding decisions in the presence of the PBGC. As before, the value of pension claims is not reported because it is hardly impacted by the initial endowment to the pension fund: this observation hinges on the fact that under the base-case assumptions, pensioners have no interest in surpluses, but if they were entitled to surpluses, the claim value would increase with the funding ratio (see the online Appendix). Comparing Figures 5 and 8 reveals that the impact of funding decisions on equity holders is not substantially different with or without the guarantee, but the effect of funding choices on bond value is very different when promised pension benefits are >100% of the initial firm's endowment. These are the situations where the premium charged by the PBGC to the sponsor firm is particularly high, which reduces the amount invested in the firm according to equation (14). Moreover, with a large debt to pensioners, the pension fund is unlikely to enjoy surpluses that could eventually help the sponsor repay its debt. This results in a non-monotonic pattern, with the price of corporate bonds being a decreasing function of the funding level for low or medium funding ratios. The same effects are at work for the total value. For large promised payments to pensioners, this quantity exhibits a U-shape. Similar results have been obtained by Bicksler and Chen (Reference Bicksler and Chen1985), in the context of a model with pension termination costs and a progressive tax structure on corporate income. For our base-case parameter values, we obtain that funding to the maximum, as opposed to the minimum, is the optimal solution to maximize firm value.
Impact of funding decisions in the presence of the PBGC. (a) Impact on equity holders. (b) Impact on bondholders. (c) Impact on total value. These figures plot the regulatory funding ratio of the pension fund against the fair liability value for different values of the promised payment to pensioners, L (25, 50, 100 and 150) and the correlation ρ between the firm's unlevered value and the risky portfolio held by the pension fund. The curves are parametrized by A 0, the initial capital made available to the pension fund. Unless otherwise indicated, other parameters are fixed at their base-case values. The vertical dashed line identifies the base-case regulatory funding ratio.
4. Conclusions and extensions
This paper proposes an integrated model for capital structure choices and pension fund allocation decisions, a needed tool to correctly assess the value of a pension plan. It has macro implications for the accounting regulation of pension funds, and micro implications for the funding and the management of pension plans. At the macro level, our model suggests that valuation principles for liabilities streams (and derivative assets written on them) should account for differences in financial health and capital structure decisions at the sponsor company level, as well as differences in asset allocation policy at the pension fund level. This finding leads to questioning the practice of using an arbitrary rate to value liability cash flows. At the micro level, the model provides a justification for the existence of asset substitution effects between pensioners and bondholders on the one hand, and equity holders on the other hand, who disagree on the optimal level of risk taking by the pension fund. The conflict of interest between pensioners and equity holders can be addressed by introducing a pension guarantee fund like the PBGC, but other options would be to grant pensioners at least partial access to surpluses, either via the surplus sharing rule, or through conditional indexation of benefits. Regarding the impact of funding decisions, we find that bondholders and equity holders generally benefit from higher funding ratios in the pension fund if pension surpluses are returned to the sponsor, but a surplus sharing rule that would be more favorable to pensioners would change the direction of these preferences.
Our work can be extended in a number of directions. First, a dynamic version of the model would allow a number of important effects such as random sponsor default, debt renegotiation, contribution smoothing and contribution holidays to be taken into account. Second, it would be useful to focus on the interactions between the groups of pensioners and workers, whose preferences are not aligned. For instance, employees can bargain for increases in wages to compensate for a deterioration in the present value of pension benefits, but this option is not available to retired beneficiaries. Moreover, the extent to which current wages and promises of future pensions are substitutes for each other will depend on labor market frictions. A third extension concerns the allocation strategy taken by the pension fund. In particular, because risk taking in the context of fixed-mix strategies is often detrimental to pensioners but benefits to equity holders, an idea would be to use dynamic portfolio insurance. Indeed, strategies such as Constant Proportion Portfolio Insurance (CPPI) enable to protect a minimum funding level while opening access to the performance of the risky asset. The benefits of such strategies in integrated ALM could usefully be explored. We leave these questions for further research.
Supplementary material
The supplementary material for this article can be found at https://doi.org/10.1017/S1474747221000032