


1. Introduction
Instability in a system is an intriguing nonlinear dynamics problem. In hydrodynamic systems with interfaces subjected to disturbances such as external vibrations, instability may appear as standing wave patterns or travelling waves at the interface of two fluids. This diverse area of research started with the Faraday's work (Faraday Reference Faraday1831). He observed that a water surface in a container subjected to piston-like vertical vibrating motion becomes unstable, provided that the forcing amplitude is larger than a threshold, leading to the formation of square-pattern standing waves with a response frequency half of the excitation frequency (subharmonic). At present, almost two centuries later, a vibrated liquid interface is still an active topic due to the complex underlying physics, as well as its applications, a recent bridging theory of a quantum-hydrodynamic analogue being a case in point (Bush Reference Bush2015; Oza et al. Reference Oza, Siéfert, Harris, Moláček and Bush2017; Couchman, Turton & Bush Reference Couchman, Turton and Bush2019). Since the work of Faraday, most attention has been given to vertical excitations, and rather few experimental and theoretical/numerical studies can be found on horizontally forced systems. Vertical and horizontal vibrations affect the liquid surface differently, in that the vertical vibrations modulate the gravitational acceleration and hydrostatic pressure gradient, while the horizontal vibrations cause a shear flow phenomenon along the direction of forcing. First, we briefly review some key studies on vertically vibrated liquids, particularly those reporting pattern formation, followed by studies on horizontally vibrated liquids, the latter being the focus of this current work.
Theoretically, the problem of inviscid fluid under vertical vibrations was addressed by Benjamin & Ursell (Reference Benjamin and Ursell1954), where they performed a linear stability analysis of the free liquid surface. Later, it was revisited to include viscous effects (Kumar & Tuckerman Reference Kumar and Tuckerman1994; Beyer & Friedrich Reference Beyer and Friedrich1995). However, linear analysis does not provide significant insight into the shapes of the patterns formed. In linear stability analysis, the governing Navier–Stokes equations are linearized about a flat interface and a zero-velocity field. Such linearized equations only depend on the wavenumber and are independent of the orientation of each wave. Thus, a nonlinear approach is required to understand pattern selection (Milner Reference Milner1991; Miles Reference Miles1993; Chen & Viñals Reference Chen and Viñals1999; Skeldon & Guidoboni Reference Skeldon and Guidoboni2007). Recent numerical studies have captured a range of surface patterns formed on the liquid film interface (Perinet, Juric & Tuckerman Reference Perinet, Juric and Tuckerman2009; Kahouadji et al. Reference Kahouadji, Périnet, Tuckerman, Shin, Chergui and Juric2015; Kentaro & Takeshi Reference Kentaro and Takeshi2015). Experimentally, for vertical vibrations, various patterns other than the classical squares (Douady & Fauve Reference Douady and Fauve1988; Douady Reference Douady1990) have been reported for large-aspect-ratio systems, i.e. where the length scale of the container is much larger than the wavelength of the patterns ( $L \gg \lambda$). These patterns include parallel lines, circles, spirals, hexagons, triangular patterns and quasi-patterns of eightfold and twelvefold symmetry (Christian, Alstrom & Levinsen Reference Christian, Alstrom and Levinsen1992; Edwards & Fauve Reference Edwards and Fauve1993, Reference Edwards and Fauve1994; Müller Reference Müller1993; Binks & van de Water Reference Binks and van de Water1997; Ding & Umbanhowar Reference Ding and Umbanhowar2006). Experiments in the ultrasonic range (40–170 kHz) have been conducted as well (Rahimzadeh, Ahmadian-Yazdi & Eslamian Reference Rahimzadeh, Ahmadian-Yazdi and Eslamian2018), where the substrate geometry and boundaries have been found to dictate or affect the pattern formation; in particular, a square substrate produces a checked pattern, while a circular petri dish produces circular-shaped travelling and standing waves. In another study by Rajchenbach, Clamond & Leroux (Reference Rajchenbach, Clamond and Leroux2013) for large-amplitude excitations, standing waves having twice the excitation amplitude were observed with a star-shaped and polygonal pattern in rectangular and circular containers. For shallow depths (1–2 mm) in a Hele-Shaw cell, Li, Yu & Liao (Reference Li, Yu and Liao2015) discussed a new family of two-dimensional (2-D) Faraday waves. They found that for such low film thicknesses, the observed waves were quite different from the traditional Faraday waves. At the extreme (maximum) position of the wave, all the liquid was held in the crest (trough) and the trough (crest) became a long horizontal line, close to the bottom of the cell. Arbell & Fineberg (Reference Arbell and Fineberg2002) have also reported superlattice-like patterns with temporal excitation of two frequencies.
In the case of horizontal vibrations, Yih (Reference Yih1968) performed the first theoretical treatment of the problem using long-wave approximation for an unbounded liquid layer. It was extended by Or (Reference Or1997) for arbitrary wavenumbers and a mathematical argument was presented stating that for unbounded layers, only synchronous (harmonic) solutions are possible in the presence of horizontal vibrations, unlike the vertical vibrations for which both harmonic and subharmonic solutions are possible. On the experimental front, studies have been performed using cylindrical and rectangular containers. Some earlier works (Hutton Reference Hutton1963; Miles Reference Miles1976, Reference Miles1984) observed both harmonic and chaotic regimes in cylindrical containers. In rectangular channels, cross-waves can also form (in addition to the primary waves), due to the presence of the sidewalls. Such cross-waves are subharmonic in nature and usually perpendicular to the axis of vibration (Varas & Vega Reference Varas and Vega2007). Porter et al. (Reference Porter, Tinao, Laverón-Simavilla and Lopez2012) investigated patterns under low-frequency (40–100 Hz) horizontal vibrations. They concluded that the cross-waves were oblique in nature, with angles between 50° and 80°. Similar findings related to the obliqueness of the cross-waves were reported in Pérez-Gracia et al. (Reference Pérez-Gracia, Porter, Varas and Vega2013, Reference Pérez-Gracia, Jeff, Fernando and José2014). It was further concluded that the subharmonic cross-waves form because of the parametric instability caused by the combination of primary harmonic surface waves and oscillatory bulk flow of the fluid. The cross-waves were observed to be concentrated near the boundary edges or walls. In a series of works, Bestehorn and co-workers solved the nonlinear Navier–Stokes equations numerically for a laterally unbounded liquid film (Bestehorn Reference Bestehorn2013; Bestehorn, Han & Oron Reference Bestehorn, Han and Oron2013; Richter & Bestehorn Reference Richter and Bestehorn2019) and proposed the idea of 2-D and three-dimensional excitations, i.e. combined horizontal and vertical oscillation. For one-dimensional (1-D) or single-axis horizontal vibrations, stripes or step-like patterns perpendicular to the excitation, and for 2-D horizontal excitation (which was called circular excitation), coarsening and large depressions on the surface were reported.
The rarity of experiments on horizontal vibrations is evident in the literature. In addition, in the experimental studies, the lateral walls of the container that holds the liquid act as a wavemaker, preventing a natural and homogeneous base flow. Additionally, the travelling surface waves hit the ‘hard’ boundaries (walls) of the container and are reflected with a change in polarity, i.e. a crest hitting the boundary is reflected as a trough and vice versa. These reflected waves can then further complicate the dynamics of the liquid surface. Some remedies have been suggested, in theory, to limit the sidewall effects, e.g. by considering an annular ring cell with a large radius for the experiments (Bestehorn Reference Bestehorn2013). Further, with large-aspect-ratio systems  $(L \gg \lambda )$, it is expected to achieve a better approximation for the ideal situation of infinite lateral length (Edwards & Fauve Reference Edwards and Fauve1994). In recent work (Khan & Eslamian Reference Khan and Eslamian2019), we studied the problem of a liquid layer, cast on a flat rectangular glass substrate without physical side walls, having contact lines pinned to the edges, where the substrate was subjected to single-axis (1-D) lateral vibrations. The ‘soft boundaries/lateral walls’ were created by the pinned edges of the liquid. The studied problem showed an interesting mixed behaviour with the characteristics common to theoretically unbounded liquid layers, fluid inside a walled container and a flattened droplet.
The present study is a continuation of our previous work on 1-D horizontal vibrations (Khan & Eslamian Reference Khan and Eslamian2019) and is intended to study different patterns formed on a liquid film pinned to a substrate, subjected to low-frequency (55–333 Hz) multi-axis (x and y, both in horizontal directions) forcing. The substrates are square, circular, triangular, elliptical and stadium-shaped, and the response of the liquid film is in the form of standing and/or travelling wave patterns. We analyse the formation of the travelling and standing waves that coexist in some cases by wave superposition and demonstrate the reason behind such coexistence of waves. The liquid film surface is also probed under the effect of ultrasonic horizontal vibrations (20–170 kHz). The various excited patterns are found to depend on the substrate geometry and the interplay between the phases of the vibrational axes. It is observed that for low-frequency vibrations, the standing wave pattern and the travelling waves have the same frequency as that of the forcing frequency (harmonic); however, for ultrasonic vibrations, the frequency of the observed pattern and travelling waves is several orders of magnitude lower than the forcing frequency. No subharmonic cross-waves are observed in our experiments. For the square substrate under multi-axis excitation, a perfect square pattern of standing waves is observed, like the classical squares reported in the Faraday experiments for vertical vibrations (Douady & Fauve Reference Douady and Fauve1988; Douady Reference Douady1990). Furthermore, circle and spiral patterns are observed for the circular substrate in single- and multi-axis excitations, respectively, which were also reported by Edwards & Fauve (Reference Edwards and Fauve1994) for vertical vibrations. Other patterns observed in our experiments are lines (square substrate under 1-D vibration), swirls (stadium substrate under 2-D vibration), pentagons (circular substrate under ultrasonic vibration), etc. We also report the phenomena of pattern switching when there is a phase difference of 90° between the two axes of vibrations on a square substrate. Several of the above-mentioned phenomena are reported, to the best of our knowledge, for the first time.
Here, we consider a viscous, isothermal and incompressible liquid layer with a free surface in contact with air, where the liquid contact lines are pinned to the edges of the substrate. The substrate is mounted on a high-precision vibrating device, capable of moving in two lateral directions (x- and y-axes), as shown in figure 1. The mean film thickness is h 0, and the fluid properties like density ρ, surface tension σ and kinematic viscosity ν are assumed constant. In appendix A, we provide a brief overview of the equations governing the motion of a liquid film along with proper boundary conditions, i.e. pinned boundary conditions as realized in this work.
(a) Schematic representation of a multi-axis vibrator, where the red arrows show possible directions (x and y) of forcing. (b) The 2-D view showing the xz plane of a vibrated (square) substrate secured on the vibrator with a wavy liquid surface, and average undisturbed liquid film/layer thickness h 0 shown as dotted lines. In this experimental work, the liquid is pinned to the substrate edges, forming soft walls at the menisci, as shown. The waves shown are not to scale. The details of the meniscus and the parameter definitions are given in appendix A.

2. Experimental set-up
Figure 2 shows the experimental set-up for the top-view and side-view imaging. To cast a film of a desirable thickness on a certain substrate with known dimensions and area, a pre-calculated amount of deionized and distilled water was weighted with a precise digital balance having 0.1 mg readability (Mettler Toledo, USA). It was then transferred onto a horizontally levelled substrate and spread to make a film pinned on all edges of the substrate. To facilitate liquid spreading and avoid dewetting, and to improve reliability and repeatability of the experiments, the glass substrates were first washed in an ultrasonic bath and then were UV-treated, in order to increase the surface energy and remove contaminants. An adhesive double-sided transparent tape was employed to attach and secure the bottom of the substrate to the vibrator surface.
Experimental set-up for (a) top-view imaging and (b) side-view imaging. The low-frequency vibrator is shown here with double-headed arrows, indicating the possible forcing directions. The images on the right show the film surface as viewed in each case.

A high-speed CMOS camera (FASTCAM Photron SA3, Model 120 K, Japan) was used to capture top-view images of the liquid film surface. The camera was placed perpendicular to the film surface and set at 2000 frames per second. The image resolution was adjusted for various substrates to obtain the best-quality images at a desired field of view. Table 1 presents the different substrates used in these experiments with their respective image resolutions. These image resolutions are for the xy plane (top view) and suggest the uncertainty or maximum precision with which we can measure the wavelengths of patterns for each particular case. Raw images were processed using ImageJ software to extract greyscale images, in order to enhance the clarity. Surface wave amplitude measurement was conducted using side-view imaging with a CCD camera (Biolin Scientific, Sweden). The details of wave amplitude measurement are given in appendix B.
Substrate geometries and dimensions along with the associated image resolution per pixel. Parameters: s, side length (square or triangle); d, diameter (circle); a, major axis; b, minor axis (ellipse); c, rectangular length; r, radius of semicircles (stadium shape).

The low-frequency vibrating device is a multi-axis motion generator voice coil (H2W Technologies, Santa Clara, CA, USA) controlled by SPiiPlus MMI Application Studio software and an EtherCAT controller (ACS Motion Control Ltd, Israel). The voice coil employs a linear magnetic encoder (part number 001, RLS d.o.o., Ljubljana, Slovenia), able to move with a resolution of 1 μm with repeatability better than the resolution, according to the manufacturer datasheet. The device can generate high-precision oscillatory motion in two lateral axes, x and y, either separately or simultaneously. However, it should be made clear that the device does not generate any motion in the vertical direction (z-axis). The frequency (f) and amplitude (a) of the excitations could be controlled by adjusting the motion parameters such as velocity, acceleration, deceleration and jerk with the help of the software (SPiiPlus MMI Application Studio). The software displays the signal ‘feed-back position’ of the vibrator while in motion. The graphical form of this feedback position provides the amplitude and frequency as shown in figure 3. Since the vibrator could move back and forth within 1 μm around the centre, the minimum possible excitation amplitude is 0.5 μm. In simultaneous vibrations of x- and y-axes, which will be referred to as 2-D excitations hereafter, both axes move together. However, the phase difference ϕ between the vibration waves exerted on the two perpendicular axes could alter the path followed by the vibrating plate and subsequently the substrate placed on top of it. In order to determine the actual path as a result of this phase difference, the position of the centroid of the substrate (in the xy plane) was measured at 30 equal time steps during one cycle. It was observed that for the in-phase (ϕ ≈ 0°) and out-of-phase (ϕ ≈ 180°) excitations, the paths were similar (mirror image). However, for the out-of-phase (ϕ ≈ 90°) excitation, the path was different, as shown in figure 3. All three phase angles were used in this experimental study.
(a,c,e) Wave profiles of the 2-D excitations. (b,d,f) Paths followed by the centroid of the substrate in the xy plane. For (a,b) ϕ = 0°, (c,d) ϕ = 90° and (e,f) ϕ = 170°. Yellow and green curves represent the motion of x- and y-axes, respectively. The excitation amplitude (a) was held as 1 mm on both axes to see the path accurately.

In some tests, high-frequency 1-D ultrasonic horizontal vibrations were applied to the substrate. For this purpose, a disc-type Langevin ultrasonic transducer having a fixed resonant frequency operating at an input power of 50 W was mounted inside a steel box to generate vertical vibrations on the top surface of the box. The box was then tilted 90° and the substrates were placed on the side wall of the box to generate horizontal vibrations. A signal generator was used to actuate the transducer (Yuhuan Clangsonic Ultrasonic Co. Ltd, Zhejiang, China). The detailed characterization of the ultrasonic vibrators by laser beams is provided elsewhere (Gholampour, Brian & Eslamian Reference Gholampour, Brian and Eslamian2018).
Table 2 shows the range of input parameters used in the experiments. With our low-frequency vibrator, there is a limit for the maximum achievable amplitude for various frequencies before the vibrator stops the motion due to overcurrent. This maximum amplitude depends on the value of the excitation frequency, i.e. for a higher frequency, the maximum achievable amplitude is smaller than that for a lower frequency. Here, we performed all the tests at the maximum amplitude that was possible to achieve for a certain frequency, e.g. for f = 55 Hz, the amplitude a = 100 μm, whereas for f = 333 Hz, a = 5 μm. We should mention that changing the excitation amplitude at a fixed forcing frequency results in a change in the amplitude of the induced surface waves and hence the wave visibility, as reported in a previous work (Khan & Eslamian Reference Khan and Eslamian2019). As listed in table 2, the liquid film thickness throughout this work is ∼1.25 mm. The effect of the liquid film thickness has been previously studied for low-frequency horizontal vibrations (Khan & Eslamian Reference Khan and Eslamian2019) and for ultrasonic vibrations (Rahimzadeh et al. Reference Rahimzadeh, Ahmadian-Yazdi and Eslamian2018). In brief, as the film thickness is increased, the surface wave amplitude decreases. For very thin films, the waves are not formed on the surface, as very high amplitudes of vibration would be needed to excite the film. Effectively, the surface waves are best visible in a certain window of film thickness, and in this work we have chosen the liquid film thickness in that window.
Range of the experimental input parameters.

We argue that our experiments with pinned contact lines resemble more the theoretical case of waves on an unbounded film than waves within containers with hard physical walls. Application of larger substrates would result in a decrease in the effect of the meniscus and the pinned walls; however, the maximum size of the substrate was dictated by the size of the vibration generator and the field of view of the camera. The substrate holder (vibrating plate) of the multi-axis vibration generator device is 7 cm × 11 cm (figure 2a). Therefore, to ensure that the substrate is well attached to the vibration holder, it is desirable to use a substrate that fits within the boundaries of the vibration holder. In addition, for larger-area substrates, the camera should be mounted at a greater distance to ensure that the entire film remains in the camera's field of view, which compromises the fine details of the patterns and capillary waves (resolution). Considering a trade-off between the substrate size and the field of view/resolution, the maximum substrate size we used in the experiments was 5 cm × 5 cm.
3. Results and discussion
3.1. Characteristics of surface waves
For both 1-D and 2-D excitations, we measured the frequency of the standing waves formed on the surface, and found that for low-frequency vibrations, the frequency of the standing waves was the same as the excitation frequency (harmonic oscillations), as also found previously for a rectangular substrate with only 1-D primary standing waves (Khan & Eslamian Reference Khan and Eslamian2019). This agrees with the mathematical arguments of Or (Reference Or1997) for horizontal vibrations where shear forces play the major role. A representative case showing the complete spatiotemporal evolution during one cycle of a square pattern is demonstrated in appendix C.
In contrast, for ultrasonic vibrations, the measured frequency of the surface waves was several orders of magnitude lower than the excitation frequency, in agreement with the findings of previous work (Rahimzadeh et al. Reference Rahimzadeh, Ahmadian-Yazdi and Eslamian2018). Interestingly, for three of the ultrasonic excitation frequencies, where instability appeared (20, 40 and 68 kHz), the surface waves had the same frequency, i.e. ∼250 Hz. For a frequency of 170 kHz, the surface remained stable and no waves were detected. Although at this high frequency the amplitude of vibration was small, i.e. ∼0.5 nm (Gholampour et al. Reference Gholampour, Brian and Eslamian2018), this experimental observation is in qualitative agreement with the theoretical work of Shklyaev, Alabuzhev & Khenner (Reference Shklyaev, Alabuzhev and Khenner2009), who suggested that film stability could be achieved for very-high-frequency ultrasonic horizontal vibrations.
The wavelength was measured for different cases using surface profiles obtained through image processing. Some representative greyscale images with surface profiles are shown in figure 4, for both 1-D and 2-D horizontal vibrations. A central region of the film surface was specified, excluding ∼2.5 mm from each edge, to minimize the effect of the curvature on wavelength measurement. The wavelength was measured multiple times and average values and standard deviations are reported in table 3. The wavelength was found to be a function of the excitation frequency only and independent of the substrate geometry, amplitude and direction of vibration. Given the small and millimetre-range wavelengths, the waves are ‘capillary waves’ and thus dominated by surface tension.
Greyscale images and the associated surface profile through the mid-plane in the x-axis, as shown by red lines in (c), of representative cases. Greyscale unit represents the wave amplitude. (a) Square substrate (s = 25 mm) under 1-D vibration (x-axis) at f = 55 Hz, 1 greyscale unit = 9.1 ± 0.8 μm, (b) square substrate (s = 50 mm) under 1-D vibration (x-axis) at f = 165 Hz, 1 greyscale unit = 2.2 ± 0.3 μm, and (c) circular substrate (d = 50 mm) under 2-D vibration at f = 165 Hz.

Theoretical (dispersion relation) and experimental values of wavelengths for different excitation frequencies of surface waves formed on a square substrate.

Table 3 also lists the theoretical (calculated) wavelengths and the relative errors. The theoretical values are obtained by the dispersion relation in potential flows,  ${\omega ^2} = \tanh (kh)[gk + (\sigma /\rho ){k^3}]$, where
 $\omega = 2{\rm \pi} f$ is the angular frequency in rad s−1,
 $k = 2{\rm \pi} /\lambda $ is the wavenumber and g,
 $\sigma $ and
 $\rho $ are the gravitational acceleration, surface tension and density of the fluid, respectively (e.g. Currie Reference Currie2013). The values of
 $\sigma $ and
 $\rho $ for water were taken as
 $0.072\,\textrm{N}\,{\textrm{m}^{ - 1}}$ and
 $1000\,\textrm{kg}\,{\textrm{m}^{ - 3}}$, respectively. Figure 5 shows a graphical representation of the data in table 3 for wavenumber
 $k = 2{\rm \pi} /\lambda $. Gravity in the dispersion relation has an insignificant effect, as mentioned before.
The theoretical (dispersion relation) and experimental wavenumber  $k = 2{\rm \pi} /\lambda $ of surface waves on a liquid film cast on a square substrate against the frequency of excitation.

Table 3 shows that with increasing frequency, the difference between the experimental and theoretical values increases, i.e. at lower frequencies the dispersion relation provides a better prediction of the wavelengths; however, as frequency increases, the quantitative difference between the two values increases. The difference between the experimental measurements and the calculated wavelengths using the ideal dispersion relation is attributed to multiple effects, such as the viscous nature of water, nonlinear effects due to the non-negligible rate of change of the wave amplitude with respect to the lateral lengths (breakdown of the long-wave approximation), the three-dimensional nature of the flow field rather than a 2-D approximation, the presence of the pinned contact lines and the meniscus instead of an unbounded liquid layer, none of which are accounted for in the dispersion relation. The viscous and nonlinear effects play a more important role with an increase in the excitation frequency. Similar deviations from the linear dispersion relation have been observed in vertical vibration experiments for oscillating blobs or oscillons (Shats, Xia & Punzmann Reference Shats, Xia and Punzmann2012).
The results presented in table 3 and figure 5 are for liquid films subjected to 1-D horizontal vibrations. However, the same numbers were obtained when the substrate was subjected to 2-D vibrations with identical frequencies. As shall be seen later in § 3.3, 2-D excitation with similar frequencies on both axes produces a square and transitioning line pattern. The wavelength in these patterns is the same along both axes (x and y), confirming the validity of the dispersion relation for 2-D vibrations. For 2-D excitation with different frequencies applied on each axis (to be discussed later), the dispersion relation still holds valid especially near the boundaries. However, the waves produced with different wavelengths (due to different excitation frequencies on each axis) interfere and form a complex pattern.
In this section, the overall frequency and wavelength response of a liquid film subjected to 1-D and 2-D horizontal vibrations have been provided and discussed. In the next sections, we present the results related to the patterns formed on a liquid film surface for various geometries under different conditions of applied horizontal vibrations.
3.2. Low-frequency 1-D vibrations
For rectangular and square-walled containers subjected to 1-D vibration, cross-waves are usually formed as reported in the literature and mentioned earlier in the introduction. In our experiments, the liquid film is pinned to the substrate edges, forming soft walls; as such, for square substrates under low-frequency 1-D vibrations, only parallel lines or stripe patterns are observed and cross-waves are absent. The orientation of the line pattern is perpendicular to the direction of the forcing, as previously seen in figure 4(a,b). We observed that upon activation of the vibrator, two counter-propagating waves initiate and travel from the edges of the substrate and perpendicular to the actuated axes and meet at the centre. For substrates with not very large aspect ratios (figure 4a), i.e. the substrate length is still larger than the wavelength but few waves fit within the substrate length, these counter-propagating waves fully superpose along the whole length of the substrate and form a standing wave pattern. The entire surface of the liquid moves up and down with a frequency the same as the excitation frequency. However, for larger substrates ( $L \gg \lambda $; figure 4b), we observed that the entire surface does not move up and down as that observed in the standing waves. Instead, the waves travelling from the edges meet at the centre and only near the substrate centre do the standing wave patterns form; on the rest of the surface travelling waves can be seen moving towards the middle from the edges perpendicular to the excitation. The formation of line patterns and the absence of cross-waves lend credence to the idea that substrates without physical walls are a better approximation of the theoretical case of an unbounded film than containers with hard physical walls.
The absence or attenuation of cross-waves was confirmed by taking the Fourier transform of such cases. Fourier transform decomposes an image into sine and cosine components and the output is presented in the frequency domain. As a representative case, the fast Fourier transform of figure 4(a) is shown in figure 6. The vertical line pattern in the spatial domain is reduced to two bright spots along the x-axis in the frequency domain. A third bright spot can also be seen in the centre, which is the mean value of the spatial image. The two bright spots, equally distant from the centre, correspond to the peaks and valleys of the pattern. Had there been any cross-waves, similar bright spots (or even less bright) would have also appeared in the vertical direction (y-axis) along the centre.
Fourier transform for figure 4(a). The two bright points along the horizontal direction correspond to the vertical line pattern showing the absence of cross-waves.

For the circular substrate, the wave pattern was slightly different for small (d = 15 mm) and large (d = 50 mm) circles under the effect of 1-D vibration. For the small circle (d = 15 mm), a complete circular pattern is observed as shown in figure 7. Furthermore, a close inspection reveals that as we follow the individual travelling waves along a circular path, the crests are replaced by troughs and vice versa on the upper and lower portions of the circle, with respect to the x-axis, as shown with the arrows.
Circular pattern for a small circular substrate (d = 15 mm) excited at f = 200 Hz (y direction). The wave profiles passing through the mid-plane (marked by dashed lines in greyscale image) along the x and y directions are also shown.

For the large circular substrate (d = 50 mm), a broken or incomplete circular pattern is observed (figure 8). Travelling waves move towards the centre from the circumference along the direction of vibration. These counter-directional travelling waves meet at the centre of the circle, superpose and form standing waves in the middle of the substrate. The waves are stronger along the axis of vibration (y-axis here), and as they move along the other axis (x-axis), the amplitude of these travelling waves decreases. The wave profiles along x- and y-axes, passing from the mid-plane of the substrate in both directions, show that along the x-axis only in the middle of the substrate a standing wave is formed. There are no waves on the sides as can be seen from the random signals (figure 8b). Along the y-axis, a stable wave pattern is seen from the profile, which is only distorted near the top edge (∼45–50 mm), due to light reflection (figure 8c). It is noteworthy that this broken circular pattern on the large circular substrate (d = 50 mm) is subtly more pronounced at higher frequencies as can be seen from figure 8(d,e). The wave attenuation is promoted along the non-vibrating axis (x-axis here) with increasing frequency.
Circular pattern for large circular substrate (d = 50 mm) excited at various frequencies (y direction). For f = 100 Hz (a), the wave profiles through the mid-plane (marked by dashed lines in greyscale image) along x- (b) and y- (c) axes are shown. (d,e) Circular pattern at f = 55 and 165 Hz. With increasing frequency, dissipation along the non-vibrating x-axis is more prominent due to higher wavenumber.

Using side-view imaging, the amplitude of the travelling waves was measured at different points along half of the circumference of the circle, shown by red dashed line in figure 8(a) (lower hemisphere). The results shown in figure 9 confirm that at two ends of the x-axis (non-vibrational axis), the wave amplitude is zero and as we move along the circle circumference, the amplitude increases.
Variation in surface wave amplitude along the lower half of the circumference of the large circle (d = 50 mm), manifested by the red dashed line as shown in figure 8(a).

The triangular substrate under 1-D excitation presents an interesting and intriguing wave interaction phenomenon involving a combination of standing and travelling waves. A diamond-shaped pattern was observed for both small and large equilateral triangles as shown in figure 10. The waves travelling from the left and right sides of the triangle superposed to form such a pattern. It is worth mentioning that this was not a purely standing wave pattern, i.e. the entire surface of the liquid was not moving up and down with a diamond pattern. This will be analysed and elaborated in the following.
Diamond- or lozenge-shaped pattern for equilateral triangular substrate as a result of 1-D vibration applied along the x-axis. Instantaneous greyscale images for (a) s = 20 mm, f = 100 Hz, (b) s = 40 mm, f = 100 Hz and (c) s = 20 mm, f = 200 Hz.

The pattern of figure 10 is formed due to the superpositioning of two counter-moving travelling waves as shown by the illustration in figure 11. The harmonic waves are produced along the dotted sides of the substrate, propagating at an angle with respect to the horizontal direction. Since the direction of forcing is along the x-axis, the bottom side of the triangle will not produce waves of its own. The two wave vectors with their constituent components are shown in figure 11(b).
(a) Triangular substrate shown along with the direction of vibration. Harmonic travelling waves are produced along the dotted sides. The red arrows show the direction of propagation, while the blue lines represent the waves. (b) The wave vectors are decomposed along x- and y-axes.

In an arbitrary direction r in the xy plane, the wave equation with wave vector denoted by k pointing in the direction of propagation and wave amplitude  $\varepsilon $ is written as follows:
 \begin{equation}\eta (\boldsymbol{r},t) = \varepsilon \sin (\boldsymbol{k}\boldsymbol{\cdot }\boldsymbol{r} - \omega t) = \varepsilon \sin ({k_1}x + {k_2}y - \omega t).\end{equation}
Thus, the wave equations for the two harmonic waves, having equal amplitudes, as shown in figure 11 will be in the following form, considering the inclination angle of the wave vectors:
 \begin{gather}{\eta _1}\, (x,y,t) = \varepsilon \left[ {\sin \left( { - {k_1}x\cos \frac{{\rm \pi} }{3} + {k_1}y\sin \frac{{\rm \pi} }{3} - \omega t} \right)} \right],\end{gather}
 \begin{gather}{\eta _2}\, (x,y,t) = \varepsilon \left[ {\sin \left( {{k_2}x\cos \frac{{\rm \pi} }{3} + {k_2}y\sin \frac{{\rm \pi} }{3} - \omega t} \right)} \right].\end{gather}
Since the two wave vectors here are generated by identical excitation frequencies, adding the two equations and assuming  $k = {k_1} = {k_2}$ yield the following:
 \begin{equation}{\eta _1} + {\eta _2} = 2\varepsilon \sin \left( {ky\sin \frac{{\rm \pi} }{3} - \omega t} \right)\cos \left( {kx\cos \frac{{\rm \pi} }{3}} \right).\end{equation}
We note that the first trigonometric term on the right-hand side oscillates with respect to y and t and the second term oscillates with respect to x only. Therefore, the above form of the two waves, i.e. travelling and interacting at an angle to each other, shows that the resultant superposed wave has the characteristics of both the travelling and standing waves. The y component of the waves  $\sin \,(ky\sin \,({\rm \pi} /3) - \omega t)$ remains a travelling wave, because it is time-dependent, while the x component of the waves
 $\cos \,(kx\cos \,({\rm \pi} /3))$ forms a standing wave.
The mixed behaviour of the resultant wave is validated by observing the spatiotemporal evolution of the liquid surface for a complete cycle. As an example, surface evolution for the case shown in figure 10(c) is presented in figures 12 and 13, along x and y directions, respectively.
Temporal evolution of the wave in the x direction for the case shown in figure 10(c). The standing wave pattern can be seen during the evolution. At t = 1 ms and t = 3.5 ms, the standing pattern changes direction. The red arrows point to such locations precisely, where the profile is about to change direction. The abscissa of the profile shows the distance along the mid-plane (mm) in the x direction and the ordinate shows the amplitude in arbitrary greyscale units, where 1 greyscale unit = 2.2 ± 0.2 μm.

Temporal evolution of the wave in the y direction for the case shown in figure 10(c). The red arrow points at a specific spot in space that travels in time from left to right. The abscissa shows the distance along the mid-plane (mm) in the y direction and the ordinate shows the amplitude in arbitrary greyscale units, where 1 greyscale unit = 2.4 ± 0.2 μm.

Figure 12 (x-direction profile) shows that from t = 0 to 0.5 ms, the wave amplitude decreases. At t = 1 ms, the profile shows that the wave is changing direction. The red arrow points to the wavy pattern having become random, implying the absence of a sinusoidal pattern and the formation of a smooth surface. However, the surface is not completely smooth due to the presence of waves in the y direction. At t = 1.5 ms, the pattern re-emerges. At t = 2 ms, the amplitude of the wave is seen to increase. At t = 2.5 and 3 ms, the wave amplitude decreases and at t = 3.5 ms, the wave pattern again changes direction and the wavy profile is changed to a random signal as indicated by the red arrow. From t = 4 ms and onwards, we see that the pattern forms again, but now the crests are replaced with troughs and vice versa. At t = 5 ms, the cycle completes.
The temporal evolution along the y-axis shows the travelling nature of the surface profile with no standing pattern (figure 13). It is observed that the wave profile is inherently different from that of figure 12, in that it does not change direction. Instead, tracing a particular spatial point as shown in figure 13 by the red arrows reveals that the wave travels in time and after 5 ms a new wave appears.
For an elliptical substrate, the curved boundaries produce two simultaneous patterns of travelling and standing waves when subjected to 1-D vibration along the minor axis, as shown in figure 14. Around the middle part, where the boundaries of the ellipse are relatively straight, pure harmonic standing waves (with somewhat parallel-line pattern) form by the counter-directional waves travelling along the same line. However, above and below this part, the two travelling waves (which are mirror images of each other) form a travelling pattern, as a result of superpositioning.
Two different patterns in an elliptical substrate simultaneously under 1-D vibration applied along the minor axis (x-axis). Purely harmonic standing waves appear around the substrate centre. Above and below the minor axis, a pattern of travelling waves forms due to superposition of the waves: (a) a = 20 mm, b = 10 mm and f = 333 Hz; (b) a = 40 mm, b = 20 mm and f = 100 Hz. The red arrow in (a) shows the direction of forcing. Note that the waves are initiated from the left and right sides of the substrate. Supplementary movie 1 (available at https://doi.org/10.1017/jfm.2020.468) provides additional insight (a = 20 mm, b = 10 mm, 1-D vibration at f = 200 Hz).

When vibration is applied along the major axis (here the y-axis), again the pattern formed is a combination of travelling and standing waves, but with a different shape, as shown in figure 15. Given the shape of the ellipse, waves start from the upper and lower sides and move towards the centre, effectively moving from a smaller to a larger area. This expanding or diverging motion of the travelling waves causes dissipation in wave energy. Thus, for a small substrate of size a = 20 mm, b = 10 mm, standing waves appear only near the centre, while for a larger substrate with size a = 40 mm, b = 20 mm, the waves almost completely dissipate upon reaching the centre.
Patterns formed by the waves at f = 165 Hz due to vibrations along the major axis (y-axis). (a) The case with a = 20 mm and b = 10 mm shows standing waves in the centre only. (b) The case with a = 40 mm and b = 20 mm shows that the travelling waves moving along the major axis dissipate near the centre, and hence no standing waves form. The arrow in (a) shows the direction of forcing. Note that the waves are initiated from the top and bottom of the substrate.

3.3. Low-frequency 2-D vibrations
In § 3.2, we observed that applying vibration only along one axis (1-D vibration) but on a substrate other than square or rectangular, such as triangular, generates waves in both x and y directions, in a Cartesian coordinate system, resembling 2-D vibrations. In this section, we extend the scope and apply vibrations on x and y directions for several substrate geometries. As mentioned in § 2, for 2-D vibrations, the phase difference between the two lateral axes can alter the path followed by the vibrator and subsequently by the substrate. The different paths pursued by the substrate cause different patterns on the film surface, which will be discussed here.
For circular substrates, a spiral-like pattern is formed by the travelling and standing waves when the phase difference between the two axes is ϕ ≈ 90° (figure 16). A spiral pattern was also observed by Edwards & Fauve (Reference Edwards and Fauve1994) for vertical vibrations. At this phase difference, the path of the substrate centroid trajectory is like an elongated circle (cf. figure 3b), causing the formation of a spiral pattern on the film surface. The spiral rotates clockwise while oscillating in the vertical direction at the same frequency as that of the excitation. The instantaneous wave profiles along x- and y-axes show slightly different behaviours. Along the x-axis, the waves are smooth and pronounced, whereas along the y-axis, on the upper half of the circle, the waves are less strong as compared to the lower half. This can be observed from the greyscale image and the y profile in figure 16. Supplementary movie 2 shows spiral motion for the substrate with d = 50 mm subjected to excitation of f = 165 Hz and ϕ ≈ 90°.
Spiral-like pattern for d = 15 mm, f = 200 Hz under 2-D vibrations with ϕ ≈ 90° phase difference between vibrations applied on the two axes. The wave profile for the greyscale image is shown in the x and y directions passing through the mid-plane (marked by dashed line). On the two graphs, ‘0’ of the abscissa refers to the left and bottom of the substrate, respectively.

For ϕ ≈ 0° and ϕ ≈ 180°, the pattern is similar to that of the 1-D excitation (figures 7 and 8), i.e. a circular pattern of standing waves forms; however, the position of the weak (or strong) part of the wave pattern is displaced or rotated about 45°, as shown in figure 17. The path followed by the substrate for such phase difference is shown in figure 3(b,f). The substrate moves at nearly 45° from the vertical and horizontal axes and this tilt subsequently appears in the wave pattern. The wave profiles along x- and y-axes show a smooth wavy structure. In the middle of the surface, where the counter-moving travelling waves reinforce each other to form a standing wave, we see an increase in the wave amplitude as indicated by the wave amplitude in greyscale units.
Tilted circular pattern for d = 50 mm, f = 55 Hz under 2-D vibrations with ϕ ≈ 180°. The red dashed line shows the axis of tilt/rotation. The wave profile for the greyscale image is shown in the x and y directions along the centreline.

When different frequencies of vibrations are applied to the two axes, a complex broken-spiral-type pattern is formed. Interestingly, in figure 18(a), it is observed that when the frequencies of the two axes are very close to each other (here 200 and 165 Hz for x- and y-axes, respectively), a complete spiral is still formed, similar to the case when the excitation frequencies of both axes are identical.
Patterns formed with the application of different frequencies applied on the lateral axes: (a) d = 15 mm, f = 200 Hz (x-axis), 165 Hz (y-axis); (b) d = 15 mm, f = 333 Hz (x-axis), 200 Hz (y-axis); (c) d = 50 mm, f = 333 Hz (x-axis), 165 Hz (y-axis).

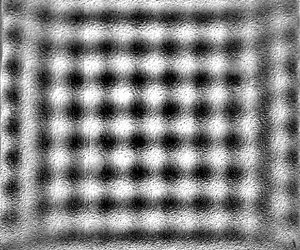
For a square substrate under 2-D vibrations with a phase difference ϕ ≈ 0° or 180°, a square pattern of standing waves was formed. The travelling waves moved towards the centre from all edges and superposed to form a standing square pattern. The equations of such waves coming from all four edges of the substrate are written as follows, where the first two waves move in the x direction, in positive and negative directions, respectively, and the following two waves in the y direction, again in positive and negative directions:
 \begin{gather}{\eta _1}(x,t) = \varepsilon \sin \,(kx - \omega t),\end{gather}
 \begin{gather}{\eta _2}(x,t) = \varepsilon \sin \,(kx + \omega t),\end{gather}
 \begin{gather}{\eta _3}(y,t) = \varepsilon \sin \,(ky - \omega t),\end{gather}
 \begin{gather}{\eta _4}(y,t) = \varepsilon \sin \,(ky + \omega t).\end{gather}
The superposition of these waves results in
 \begin{equation}\eta = 2\varepsilon (\cos \omega t)[\sin (kx) + \sin (ky)].\end{equation}
The equation of the resultant wave is a separable function of space and time. Thus, a standing pattern with wavenumber of k in the x and y directions is formed, which moves up and down in time with a frequency of  $f = 2{\rm \pi} /\omega $, which is equal to the excitation frequency. Figure 19 shows such a square pattern where f = 55 Hz was applied on both lateral axes, simultaneously. The corresponding movie for this case is given as supplementary movie 3.
Square pattern and wave profiles in the x and y directions passing through mid-plane (marked by dashed lines in greyscale image) for square substrate (s = 25 mm) excited by 2-D vibrations at f = 55 Hz on both x- and y-axes. This pattern was observed for a phase lag of ϕ ≈ 0° and 180° between the two excitations. Supplementary movie 3 provides additional insight.

Within a few milliseconds after switching on the vibrator, a square pattern is completely formed. The bright and dark regions denote the crests and troughs, respectively. A square pattern can be seen in which a trough (dark region) is surrounded by four crests (bright regions). At mid-cycle, the positions of all the crests and troughs are swapped, i.e. due to up and down motion, a crest becomes a trough and vice versa, while maintaining the square pattern. The instantaneous surface profiles, passing through the mid-plane, are also shown for the x and y directions. It is evident from the wave profiles that the wavelengths (λ) along both axes are similar. The complete spatiotemporal evolution of a cycle alongside the instantaneous profiles for a square pattern is detailed in appendix C (figure 27).
For ϕ ≈ 90°, a line pattern switching from one axis to another during the cycle was formed. Figure 20 shows the spatiotemporal evolution of the said pattern (f = 55 Hz applied along both axes). The first image at t = 0 ms marks the beginning of the cycle and a horizontal line pattern is seen. The surface profiles (x and y) at each instantaneous moment provide further details of the line pattern. These wave profiles are generated for the mid-plane passing along the x and y directions. It can be observed that at t = 0 ms, the x-axis profile merely shows a noise signal confirming the absence of a regular wave structure along this direction, whereas the y-axis profile shows the sinusoidal pattern (line pattern). The same can be observed through wave profiles for the rest of the instantaneous snapshots. At t = 4.5 ms, the horizontal line pattern switches to a vertical line pattern. At t = 9 ms, again the line pattern becomes parallel to the horizontal axis. Now we see that the crests and troughs have interchanged with respect to t = 0 ms. At t = 13.5 ms, the switching towards the vertical axis takes place again with crests and troughs swapped with respect to t = 9 ms. At t = 18 ms (not shown in the figure), the same pattern as for t = 0 ms is regained and the cycle is complete. In between switching from one line pattern to another, momentarily a square pattern was also formed only at the middle of the substrate. The frequency of the oscillations of these standing and transitioning lines was the same as that of the excitation. During one complete cycle, line switching from one axis to another occurred four times. The wave field during the transitioning period (line switching) is shown in detail from t = 0 to 4.5 ms in appendix C (figure 28) alongside the wave profiles. The dynamic motion and transitioning of the line pattern from one axis to another can find a potential application in creating liquid metamaterials with tunable properties as recently reported by Francois et al. (Reference Francois, Xia, Punzmann, Fontana and Shats2017). These metamaterials can be created by guiding matter into spatial structures through the movement of the wave field.
Several snapshots of the spatiotemporal evolution of the line pattern switching from one axis to the other at f = 55 Hz (along both axes) for ϕ ≈ 90° and s = 25 mm. The surface profiles are extracted for mid-plane (shown by dashed lines in t = 0 ms). In the surface profiles, the abscissa represents the distance along the mid-plane from left to right (x-axis profile) and top to bottom (y-axis profile) while the ordinate depicts the greyscale unit. Supplementary movie 4 and figure 28 of appendix C provide additional insight.

In figures 19 and 20, while excitation frequencies are identical on both axes, a different pattern emerges only due to a 90° change in the phases of the applied excitations between the two axes, where a standing square pattern (figure 19) is shifted to switching line pattern (figure 20). It is important to mention that classic squares have been reported commonly in Faraday experiments for vertical vibrations (Douady & Fauve Reference Douady and Fauve1988; Douady Reference Douady1990), similar to patterns of figure 19. However, to the best of our knowledge, this is the first time that such square and spiral patterns (figure 16) with horizontal vibrations (2-D) and axis switching (figure 20) are reported. It is interesting to note that the mechanisms that generate instability on the free surface in both cases, horizontal and vertical vibrations, are entirely different. As stated previously, vertical vibrations affect the gravitational acceleration and hydrostatic pressure gradient, while horizontal vibrations cause a shear flow phenomenon along the axes of vibrations. In our understanding, once instability develops on the free surface of the liquid in the form of waves, it is the interaction and superposition of the waves that appear in the shape of different patterns especially for the vertical vibrations. The similar pattern formation also indicates that in vertical vibrations, although the container moves up and down, the liquid free surface may be moving laterally as well (sloshing), and thus developing counter-propagating travelling waves which meet and reinforce in such a way to produce a square pattern or a spiral. The excitation amplitude and frequency of the vertical vibrations also directly affect the motion and strength of the waves which are the primary driver for differently shaped patterns.
Other patterns that were observed for various geometries under 2-D vibrations are shown in figure 21. For the triangular substrate, application of 2-D excitations along x- and y-axes induced waves from every side of the triangle. The waves then travelled from all boundaries towards the centre and a triangular pattern was formed by the superposition of the travelling waves (figure 21a). For the elliptical substrate, an S-shaped pattern and a pattern with alternating crests and troughs were formed for the phase difference ϕ ≈ 0° (figure 21b) and ϕ ≈ 90° (figure 21c), respectively. For the stadium geometry, a swirling motion emerged from the two semicircular portions of the substrate. In the rectangular portion, a line pattern was formed. In figure 21(d), two swirls are present on the top and bottom side of the substrate. The swirl and line patterns then interact forming combined patterns at some areas of the stadium.
(a) Triangular pattern for s = 20 mm, f = 200 Hz and ϕ ≈ 0°. (b) S-shaped pattern for a = 40 mm, b = 20 mm, f = 100 Hz and ϕ ≈ 0°. (c) Pattern with alternating crests and troughs for a = 20 mm, b = 10 mm, f = 100 Hz and ϕ ≈ 90°. (d) Swirling pattern for stadium geometry for f = 165 Hz and ϕ ≈ 0°. Supplementary movie 5 provides additional insight for (d).

In a recent study (Sanli, Lohse & van der Meer Reference Sanlı, Lohse and van der Meer2014), self-organization was observed for small hydrophilic spherical floaters – slightly denser than water – on a standing square pattern in a Faraday experiment. For low concentrations, i.e. small amount of floaters on the surface, these floaters assembled themselves around the anti-nodes, while at higher concentrations the accumulation started around the nodal lines. Given the new patterns reported in the current study, it would be interesting to observe such self-assembly of floaters especially on the line-switching and alternating crest and trough pattern, among others.
3.4. Ultrasonic vibrations
As mentioned in § 2, ultrasonic horizontal vibrations were used in the frequency range 20–170 kHz, i.e. of the order of 104 Hz and higher, much larger than the low frequencies used in the previous discussions (§§ 3.1–3.3). For frequencies of 20, 40 and 68 kHz, we observed that the travelling waves produced on the liquid film surface, for all geometries, had nearly the same frequency of 250 Hz (order of ∼102 Hz). For 170 kHz, no waves were detected and the film surface remained stable. Stability of the film at 170 kHz is attributed to the very low amplitude of excitations created at this high frequency, since at a given input power to the ultrasonic transducer, the amplitude decreases with an increase in the frequency. In addition, the impedance mismatch between the ultrasonic transducer and the liquid film increases with an increase in the excitation frequency; therefore, the ultrasonic radiation cannot effectively transmit into the liquid film (Gholampour et al. Reference Gholampour, Brian and Eslamian2018) and a larger portion of it will be reflected.
The frequency of the surface waves (∼102 Hz) generated on the liquid film through ultrasonic excitation (∼104 Hz) is not harmonic, unlike the low-frequency vibrations. It is pertinent to note that such a response has also been reported for very-high-frequency surface acoustic waves imposed on a sessile droplet (Qi, Yeo & Friend Reference Qi, Yeo and Friend2008; Tan et al. Reference Tan, Friend, Matar and Yeo2010). The applied surface acoustic wave frequency was of the order of ∼106–107 Hz, while the free surface of the droplet undulated with capillary waves having frequency ∼102–103 Hz, several orders of magnitude lower than the excitation frequency. It is clear from our experimental observations, the work of Rahimzadeh et al. (Reference Rahimzadeh, Ahmadian-Yazdi and Eslamian2018) and the surface-acoustic-wave-driven experiments mentioned above that the response of the free surface under high-frequency vibrations is far from being harmonic or even subharmonic. We explain this frequency mismatch in the context of the forces acting on these capillary waves.
The forces acting upon the fluid due to the surface tension, viscosity and inertia can be scaled as follows:
 \[\textrm{Capillary}\;\textrm{force}\sim \sigma L,\]
 \[\textrm{Viscous}\;\textrm{force}\sim \frac{{\mu {L^2}}}{t},\]
 \[\textrm{Inertia}\;\textrm{force}\sim \frac{{\rho {L^4}}}{{{t^2}}},\]
where the surface tension (σ) is scaled with the characteristic length (L) and the dynamic viscosity (μ) is scaled with the characteristic time (t). On the liquid surface, the surface tension force is the main cause of the formation of the capillary waves, which should be balanced by either or both of the other two forces. Yeo et al. (Reference Yeo, Lastochkin, Wang and Chang2004) have suggested different characteristic capillary resonant frequencies  $(\,f_r)$ depending upon the balance between the capillary forces with either the viscous damping or the inertia force. By equating the capillary and viscous forces, one obtains
 \begin{equation}{f_r}\sim \frac{\sigma }{{\mu L}},\end{equation}
whereas, by equating the capillary and inertia forces, one gets
 \begin{equation}{f_r}\sim \sqrt {\frac{\sigma }{{\rho {L^3}}}} .\end{equation}
Equations (3.10) and (3.11) represent a characteristic resonant frequency (s−1) based on a balance between the capillary and viscous forces and between the capillary and inertia forces, respectively. Employing an order-of-magnitude analysis for the current case, we find the corresponding resonant frequencies. For a water film,  $\mu \sim {10^{ - 3}}\;\textrm{Pa}\,\textrm{s}$, surface tension
 $\sigma \sim {10^{ - 2}}\;\textrm{N}\,{\textrm{m}^{ - 1}}$ and density
 $\rho \sim {10^3}\;\textrm{kg}\,{\textrm{m}^{ - 3}}$. The wavelength, surface curvature or film thickness may be considered as reasonable candidates for the characteristic length of the problem at hand, where all these lengths are comparable, thus
 $L\sim {10^{ - 3}}\;\textrm{m}$. From (3.10), the capillary–viscous resonant frequency
 ${f_r}\sim {10^4}\;\textrm{Hz}$, while from (3.11), the capillary–inertia resonant frequency
 ${f_r}\sim {10^2}\;\textrm{Hz}$. Our experimental results for the capillary wave frequency are in line with (3.11), implying that the free-surface waves are formed by a balance between the capillary forces and the inertia of the fluid, as indeed expected. This is because of the low viscosity of water and the fact that on the free surface a potential flow approximation pertains. The thickness of the viscous boundary layer as obtained from the Stokes second problem,
 $\; {\delta _l}\sim \sqrt {\mu /2{\rm \pi} \rho f}$, where f is the frequency of vibration, can provide a better estimate of the effect of the viscous forces on the liquid film surface. For the ultrasonic frequencies used in this work,
 ${\delta _l}$ is of the order of 1 μm, suggesting that the major part of the liquid film remains outside the Stokes boundary layer, and can be considered as a potential flow region (inviscid).
The above discussion and results elucidate the varied response of the free-surface waves for low-frequency horizontal vibrations and ultrasonic excitations, one being harmonic and the other several orders of magnitude lower than the excitation frequency, respectively. With our current experimental set-up and vibration devices, we were not able to find the conditions at which this transition of the responses takes place. However, it is an open question and it would be interesting to determine the threshold frequency where the capillary waves atop the free surface start behaving non-harmonically from low-frequency to high-frequency regime.
For ultrasonic frequencies, the pattern formation by the surface waves was also quite different from that for the low-frequency vibrations. In §§ 3.2 and 3.3, we noted that the waves produced in those cases were parallel along the boundary edges and consequently the patterns formed out of such waves were regular in nature. For ultrasonic vibrations, we find that although the waves form along the substrate boundaries, the amplitude of the waves is not equal in a particular region of space. This difference in wave intensity is supposedly due to the way that ultrasonic vibrations are (unevenly) transmitted to the film and the turbulence created by the high-frequency excitations that cause uneven patterns to form on the film surface.
Figure 22 shows three different patterns formed on a circular substrate with d = 50 mm at three frequencies. Horizontal ultrasonic vibrations were applied in the direction of the x-axis only. For f = 20 kHz, we find that the strength or amplitude of the surface waves is higher along three lines or regions. The regions with high-amplitude waves are darker in greyscale in comparison to the other parts. Around these lines or regions, waves are still present but in a diminished form. The standing waves are formed in the middle of the film surface by interference of these travelling waves. For f = 40 kHz, we see that the waves are again strong in certain areas. Near the centre, a pentagon-shaped pattern of standing waves is formed. Similar formation of patterns and travelling waves are seen for f = 68 kHz. However, at this frequency, we can clearly see that the intensity of the waves (even for the regions where it is the highest) is lower than the intensity of the 20 and 40 kHz cases. This gradual decrease in the wave amplitude with increasing excitation frequency and then the complete disappearance of waves at f = 170 kHz agree with the fact that the amplitude of excitation decreases with frequency (Gholampour et al. Reference Gholampour, Brian and Eslamian2018).
Travelling and standing waves for the large circular substrate (d = 50 mm) at three different frequencies. The regions (lines) where the greyscale image is darker indicate strong waves due to the irregular distribution of ultrasonic energy. The arrows point to the standing waves surrounded by the travelling waves. Horizontal ultrasonic vibrations were applied in the direction of the x-axis. Supplementary movie 6 provides additional insight for 20 kHz.

Similar uneven transmission of vibration energy was seen when a small substrate was used. A representative circular case (d = 15 mm) at f = 40 kHz is shown in figure 23. The wave profiles are shown along the centreline in both axes. Along the x-axis, we see that from the left side to the centre of the substrate, the waves are weak (low amplitude). The amplitude of standing waves in the middle becomes higher due to the interference of waves coming from different directions. On the right side of the centre, the waves have higher amplitude as compared to the left side. Following the centreline along the y-axis shows that, below the centre, the waves have high amplitude and as we move towards the upper half of the circle, waves are present in an attenuated form. As discussed above, variations in the wave amplitude may be attributed to the uneven transmission of the ultrasonic energy from the transducer to the film, as well as to the interaction between the induced waves in a chaotic manner, due to the turbulent nature of the fluid motion. A high-precision ultrasonic vibration generator might provide a more uniform pattern.
Pattern formed on the circle with d = 15 mm at f = 40 kHz and the surface profiles along the x and y directions. The abscissa is the location along the circle (passing through the mid-plane as shown by the dashed line in greyscale image) and the ordinate is the wave amplitude in greyscale units. Horizontal ultrasonic vibrations were applied in the direction of the x-axis.

For the square substrate subjected to horizontal ultrasonic vibration along the x-axis at f = 40 kHz (figure 24), simultaneous lines (on the sides) and squares (in the middle) on the film surface were observed. The square pattern formed in the centre is due to the interference of the waves parallel to the x- and y-axes and is present only at a certain region in space, where both original waves are strong enough. The lines are travelling in nature, while the square pattern moves up and down with time (transient standing wave). The wave profiles in figure 24 represent the wave amplitude in arbitrary greyscale units. Along the x-axis, the wave amplitude is slightly higher on the boundary edges and decreases gradually when the waves move towards the centre. Along the y-axis, we see that the waves have high amplitude near the top edge of the substrate and the amplitude gradually decreases as the wave moves towards the bottom side. The profile is somewhat distorted at the top edge due to the reflection from the high-intensity light used during the experiments.
Travelling and standing patterns on a square substrate (s = 25 mm) at f = 40 kHz horizontal vibration along the x-axis, where simultaneous line and square patterns are observed. The wave profile along the x-axis shows a smooth wavy structure with slightly increased amplitude near the edges while along the y-axis, high wave amplitude is seen on the upper half of the film surface.

On a triangular substrate, complex interactions of travelling waves take place resisting the formation of any specific pattern in a close-up view. However, a careful observation suggested the presence of a hexagonal pattern in the long shot, as shown in figure 25. In low-frequency cases for the triangular substrate (figures 10 and 21), we saw diamond- and triangular-shaped patterns with smooth waves following the line of the substrate edges. With ultrasonic vibrations, the waves are more chaotic and intense in specific areas thus yielding a travelling hexagonal pattern in the long shot.
Hexagonal pattern observed in the long shot for triangular substrates with s = 40 mm. For f = 68 kHz, we have shown one such hexagon with red dashed lines. In all cases, horizontal ultrasonic vibrations were applied in the direction of the x-axis only.

Finally, table 4 summarizes the various patterns reported in this study (1-D and 2-D horizontal vibrations) with a brief description alongside the conditions under which they are formed.
Summary of the observed patterns formed on the liquid surface subjected to 1-D or 2-D horizontal vibrations. In the descriptions, substrate size, i.e. ‘small’ or ‘large’, depends on the vibration characteristics.

4. Conclusion
In this work, we have experimentally studied the response of a liquid film under the effect of low-frequency (55–333 Hz) multi-axis (x and y) horizontal vibrations. To have a close approximation with the ideal theoretical case that considers a film of infinite lateral length, plain glass substrates without physical walls were used. The ‘soft walls’ were formed or created by the liquid contact lines pinned to the edges of the substrates. It was found that different geometrical shapes of the substrate and the path followed by the vibrating device play a significant role in determining the pattern formed on the surface. The path of the vibrating plate and subsequently of the liquid film was dependent upon the phase angle ϕ between the two simultaneously vibrating axes. Ultrasonic horizontal vibration, with frequencies ranging between 20 and 170 kHz, was also applied on the liquid film to study the characteristics of the induced surface waves and patterns. It was observed that low-frequency excitations (∼100 Hz) produce harmonic surface waves and patterns. However, in the ultrasonic frequency range (∼40 kHz), the surface waves do not behave harmonically and the observed frequency of the waves (∼102 Hz) is far lower than the excitation frequency. Subharmonic cross-waves that are common in rectangular channels were not observed in our experiments. In addition, we observed, analysed and explained the formation of both travelling and standing waves and patterns in multiple geometries. As another previously unreported phenomenon, we described line pattern switching on a square substrate, subjected to 2-D horizontal vibrations with a phase difference of 90°.
A summary of our observations is given in table 4. For a square substrate under multi-axis lateral oscillations, a perfect standing square pattern was observed similar to the classic squares reported in Faraday experiments for vertical vibrations (e.g. Douady & Fauve Reference Douady and Fauve1988; Douady Reference Douady1990). Further, circular and spiral-like patterns were also observed in single- and multi-axis excitations, respectively, which were reported in Edwards & Fauve (Reference Edwards and Fauve1994) for vertical vibrations as well. Similar formation of patterns from two mechanisms having entirely different physics can shed light on the complexities of the problem. Other patterns reported in this study include lines, diamonds, pentagons, triangles and long-range hexagons.
This study was limited to pinned liquid films subjected to 1-D and 2-D horizontal vibrations. For future work, the stability behaviour and pattern formation of pinned liquid films under mild vertical vibrations would also be of interest given all the experimental work on vertical vibrations performed previously for fluids bounded in containers having physical walls. It can be expected, in the light of the current work, that the pinned liquid film will be closer to the theoretical (unbounded film) vertical vibration case, as well. In addition, the idea of combined excitations using two lateral axes (x and y), employed in this study, can be extended to combined excitations of normal and lateral axes to explore the pattern formation in such a setting. Finally, the response of liquid films and droplets to ultrasonic vibrations is quite complex and deserves additional experimental and theoretical studies.
Acknowledgements
The authors acknowledge financial support from the Shanghai Municipal Education Commission via the Oriental Scholar fund and the funding from the National Natural Science Foundation of China (NSFC). T.K. acknowledges financial support in the form of a scholarship from the Higher Education Commission (HEC), Pakistan. The authors also thank Dr A. Rahimzadeh and D. Brian for their contribution in setting up the vibration system.
Declaration of interests
The authors report no conflict of interest.
Supplementary movies
Supplementary movies are available at https://doi.org/10.1017/jfm.2020.468. See supplementary material for six movies showing the wave formation on the liquid film. Movie 1 is for an elliptical substrate (a = 20 mm, b = 10 mm) under 1-D vibration (f = 200 Hz). Movie 2 shows the spiral pattern in a circular substrate (d = 50 mm, f = 165 Hz, ϕ ≈ 90°). Movie 3 shows the standing square pattern in a square substrate (s = 25 mm, f = 55 Hz, ϕ ≈ 0°). Movie 4 shows the line switching pattern in a square substrate (s = 25 mm, f = 55 Hz, ϕ ≈ 90°). Movie 5 is for the stadium-shaped substrate showing a swirl pattern (f = 165 Hz, and ϕ ≈ 0°). Movie 6 is for the ultrasonic vibrations at 20 kHz.
Appendix A. Theory of pinned liquid film subjected to horizontal vibrations
Considering the 2-D framework, the continuity and Navier–Stokes equations are given as follows:
 \begin{gather}{\partial _x}u + {\partial _z}w = 0,\end{gather}
 \begin{gather}\rho ({\partial _t}u + u{\partial _x}u + w{\partial _z}u) ={-} {\partial _x}p + \mu {\nabla ^2}u,\end{gather}
 \begin{gather}\rho ({\partial _t}w + u{\partial _x}w + w{\partial _z}w) ={-} {\partial _z}p + \mu {\nabla ^2}w + \rho g,\end{gather}
where u and w are the liquid velocity in x and z directions, respectively, p is the pressure,  ${\nabla ^2}$ is the Laplacian and g is the gravitational acceleration in the z direction. The substrate is vibrated in the horizontal direction only, and therefore the velocity components at
 $z = 0$ are written as follows:
 \begin{equation}u = a\omega \cos (\omega t),\quad w = 0,\end{equation}
where a is the vibration amplitude and  $\omega $ is the angular frequency (rad s−1). At the interface,
 $z = h(x,t)$, and the fluid velocity is written as follows, known as the kinematic boundary condition:
 \begin{equation}w = {\partial _t}h\; + \; u{\partial _x}h.\end{equation}
The dynamic boundary condition, which is a force balance on the interface, is written as follows:
 \begin{equation}\boldsymbol{\mathsf{T}}\boldsymbol{\cdot }\boldsymbol{n} ={-} c\sigma \boldsymbol{n} + \frac{{\partial \sigma }}{{\partial r}}\boldsymbol{t} + \boldsymbol{f},\end{equation}
where T is the stress tensor,  $\boldsymbol{n}$ is the outward pointing unit normal vector,
 $\boldsymbol{t}$ is the tangential unit vector, c is the mean curvature of the interface, r is arc length along the interface and
 $\boldsymbol{f}$ is the force at the interface having two components
 $\boldsymbol{\tau }$ (tangential) and
 $\boldsymbol{\varPi}$ (normal).
The variables are grouped to create the following dimensionless parameters for further analysis:
 \[\begin{array}{l} X = \dfrac{x}{l},\quad Z = \dfrac{z}{{{h_o}}},\quad U = \dfrac{u}{{{U_o}}},\quad W = \dfrac{w}{{\delta {U_o}}},\\ T = \dfrac{{{U_o}t}}{l},\quad G = \dfrac{{\rho {h_o}^2\delta g}}{{\mu {U_o}}},\quad P = \dfrac{{\delta {h_o}p}}{{\mu {U_o}}},\quad ({\boldsymbol{\tau }_{\boldsymbol{o}}},{\boldsymbol{\varPi}_{\boldsymbol{o}}}) = \dfrac{{{h_o}}}{{\mu {U_o}}}(\boldsymbol{\tau },\delta \boldsymbol{\varPi}), \end{array}\]
where l is the lateral length of the liquid film,  ${h_o}$ is the mean film thickness,
 ${U_o}$ is a characteristic velocity in the horizontal direction and
 $\delta = {h_o}/l$. With the above scaling variables, we arrive at the following dimensionless governing equations:
 \begin{gather}{\partial _X}U + {\partial _Z}W = 0,\end{gather}
 \begin{gather}\delta Re({\partial _T}U + U{\partial _X}U + W{\partial _Z}U) ={-} {\partial _X}P + {\partial ^2}_ZU + {\delta ^2}{\partial ^2}_XU,\end{gather}
 \begin{gather}{\delta ^3}Re({\partial _T}W + U{\partial _X}W + W{\partial _Z}W) ={-} {\partial _Z}P + {\delta ^2}({\partial ^2}_ZW + {\delta ^2}{\partial ^2}_XW) + G.\end{gather}
The boundary conditions take the following form:
At  $Z = 0$,
 \begin{equation}U = A\varOmega \cos (\varOmega T),\quad W = 0.\end{equation}
At  $Z = h(x,t)$,
 \begin{gather}W = {\partial _T}H+ U{\partial _X}H,\end{gather}
 \begin{gather}\begin{array}{ccccc} & ({\partial _Z}U + {\delta ^2}{\partial _X}W)[1 - {\delta ^2}{({\partial _X}H)^2}] - 4{\delta ^2}({\partial _X}H)({\partial _X}U)\\ & \quad = {\tau _o}[1 + {\delta ^2}{({\partial _X}H)^2}] + {\partial _X}\Sigma \sqrt {[1 + {\delta ^2}{{({\partial _X}H)}^2}]} \; , \end{array}\end{gather}
 \begin{gather}\begin{array}{ccccc} & - P - {{\varPi}_o} + \dfrac{{2{\delta ^2}}}{{1 + {\delta ^2}{{({\partial _X}H)}^2}}}[{\partial _X}U({\delta ^2}{({\partial _X}H)^2} - 1) - {\partial _X}H({\partial _Z}U + {\delta ^2}{\partial _X}W)]\\ & \quad = \dfrac{{{C^{ - 1}}{\delta ^3}\dfrac{{{\partial ^2}H}}{{\partial {X^2}}}}}{\sqrt[\frac{3}{2}]{1 + {\delta ^2}{{({{\partial_X}H})}^{2}}}}, \end{array}\end{gather}
where
 \[A = \frac{{a\omega }}{{{h_o}}},\quad \varOmega = \frac{{\omega {h_o}}}{{\delta {U_o}}},\quad H = \frac{h}{{{h_o}}},\quad \varSigma = \frac{{\delta \sigma }}{{\mu {U_o}}},\quad Re = \frac{{{U_o}{h_o}}}{\nu },\quad C = \frac{{\mu {U_o}}}{\sigma }.\]
For the case of infinite lateral length of the fluid, periodic boundary conditions are assumed along the horizontal direction (e.g. Or Reference Or1997). For a pinned liquid film, at the pinned contact lines  $x ={\pm} L$, as shown in figure 1, we have
 \begin{equation}H = 0.\end{equation}
Likewise, we impose the contact angle condition in the following form:
 \begin{equation}{\partial _X}H({\pm} L,T) ={\mp} \tan \theta .\end{equation}
Equations (A 6)–(A 12) govern the motion of a 2-D pinned liquid film subjected to horizontal vibrations along the x-axis. Although it includes the parameter  $\delta $ through scaling, the above equations are applicable to arbitrary
 $\delta $ and contain the subset of the relevant nonlinear effects. Using the lubrication approximation – assuming
 $\delta \;\textrm{and}\;Re$ small – these governing equations can be linearized and solved numerically, performing the Floquet linear analysis, e.g. by employing a fourth-order Runge–Kutta scheme (Bestehorn Reference Bestehorn2013).
With the linear Floquet analysis, using the lubrication approximation, the instability criteria based on the amplitude and frequency of the lateral vibrations for the free surface could be established. Likewise, in the nonlinear regime, by solving the Navier–Stokes equations, it is desirable to compute the pattern formation numerically for a pinned liquid film case, as future work. The pinned contact line case has, to the best of our knowledge, not been studied numerically in this particular context.
Appendix B. Measurement of the wave amplitude
For measuring the wave amplitude, two side-view images, from the same cycle, were taken in which the waves were present at their extreme positions as shown in figure 26(a). A specific anti-node on the wave is highlighted with the red arrow showing a crest and a trough in the two images. The raw images were converted to binary images (figure 26b) to have a precise shape of waves. The two binary images were then subtracted from each other to generate an image shown in figure 26(c). The distance between the maximum and minimum points as shown in figure 26(d) was measured, where one half of this distance yields the wave amplitude. The image resolution of this camera used for side-view imaging is 1 pixel ≈ 5 μm in the xz plane, so the uncertainty in values of wave amplitude is ±2.5 μm. The typical measured amplitudes of the wave varied from 30 to 100 μm.
(a) Side-view images of the top part of a given film during a cycle showing peaks and valleys indicated by arrows. (b) Raw images were converted to binary (black-and-white) images to help find the oscillation amplitude with better accuracy. (c) Greyscale image as obtained from the binary images. (d) Half of the peak-to-valley distance yields the wave amplitude. Such measurements were conducted over at least three wavelengths and were averaged out.

For some of the single-axis (1-D) vibration cases (square and circle), calibration of the arbitrary greyscale units of the surface plot of the top view was also done against the surface wave amplitude as obtained from the side-view images. The wave amplitude values at certain specific points along the length were compared with the greyscale values and an average was taken to minimize the uncertainty. A scaling factor was obtained that related the greyscale unit with the wave amplitude.
Appendix C. Spatiotemporal evolution of representative patterns
Figure 27 shows the evolution of a standing square pattern that moves up and down with the same frequency as the excitation frequency. A square substrate with s = 25 mm was forced horizontally along the x- and y-axes at f = 55 Hz with ϕ ≈ 0°. The shown images were taken after the initial disturbances created by the starting motion of the vibrator had subsided. The start of a certain cycle is shown as time t = 0 ms. The surface profile along the x-axis passing through the mid-plane is also provided at each instant. At t = 0 ms, we observe that the surface is smooth and without any pattern. At t = 0.5 ms, the square pattern emerges. During t = 0.5–4 ms, the pattern amplitude increases as is visible from the images and the profiles. The bright and dark regions indicate the crests and troughs, respectively. After t = 5 ms, the pattern amplitude decreases and at t = 9 ms, we see that the surface momentarily smoothens out. This is also corroborated by the signal from the surface profile that shows an almost straight line at this instant. At t = 9.5 ms, the pattern emerges again with the crests and troughs changing their positions, i.e. at a certain spatial location, a crest has been replaced by a trough. This is also observed through the surface profiles. The pattern grows in amplitude until t = 13–14 ms, after which it again starts to decrease and at t = 18 ms, the cycle completes, and a new cycle begins. It is evident that the frequency of the standing pattern is the same as the excitation frequency  $(\,f_{standing} = 1/0.018\;\textrm{s} = 55\;\textrm{Hz)}$.
Spatiotemporal evolution of a harmonic square pattern at f = 55 Hz, ϕ ≈ 0° for a square substrate with s = 25 mm. The shown images are 21 × 21 mm2 in size (∼2 mm cropped from each side). The graphs show the surface profile along the x-axis passing through the mid-plane. The abscissa shows the length (mm) in the x direction, while the ordinate represents the wave amplitude in arbitrary greyscale units. At t = 0, the cycle starts with a rather smooth surface. During t = 0.5–4 ms, the amplitude of the standing pattern increases. At t = 5 ms, it reaches a maximum. During t = 5–8.5 ms, it starts to diminish. At t = 9 ms, the crests and troughs get aligned and the surface smoothens momentarily. From t = 9.5 ms, the pattern re-emerges but now the crests are replaced by troughs which can be seen in the instantaneous images and their surface profiles. At t = 18 ms, the cycle ends.

Wave field and x and y surface profile during the line transitioning from one axis to another as shown in figure 20. Momentarily a square pattern can be observed at t = 2–3 ms. In the surface profiles, the abscissa shows the distance along the mid-plane from left to right (x-axis profile) and top to bottom (y-axis profile) while the ordinate depicts the greyscale unit.



