Introduction
In a time of austerity and low economic growth, the challenges faced by low-waged workers to earn enough to support themselves and their families and to achieve a socially acceptable standard of living are immense. Identifying effective and sustainable pathways out of in-work poverty for these workers holds significant benefit for the workers, their families and the state. However, for employers facing increasing expectations to view their employees’ wage through a lens of social responsibility, rather than through productivity or market comparisons, this can amount to another significant cost pressure to be set against a general background of competing wage demands throughout the organisation's workforce. Understanding how effective different anti-poverty measures actually are for workers, and how sustainable they are as long-term measures to be engaged with by employers, is therefore crucial to the in-work poverty policy debate – a debate that is increasingly urgent when recent UK figures (DWP, 2016) show that in-work poverty is increasing faster than poverty in workless households.
In 2013, three large employers in the City of York became Voluntary Living Wage (VLW) employers. They were the City of York Council (CYC), Joseph Rowntree Foundation/Joseph Rowntree Housing Trust (JRF/JRHT) and York St John University (YSJU). It is notable that all three are public or voluntary sector organisations, while private sector employees have a higher risk of low pay (Cooke and Lawton, Reference Cooke and Lawton2008). However, other York employers subsequently also became VLW employers, including the private companies Nestlé and Aviva. It was decided that this was a good opportunity to undertake research on the impact of the VLW on poverty, and funding was obtained from the Economic and Social Research Council (ESRC) under their Knowledge Exchange Programme.
The research project included (i) a survey of a small sample of JRF/JRHT employees before the living wage was introduced; (ii) a structured sample survey of 500 employees after the living wage was introduced. Two-fifths of these were newly on the VLW and the rest, a comparator group, were other low-paid employees earning up to £10 per hour; (iii) a follow-up qualitative survey of a sub-sample of employees who had received a wage increase as a result of the introduction of the living wage; (iv) a benefits assessment undertaken by a welfare rights specialist at the York Welfare Benefits Unit; and (v) interviews with employers and analysis of the implementation of the VLW by the three partner employers. This article is focused on the lessons that can be learned for in-work poverty and deprivation alleviation, drawing on the evidence of the qualitative and quantitative surveys.
Policy and evidence background
Hood et al. wrote, ‘Those with the lowest incomes are generally not in work at all’ (Hood et al., Reference Hood, Joyce, Phillips, Emmerson, Johnson and Miller2014: 170). UK out-of-work benefit rates for non-working households by definition mean claimant households are likely to be poor. In contrast, most people in work are not in poor households (Gardiner and Millar, Reference Gardiner and Millar2006). Eighty-nine per cent of people living in households where someone works are in not in poverty (Hood et al., Reference Hood, Joyce, Phillips, Emmerson, Johnson and Miller2014). Thus, evidence suggests, ‘There is much truth in the [then Labour] Government's claim that work is the best route out of poverty’ (Cooke and Lawton, Reference Cooke and Lawton2008: 35).
However, those in work are not immune from poverty. In 2014/15, 22 per cent of households in poverty have at least one person working full-time (DWP, 2016). The prevalence of in-work poverty has been increasing. For example, according to the Households Below Average Incomes figures (DWP, 2016), between 2007/8 and 2014/15 the percentage of children living in households with equivalent income less than 60 per cent of the median before housing costs which had at least one earning adult increased from 57 per cent to 67 per cent.
The idea that the wage should not just be compensation for labour but also a means of securing a living goes back at least to Adam Smith (Reference Smith1776). Pope Leo XIII in Rerum Novarum (1891) launched the concept of a family wage. The regulation of wages in the UK began with the Fair Wages Resolution 1891, followed by the Trade Boards Act 1909 and the Wages Councils Act 1945. Eventually, a statutory National Minimum Wage (NMW) was introduced from 1999. The term ‘living wage’ emerged amongst campaigners in the USA in the 1870s (Glickman, Reference Glickman1997), and Seebohm Rowntree called for a living wage to allow a male worker to support a wife and family (Cooke and Lawton, Reference Cooke and Lawton2008). In the UK, the modern idea of a VLW, at a rate higher than the NMW, emerged in 2001 from a campaign begun by a group of NGOs and trades unions in London (Bennett, Reference Bennett2014), who now operate under the aegis of the Living Wage Foundation.Footnote 1 The VLW was £8.25 per hour and £9.40 per hour in London in October 2015. The NMW was £6.70 per hour at the same time. The VLW is a voluntary hourly rate, set independently, and updated annually according to the basic cost of living published by the Minimum Income Standard project (though it is now calculated for London by the Living Wage Commission for London). Employers choose to pay the VLW, and, in exchange, can receive the Living Wage Employer Mark – an ethical badge for responsible pay, if they apply for accreditation.
Initially, after its introduction, the NMW was uprated ahead of median wages, but after 2008 fell back in real terms (Cooke and Lawton, Reference Cooke and Lawton2008; Hood et al., Reference Hood, Joyce, Phillips, Emmerson, Johnson and Miller2014). In the summer budget in 2015, the Chancellor announced that he would raise the NMW for those aged twenty-five and over to £7.20 per hour in April 2016 and to the equivalent of 60 per cent of median earnings or £9 per hour in 2020. The Labour Party has now promised a NMW of £10 per hour by 2020. In some ways, this is a notable achievement for the Living Wage Foundation, and the research on budget standards which showed that the NMW did not meet the Minimum Income Standard (Hirsch, Reference Hirsch2015).
The Chancellor's higher minimum wage was labelled as a National Living Wage (NLW). This is confusing because the rate is not based on the same methodology as the VLW. It will give welcome help, especially for single people and childless couples, towards reaching a higher living standard than the NMW has achieved. However, the announcement was associated with a freeze in benefit levels and cuts to Universal Credit, and a new earnings floor within that for the self-employed (which assumes that they are earning the NLW). The Resolution Foundation estimate that average losses in 2020 will be £1,000 per year per household, and £1,300 for families with children, and that the distributional consequences are heavily regressive (Whittaker, Reference Whittaker2015). Recent projections by the Institute for Fiscal Studies indicate that child poverty will increase by as much as 1.3 million by 2020/21 (Brown and Hood, Reference Brown and Hood2016).
The main justification for the NLW is, like the justification for the NMW, that it can raise living standards for the workers that receive it, including providing a route out of poverty for some of those in working poverty. Other justifications include improved self-esteem and work–life balance for employees; improvements in productivity, recruitment and retention for employers (Bennett, Reference Bennett2014); and healthier and more socially engaged citizens (Glickman, Reference Glickman1997). The Living Wage Foundation believes that paying the living wage is not just good for employees, but also ‘good for business . . . and good for society’. Commentators have said, ‘Low pay is a significant factor contributing to high levels of working poverty’ (Cooke and Lawton, Reference Cooke and Lawton2008: 26); ‘Boosting the incomes of the low paid would therefore help reduce in-work poverty’ (Hood et al., Reference Hood, Joyce, Phillips, Emmerson, Johnson and Miller2014: 150).
US studies of compulsory local ‘living wages’ showed increases in the wages of low-paid workers, small reductions in employment rates and a net effect of some reductions in overall poverty rates in the participating cities (e.g. Neumark and Adams, Reference Neumark and Adams2001). The extensive research on the NMW in the UK in the 2000s has suggested that the policy successfully reduced the prevalence of low pay and contributed to reduced poverty, while having no negative effect on employment (Cooke and Lawton, Reference Cooke and Lawton2008). However, working poverty persisted and in fact grew. Research showed that the impact varied according to the level of the NMW and the local labour market. For example, it was less effective in London, which had lower initial rates of low pay and higher wage inequality than other regions (Cooke and Lawton, Reference Cooke and Lawton2008).
The connection between working status and poverty status is complex. Bennett (Reference Bennett2014) pointed out that while there ‘certainly is some overlap’, low pay and in-work poverty are not the same thing, and do not necessarily refer to the same individuals and households. This means that targeting low-paid individuals via policy initiatives on individual pay is not a fully efficient means of targeting people in poor households. In fact, the ‘vast majority’ of low-paid people (defined as those earning less than two-thirds of the median wage) are not poor (defined as those living in households with equivalised income below 60 per cent of the median) (Gardiner and Millar, Reference Gardiner and Millar2006: 353). An important distinction is between households where a low-paid job is the main or only job and those where it is a secondary job (Hood et al., Reference Hood, Joyce, Phillips, Emmerson, Johnson and Miller2014). Low-paid workers are found in every household income decile, and are most concentrated just below average household income rather than amongst the poorest households (Hood et al., Reference Hood, Joyce, Phillips, Emmerson, Johnson and Miller2014).
In-work poverty at the household level could be due to low hourly wage rates, but it could also be due to low work intensity, with short hours or periods off work, and/or not all adults in a household being employed relative to the number of dependents, whether non-working adults or children (Luce, Reference Luce2004). It could also be due to poor coverage or poor enforcement of minimum wage rules. People on low hourly pay rates may avoid poverty through long working hours, living with others or claiming benefits (Luce, Reference Luce2004; Gardiner and Millar, Reference Gardiner and Millar2006). Analysis of the 2000/01 Labour Force Survey suggests that, in practice, the most common route out of poverty for low-paid workers was not more hours, or benefits, but living with a partner and/or others (Gardiner and Millar, Reference Gardiner and Millar2006). Low wage earners live in households, and poverty is assessed on the basis of household not individual resources. Previous studies have found considerable diversity amongst households containing low-paid workers, in their size, demography, employment status and in terms of their poverty status (Bennett, Reference Bennett2014). In developing policies to reduce in-work poverty, ‘Policymakers should be clear about whether they want to help low-paid individuals or low-paid families . . . policies that help all low-paid individuals would also help some relatively high-income families’ (Hood et al., Reference Hood, Joyce, Phillips, Emmerson, Johnson and Miller2014: 141).
Analysis of the DWP's tax benefit model tables for 2006 showed that amongst low-waged workers, ‘very few family types were able to avoid poverty through their own wages alone. The only exceptions are single, childless people working full time and smaller couple families in which both adults worked full time’ (Cooke and Lawton, Reference Cooke and Lawton2008: 45). Modelling has shown that ‘households around the middle of the income distribution [rather than the lowest end] would gain disproportionately from the living wage as lots of low earners live with others who are not necessarily low paid’ (Lawton and Pennycook, Reference Lawton and Pennycook2013: 5; also Bennett, Reference Bennett2014). However, those at the lowest end of the income distribution would gain a higher percentage of income (Hood et al., Reference Hood, Joyce, Phillips, Emmerson, Johnson and Miller2014).
The Living Wage FoundationFootnote 2 recognised this complexity when it stated, ‘The causes of poverty are complex and in order to improve lives there should be a package of solutions across policy areas. The Living Wage can be part of the solution.’ The Institute for Fiscal Studies suggested alternatives and complements to a higher NMW, including incentives to employers for higher wages such as the VLW, increased in-work benefits and changing national insurance or personal income tax allowances and rates (Hood et al., Reference Hood, Joyce, Phillips, Emmerson, Johnson and Miller2014). Researchers have also argued that a NMW could only form part of an anti-poverty strategy and needed to be complemented by other measures to increase the supply and quality of both jobs and workers (Cooke and Lawton, Reference Cooke and Lawton2008).
If policy seeks to reduce poverty, what contribution can the VLW make?
The survey
The survey was run over late spring and summer 2014 with face-to-face interviews undertaken in the respondent's home (or at the survey company's offices in York) by a professional survey company, Qa Research. The respondents invited to take part in the survey were employees of the three project partners – City of York Council (CYC), Joseph Rowntree Foundation/Joseph Rowntree Housing Trust (JRF/JRHT) and York St John University (YSJU) – earning up to £10 per hour. The total sample recruited and interviewed by the survey company produced 494 completed interviews, providing a useable sample for analysis of 491 employee interviews.
The survey questions were informed by existing national surveys of household resources, including the Family Resources Survey, Understanding Society and the Poverty and Social Exclusion Survey. The survey contained details of earnings and income from other sources, including benefits and tax credits, as well as expenditures. The themes covered in the quantitative survey (in addition to detailed standard household survey questions on composition) included employment and training (hours, wage and future career), housing, transport, fuel, water, council tax and finances (debt, savings, pensions and benefits).
The aim of the project was to understand how effective and sustainable the VLW in the context of other anti-poverty policies might be for employees at risk of in-work poverty. Clearly, not all employees eligible for or receiving the VLW are at risk of in-work poverty, nor indeed are those above this wage-rate free of risk. As a result, it was agreed to sample employees on rates of up to £10 per hour to investigate the question of in-work poverty – as the living wage adoption and any improvements that flow from this to the household resources will only affect those workers towards the bottom end of the wage distribution, whereas significant challenges may also be faced by workers slightly further up the wage distribution. This consideration is particularly relevant if the possibility of increasing the ‘wage envelope’ to improve the wages of workers (even above that of the living wage) is limited. It also enabled us to compare the circumstances of those who had benefited from the introduction of the VLW and those who were already on wages slightly above that level.
Fifty-five per cent of the CYC total directly employed workforce was paid at or below the £10 threshold: for JRF/JRHT, the figure was 72 per cent and for YSJU just 26 per cent. The difference in internal wage distribution is a function of the activity of the organisation: CYC staff include a large number of ancillary education workers; JRF/JRHT employees predominantly provide adult social care; and YSJU employs academic, administrative and ancillary staff. This demonstrates that different employers will have different proportions of employees who are potential beneficiaries of the VLW, and will face different scales of challenges in becoming VLW employers. In the case of each employer, it is important to note that the majority of those earning less than £10 per hour were female (79 per cent at CYC, 81 per cent at JRF/JRHT and 72 per cent at YSJU). Nationwide, women are at greater risk of low pay than men (Cooke and Lawton, Reference Cooke and Lawton2008; Hood et al., Reference Hood, Joyce, Phillips, Emmerson, Johnson and Miller2014), but the case studies show a more marked pattern than that seen at the national level, and suggest that the potential gendered impact on poverty from the VLW may be magnified at industry and organisational level.
In addition to the sampling by employer, the recruitment was also stratified by wage rate and job type. The survey sample was recruited by phone, email and letter by the survey company using a list of employees shared by the project partners with the survey company. The names of the employees shared with the survey company were those who had not opted out of the survey after correspondence from the employer (i.e. the approach was a survey opt-out rather than opt-in).
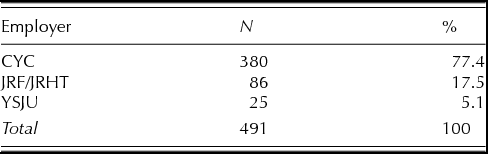
The survey sample included appropriate proportional representation of employees earning below £10 per hour from the three partner organisations. For the full population of employees (earnings at or below £10 per hour) across the three partner organisations, the proportion of CYC employees was about 86 per cent compared to 10 per cent at JRF/JRHT and 3.5 per cent at YSJU. The final sample recruited reflected closely these original population proportions, e.g. 77.4 per cent at CYC, 17.5 per cent at JRF/JRHT and 5.1 per cent at YSJU, albeit with a small degree of under-sampling from CYC (77.4 per cent versus 86 per cent). Table 1 provides a summary of the recruited sample of 491 respondents. The final sample recruited reflected closely the original population proportions.
Sample size

Note: CYC, City of York Council; JRF/JRHT, Joseph Rowntree Foundation/Joseph Rowntree Housing Trust; YSJU, York St John University.
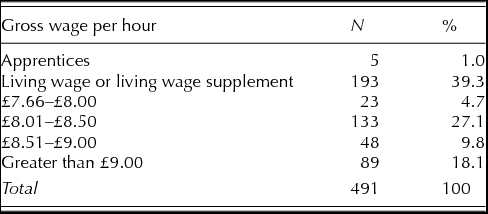
Of the full 491 observations, five were apprentices earning at or below the then (outside London) VLW rate of £7.65 per hour, 193 were receiving the VLW as employees and 293 were above the VLW (up to £10 per hour). See Table 2.
Wage rate of the sample

The main job types covered in the survey were sixty-one midday supervisory assistants, eighty teaching assistants, thirty-nine carers and thirty-six cleaners. The proportion of full-time employees (defined as thirty hours per week or more, on the grounds that it is the point that a premium is paid in Working Tax Credit) was 28 per cent for the full sample, 28.3 per cent at CYC, 26.7 per cent at JRF/JRHT and 36 per cent at YSJU. Nationwide, part-time workers are at greater risk of low hourly pay than full-time workers (Cooke and Lawton, Reference Cooke and Lawton2008; Hood et al., Reference Hood, Joyce, Phillips, Emmerson, Johnson and Miller2014), but again the case studies show a more marked pattern than that seen at national level. The mean (median) age of the employees is just over 44.5 (47) years of age and this is again very similar across the three organisations. The sample is predominantly White with over 94 per cent of the sample reporting their own ethnicity as White (UK or Irish), reflecting the composition of the local population.
Main findings from the study
Not all low-paid employees are living in unitsFootnote 3 in poverty
Low wage earners were often living in unusually complex households. Indeed, it may be that they could only manage as low-paid workers because they were living in units with higher earners, or more than one other earner, or sharing household expenses, or not having sole responsibility for mortgages, rents, utility bills and council taxes.
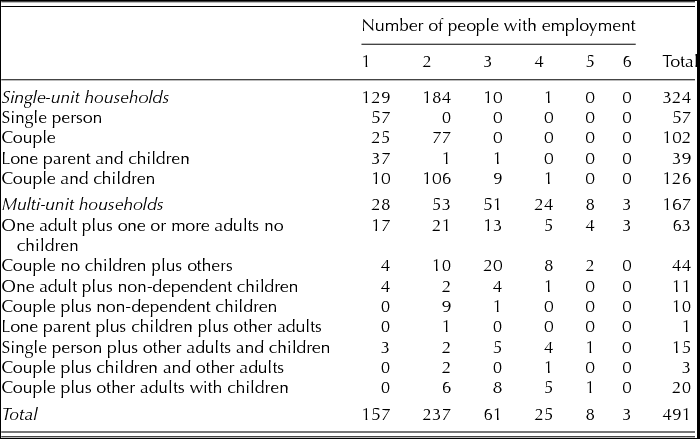
Table 3 summarises the complexity of the households in which the low wage employees were living, in terms of number of units, number of adults and relationships in the household. The percentage of working age adults in the sample in multi-unit households is 65.6 per cent and the percentage of all adults including pensioners in the sample in multi-unit households 63.9 per cent. In the Family Resources Survey 2013/14, the equivalent percentages are 39.8 per cent and 32.1 per cent (DWP, 2016).
Household composition by number of people employed

Only 12 per cent of the respondents were single people without children and entirely reliant on their net earnings (and any working tax credit that they claimed). Another 8 per cent were lone parents with children who were reliant on their earnings but with the addition of child benefits and tax credits and other benefits that they claimed. All the other single unit households were couples with potentially two earners. Twenty-one per cent were childless couples and 75 per cent of these had two earners. Twenty-six per cent were couples with children and 92 per cent of these had two earners in the family. Indeed, twelve single unit households had older but still dependent children with some earnings. For the multi-unit households, in only 17 per cent was the respondent the only employed person; 51 per cent had three or more people working in the household, and eleven households had five or more earners.
Where low wage earners were the main contributor to household resources, they were commonly only supporting themselves and a partner, and their net earnings and in-work benefits lifted many of them above the poverty threshold. The poverty risk for employed single earners on the living wage is very small, and it is normally associated with less than full-time working, or not claiming in-work benefits, rather than with low pay.
Poverty is not just about wages, it is also about hours
Previous research has shown that people on low hourly pay rates can avoid poverty through long working hours (Gardiner and Millar, Reference Gardiner and Millar2006). This latter pattern was reflected in the sample. Ninety-one per cent of respondents said that their low wage job (with one of the three VLW employers) was the main or only job that they had. Of the forty-two who said it was not their main job, thirty-seven worked for CYC as midday supervisor assistants in a York school. Thirty per cent of respondents held two jobs and 5 per cent held more than two jobs at the time of interview.
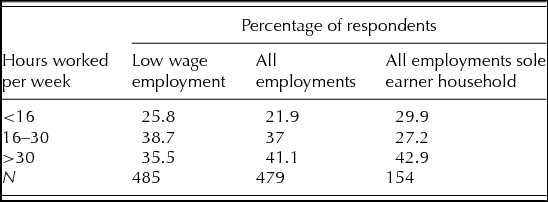
Table 4 presents a breakdown of the hours worked, including overtime, in the low wage job and in all jobs. Just over a quarter of low-wage employees were working for less than sixteen hours per week and only just over a third of low wage employees were working more than thirty hours per week. Low wage employment is clearly predominantly part-time. This picture remains if we just explore the hours of those who are the sole earners in the household – the proportion working less than sixteen hours and over thirty hours per week both increase slightly.
Hours worked

In terms of the job(s) profile, the majority of the sample were working in part-time employment, with just over a third holding multiple jobs. In terms of working weeks in the last year, respondents report that they had undertaken a mean (median) of 44.5 (47) weeks of regular paid work (full-time or part-time), with almost a quarter of the sample reporting fifty paid working weeks in the last twelve months.
Thus, even though an individual was receiving the VLW, they were not working the hours assumed by living wage calculations. However, in terms of working hours’ preferences, overall just over 30 per cent of the respondents would have liked to work more hours. This preference was much higher within the part-time (less than thirty hours per week) sample. Of the part-time employees, 38.8 per cent reported that they would like more hours, compared with 17.9 per cent of the full-time sample. Further the preference for more working hours is greater (and statistically significant) for the VLW group. Ten per cent of all respondents wanted to work fewer hours.
In a series of direct questions about aspirations and progression, more than half of the sample responded that they were not looking for progression. The follow-up qualitative interviews provided some useful context to these findings – for example, a lack of confidence in themselves and their skills by lower-waged employees might explain lack of engagement with ‘career advancement’ when offered. There were no differences in working hours’ preferences between those respondents who were living in households above and below the poverty threshold.
Poverty is not just about wages, it is also about cash benefits
Calculations of VLW rates in the UK assume that pay is complemented by benefits and tax credits to create total income, and assume that people are aware of and claim benefits successfully (Hirsch, Reference Hirsch2015).
For the full sample of 491 respondents, ninety-nine (approximately 20 per cent of the sample) reported receiving working and/or child tax credits. The proportion of VLW employees in receipt of tax credits is significantly higher than the rest of the sample. It can also be assumed that all the respondents with dependent children were receiving child benefit. Thirty per cent of the respondents were tenants with roughly equal proportions of local authority/housing association (LA/HA) (47 per cent) tenants and private tenants (41 per cent). Eighteen per cent of LA/HA tenants and 10 per cent of private tenants were receiving housing benefit. The sub-sample receiving the VLW was more likely to be receiving housing benefit (24 per cent).
Respondents were asked directly about how much they (themselves) thought they received from all the benefits and tax credits per week. For those that were able to respond to this question, 37 per cent said they were receiving some benefit. The mean (median) figures per week were £92.94 (£47). For these 185 respondents, the mean (median) figures for VLW workers within this group were very slightly higher at £103 (£48), but this difference was not statistically significant.
We sought to answer two other questions in relation to benefits. Were respondents receiving all the benefits to which they were entitled and what would be the impact of Universal Credit on their living standards? In order to answer these questions, the welfare rights experts in the York Welfare Benefits Unit were asked to assess whether a sub-set of respondents were receiving all the benefits they were entitled to, and to simulate the implications of a move to Universal Credit.
A sub-sample of approximately 40 per cent of the survey respondents was assessed. Where it appeared that a household had additional benefit entitlement, appropriate notification was passed to the research team. The notification included brief benefit entitlement advice that was forwarded to the household in a letter produced by the survey company.
Thirty-two cases (16 per cent of those inspected) were identified as having missing entitlement to means-tested benefits and/or tax credits (including ten disability benefit claims). They were fifteen single people, seven childless couples, six lone parents and four couples with children. Three established carers (claiming Carer's Allowance) and a further four carers were also potentially missing out. Thus, even though these households were receiving the VLW, they were missing out on other income intended to complement it.
The attempt to assess the potential impact of Universal Credit was overtaken and eventually rendered impossible by the many delays in implementation, and then the substantial cuts to the scheme. Suffice it to say that if Universal Credit had been introduced as intended, 25 per cent of the cases assessed would have gained. However, a third of those were under-claiming existing entitlements and were assuming they would claim Universal Credit on its introduction. Fifteen per cent of the cases assessed would have lost entitlement under Universal Credit.
Respondents were asked: ‘Have you and/or your household been (or will you be) affected by any of the following welfare reforms?’ Four respondents had been affected by the ‘bedroom tax’ (size criteria in social housing). This reduced the amount of housing benefit payable by 14 per cent if they were assessed as ‘under occupying’ by one bedroom or by 25 per cent if ‘under occupying’ by two or more bedrooms. Changes to the State Pension were mentioned most frequently (forty-six cases). All the employers tried to support low-paid employees with remuneration packages or employee benefit schemes run by the employers. The survey found that these were only of minimal value to employees.
Income poverty and deprivation
To assess the risk of in-work poverty (using the under 60 per cent median equivalised income threshold), the Before Housing Costs (BHC) and After Housing Costs (AHC), income measures were constructed at the tax/benefit unit level. It is important to recognise that this is not strictly comparable with Family Resources Survey data, which collects income data from every adult in a household and assesses poverty at the household level. This was not possible given the resources available for this project and not appropriate given the large proportion of multi-unit households. For an accurate income measure to be constructed at family/benefit unit level, a detailed collection of earnings (we used data from wage slips), benefits and other income received by the respondent (and their partner) is required. This measure was achieved for 338 of the 491 respondents. Of these 338 respondents, 16 per cent were living at or below the 60 per cent median income BHC threshold and 23 per cent AHC, or were living in families that were. The VLW workers were significantly more likely to be income poor than respondents overall – 22 per cent were at or below the 60 per cent median poverty threshold BHC and 32 per cent AHC. Thus, despite the introduction of the VLW, poverty (at the family unit level) persisted amongst a minority of the employees of CYC, JRHT/JRF and YSJU. This confirms that VLW policy cannot be sufficient as a route out of poverty. The risk of poverty was not restricted to the VLW group, 13 per cent BHC and 19 per cent AHC of the sample members on higher hourly pay rates were living in families on incomes at or below the 60 per cent median income threshold. This suggests that even an increase in the VLW pay rates would not be sufficient as a route out of poverty. However, the VLW policy is likely to have increased family unit incomes, and to have reduced the severity of poverty for those units still falling below the poverty threshold.
The poverty rate varied by the type of unit. The BHC poverty rate was 25 per cent for single person/single unit households and 24 per cent for single unit/lone parent households. It was 21 per cent in multi-unit households and 31 per cent if the respondent was a single person in a multi-unit household. The BHC poverty rate also varied with the number of workers in the household – it was 25 per cent for single earner units and 11 per cent for units with two or more earners. Those in poverty (BHC) were also working fewer hours: a mean of twenty-one hours per week compared to those not in poverty, twenty-eight hours per week.
Few studies to date have examined the effect of the VLW on material deprivation, as opposed to income poverty. The deprivation indicators used were derived from the 2012 PSE study (Main and Bradshaw, Reference Main and Bradshaw2014) and consisted of a set of items and activities that half the population in the UK considered to be necessities that people should not be without – so-called ‘socially perceived necessities’. The study distinguished between householdFootnote 4 necessities, adult necessities and the necessity items for those households with children. The majority of the respondents reported that their households had all the necessities and that they did all the listed activities. Of the remaining households, the most common household necessity lacking because it could not be afforded was household insurance. The most common adult items lacking, because they could not be afforded, were regular savings and money to repair broken electrical goods. The most common items lacking relating to children because they could not be afforded were money to save and a holiday away from home.
From these responses, two scales were produced. The number of items lacked by adults was produced by adding the number of household items and adult items and activities lacking because they could not be afforded – 57.2 per cent of the sample lacked no items and 71.0 per cent lacked one or fewer items. Analysis of the number of child items lacking was restricted to families where the respondent was the parent of the child in order to exclude the cases where the respondent was living in a household with children but did not know the circumstances of the child. Of this subsample, 62.0 per cent were not lacking any child items and 79.2 per cent were lacking one or fewer items With an adult threshold of lacking two or more necessities, 29 per cent of families with a low-paid employee in the sample were deprived. Using a threshold of lacking one or more child necessities, 21 per cent of low-paid employees with children were deprived.
Units containing employees on the VLW were more likely to be deprived and have significantly higher levels of deprivation than those who were low paid but on rates above the VLW. Thus, despite the introduction of the VLW, material deprivation as well as poverty persisted amongst a minority of the employees of CYC, JRHT/JRF and YSJU. There was no significant difference in child deprivation between children whose parents were on the VLW and those whose parents were on higher income.
The deprivation rate varied according to the type of unit and household, and the pattern for these low wage workers matched that seen for the population overall (Main and Bradshaw Reference Main and Bradshaw2014). Lone parents in the sample had a higher risk of adult deprivation. This held whether or not they were living in single unit or multi-unit households. Single respondents also had a higher risk of deprivation, and living in a household with other people did not appear to mitigate this. Adult and child deprivation was more prevalent among families with one worker (38 per cent and 25 per cent, respectively) compared with those with more than one worker (21 per cent and 13 per cent, respectively). But there was no difference in the hours worked by the employee on whether they were deprived of adult or child items.
The impact of the VLW
It is also important to explore the VLW from the point of view of its recipients. During the qualitative phrase of this research, several key themes emerged. Firstly, whilst the implementation of the VLW had not lifted all the case study employees who received it above the household poverty threshold, it had increased employee incomes and VLW employees appreciated receiving higher wages. In immediate terms, the additional money helped with essentials; for example, several participants reported that it helped them to pay bills ‘[I] can meet bills better . . . [the] extra income helps us not to worry’. A sense of relief was evident in some of the interviews, with the additional money helping to reduce immediate financial worries. Moreover, some participants described being able do things that may have previously been problematic, such as saving: ‘Increase in disposable income means more likely to save money for rainy day’, and funding children's activities: ‘Slightly better off, money used to pay for children's activities’.
Secondly, some interesting points were made about the impact on staff morale. For example, one participant commented: ‘It has given me more pride in my role’, and another said ‘[I] feel more loyal to the council. Other jobs in the same field of work I am in are all lower paid.’ Even amongst participants who did not report any direct impact of the VLW, there was the suggestion that in general terms it had had an impact: ‘No difference to me. Perhaps made people think their wage is fairer’.
Conclusion
This article illustrates how a minority of people on a ‘living wage’ do not avoid poverty or material deprivation, because of one or more of several factors: part-time hours, the nature of the units they live in and potentially, in some cases, failure to claim benefits they are due. It is clear from this study that there are many factors influencing the respondents’ incomes apart from the hourly gross wage rate. The hours worked are important. The vast majority of low-paid employees worked part time, but about 30 per cent of the sample wanted to work more hours, including 38.8 per cent of part-time workers. It is also clear that the low wages being received by respondents are commonly not the main or only determinant of their living standards. Their living standards are also determined by the unit they live in, other unit income and unit needs. For families with children, especially, benefits and tax credits also make a major contribution to their living standards, given the heavily means-tested nature of the in-work benefit/tax credit system in the UK.
The majority of low-paid employees in this sample are not income poor or deprived. Low pay should not be elided with poverty and deprivation. This was also illustrated by the modelling undertaken by D'Arcy et al. (Reference D'Arcy, Corlett and Gardiner2015) and Elming et al. (Reference Elming, Emmerson, Johnson and Phillips2015) of the highly regressive distributional impact of the introduction of the NLW and the cuts to Universal Credits.
However, many low-paid employees are living in units that are income poor and also materially deprived. There is some evidence that VLW employees are more likely to be income poor and deprived than employees with wage rates above the living wage. Paying employees a VLW, or more, is likely to reduce the risks of poverty, especially for single people who are likely to be most dependent on their own earned income. It is striking that it is single earners and lone parents in this sample who appear to be most likely to be income poor and deprived. They are also most likely to be more dependent on their own earnings.
Employers seeking to help their employees reach adequate living standards need to pay at least the VLW, but they also need to seek to offer longer hours of employment. Indeed, under the work conditionality regime, Universal Credit claimants will be expected to work more hours (if they are receiving it), whether or not they want to, within their own conditionality contract. Employers could help by stitching together part-time roles into more significant employment. Employers could also play a part in ensuring that their employees are claiming all the in-work benefits to which they are entitled.