

I. INTRODUCTION
Transition metal oxide perovskites have varied applications such as ferroelectric thin films, electronic devices, battery materials, and microwave technologies.Reference Scott1–Reference Ormerod3 Keav et al.Reference Keav, Matam, Ferri and Weidenkaff4 proposed that structured perovskite-type oxides exhibit good oxidation activity, which can have application as three-way catalytic convertors. Rare earth orthorhodites are known for their ability to act as semiconducting photocatalysts.Reference Jarret, Sleight, Kung and Gilson5 ARhO3 (A = rare earth element) with perovskite structure crystallizes in the orthorhombic lattice with Pbnm space group.Reference Nakamura, Shimura, Ito and Ikeda6 Carreiro et al.Reference Carriero, Qian, Kershaw, Dwight and Wold7 prepared several rhodium ternary oxides and determined their cell dimensions and stability in a reducing atmosphere.
Magnetic properties of rhodium containing rare earth perovskites has been investigated by several authors.Reference Taniguchi, Iizuka, Nagata, Uchida and Samata8–Reference Mary and Varadaraju10 Watson et al.Reference Watson and Somorjai11 studied the catalytic properties of Rh2O3 and LaRhO3 in syn-gas transformations. Jarret et al.Reference Jarrett, Sleight, Kung and Gillson12 prepared single crystals of lutetium rhodate using a flux technique. Ohnishi et al.Reference Ohnishi, Taniguchi, Ikoshi, Mizusaki, Nagata, Lai, Lan, Noro, Ozawa, Kindo, Matsuo and Takayanagi13 observed a peak in the specific heat measurements of LnRhO3. The peak obtained for LnRhO3, where Ln = Nd, Sm, Gd, Tb, Er, or Yb, is considered to be an antiferromagnetic transition at temperatures between 0.5 and 3.5 K.
The heavier rare earths are perovskites with orthorhombic deformation. YbRhO3 has an orthorhombic distortion of the perovskite structure.Reference Shannon14 GoldschmidtReference Goldschmidt15 has proposed tolerance factor t to predict the stability of perovskites. The tolerance factor for YbRhO3 was calculated from the ionic radii tables in Shannon’s workReference Shannon16 and those of Li et al.Reference Li, Soh and Wu17 In perovskites, A cation is present in coordination number twelve, while B cations are coordinated to six anions, while the coordination number of oxygen is two. The tolerance factor ‘t’ for YbRhO3 was calculated from the ionic radii and was found to be 0.827. It is well known that the RhO6 octahedron tilts when t is less than 0.9 and the perovskite structure type ABO3 transforms from a cubic to an orthorhombic structure. The degree of orthorhombicity is given by (b − a)/(b + a), where a, b, and c are the lattice constants. The perovskite YbRhO3(s) is orthorhombic and the orthorhombicity for YbRhO3(s) is 4.5 × 10⁻².Reference Lazarev and Shaplygin18
Orthorhodites have been studied extensively, for their catalytic, magnetic, and electrical properties; however, thermodynamic parameters like high temperature heat capacity and thermodynamic functions of YbRhO3(s) have not been reported. Knowledge of the thermodynamic properties of orthorhodites is important to determine its behavior during high temperature waste immobilization processes.Reference Kleykamp19 To the best of the author’s knowledge, there is one report in the literatureReference Jacob, Gupta, Han and Uda20 for the determination of ΔrG o of YbRhO3(s) by solid state electrochemical cell, and the results obtained have been compared with the present data. In this work, YbRhO3(s) was synthesized and characterized, and the heat capacity of YbRhO3(s) was measured using a differential scanning calorimeter (DSC-131) in the low temperature range, that is, 126–284 K as well as in the high temperature range that is from 307 to 846 K. The Gibbs energy of formation of YbRhO3(s) from elements in their standard state was determined by using an oxide electrochemical cell in the temperature range from 889 to 1110 K. Other thermodynamic functions were evaluated from these experimental results.
II. EXPERIMENT
A. Materials
Rh2O3(s) was synthesized from RhCl3(s) (99.9%, Johnson Matthey, Royston, England) by heating RhCl3(s) to 1023 K in oxygen atmosphere, and then further heating to 1273 K to give the β phase of Rh2O3(s).Reference Jacob and Waseda21 YbRhO3(s), the only reported ternary oxide in the Yb–Rh–O system was synthesized by the solid-state reaction route. Yb2O3(s) (99.9%, John Baker, Englewood, Colorado) and Rh2O3(s) were mixed in stoichiometric proportions, ground thoroughly, and moistened with nitric acid fumed and heated to dryness. The sample was then reground, pelletized, and heated to 1273 K with intermediate grindings. The pellets were then gradually cooled to room temperature. YbRhO3(s) was identified as a pure phase by the X-ray diffraction technique, using an STOE diffractometer with Cu Kα radiation (λ = 1.5406 Å) with Ni-filter. The values of interplanar d spacing match with those reported in JCPDS No. #34-0986.Reference Lazarev and Shaplygin18 A phase mixture of {YbRhO3(s) + Rh(s) + Yb2O3(s)} was pelletized and sintered at 1000 K and kept in a dessicator to be used for electromotive force (e.m.f.) measurements.
B. Measurement of heat capacity of YbRhO3(s)
Heat capacity measurements were carried out using a heat flux type differential scanning calorimeter (Model: DSC-131, Setaram Instrumentation, Lyon, France). The transducer of DSC-131 has been designed using the technology of the plate-shaped DSC rods made of chromel–costantan. It is arranged in a small furnace with a metal resistor of low-thermal inertia, so as to produce high heating and cooling rates, thereby providing for high speed experiments. The transducer also possesses very good sensitivity over the entire temperature range (100–850 K). The temperature calibration of the calorimeter was carried out by the phase transition temperature of National Institute of Standards and Technology (NIST) reference materials, and the heat calibration of the calorimeter was carried out from the enthalpies of transition of the reference materials (mercury: T fus = 234.32 K; gallium: T fus = 302.91 K; indium: T fus = 429.75 K; tin T fus = 505.08 K; lead: T fus = 600.60 K) and AR grade samples (n-pentane: T fus = 140.49; cyclohexane: T fus = 280.1 K, T trs = 190.0 K; deionized water: T fus = 273.16 K; potassium nitrate: T fus = 400.85 K; silver sulfate: T fus = 703.15 K). For the determination of heat capacity, NIST synthetic sapphire (SRM 720) in the powder form was used as the reference material.Reference Sabbah, Xu-wu, Chickos, Planas Leitao and Roux22 Temperature calibration and experimental setup for the calorimeter has been described elsewhere.Reference Banerjee, Singh and Venugopal23 The heat capacity of the oxide was determined in two different temperature ranges: (i) 126 ≤ T (K) ≤ 284 and (ii) 307 ≤ T (K) ≤ 846.
The classical three-step method in the continuous heating mode was followed in this study to measure the specific heat in the first temperature range from 126 to 284 K. The temperature was lowered using a liquid nitrogen bath. The liquid nitrogen was replenished periodically. Heat flow as a function of temperature was measured at a heating rate of 5 K/min with high purity helium as a carrier gas with a flow rate of 2 dm3/h. To determine heat capacity in the step-heating mode, that is, the second temperature range from 307 to 846 K, three sets of experiments were carried out in argon atmosphere at a heating rate of 5 K/min and a gas flow rate of 2 dm3/h. All three sets of experiments were performed under identical experimental conditions of heating rate, carrier gas flow rate, delay time, and temperature range. Two empty, flat bottomed cylindrical aluminum crucibles with covering lids (capacity 10−4 dm3) of identical masses were selected for the sample and reference cells.
In the first run, both the sample and reference cells were loaded with empty aluminum crucibles. The heat flow versus temperature was measured at a heating rate of 5 K/min. In the second run, a known weight of NIST synthetic sapphire (SRM-720) was loaded in the sample cell keeping the crucible in the reference side empty and once again the heat flow versus temperature was measured in the same temperature range and at the same heating rate. In the third run, a known weight of the sample of YbRhO3(s) was loaded in the sample cell, reference cell being empty and once again the heat flow as a function of temperature was measured. About 300–350 mg of the sample was used for the heat capacity measurements. In DSC-131, heat capacity of the sample under investigation can be calculated by a simple comparison of the heat flow rates in three runs as illustrated in the literature.Reference Hohne, Hemminger and Flammershein24 The expression used for the calculation of heat capacity of the sample is given as
 $${C_{\rm{p}}}\left( {{T_i} \to {T_{i{\rm{ + 1}}}}} \right) = {{\int_{{T_i}}^{{T_{i{\rm{ + 1}}}}} {{\rm{H}}{{\rm{F}}_{{\rm{sample}}}}{\rm{d}}T} - \int_{{T_i}}^{{T_{i + {\rm{1}}}}} {{\rm{H}}{{\rm{F}}_{{\rm{blank}}}}{\rm{d}}T} } \over {\int_{{T_i}}^{{T_{i{\rm{ + 1}}}}} {{\rm{H}}{{\rm{F}}_{{\rm{ref}}}}{\rm{d}}T - } \int_{{T_i}}^{{T_{i + 1}}} {{\rm{H}}{{\rm{F}}_{{\rm{blank}}}}{\rm{d}}T} }} \cdot {{{\rm{Mas}}{{\rm{s}}_{{\rm{ref}}}}} \over {{\rm{Mas}}{{\rm{s}}_{{\rm{sample}}}}}} \cdot {C_{{\rm{Pref}}}}{{{T_i} + {T_{i{\rm{ + 1}}}}} \over 2}\quad ,$$
where HFblank, HFRef, and HFsample represent heat flow during first, second, and third runs, respectively. C p(T j)sample and C p(T j)Ref represent the heat capacities of the sample and reference materials in J/(K g) and M sample and M Ref represent the mass of the sample and reference, respectively. As can be seen from the above expression instead of measuring the heat flow rate curve in a single continuous mode from initial temperature to final temperature, the temperature interval is divided into a number of narrow steps. The isotherm in each step had a duration of 600 s. Hence it is possible to reach thermal equilibrium of the sample after each step of temperature. If T i, represents the initial temperature, the temperature interval step is chosen between T j and T j+1, we define T j = T i + ΔT and T j+1 = T i + (j + i) ΔT. The heat capacity thus obtained was then converted to J/(K mol). The accuracy of measurements was checked by measuring the specific heat of Fe2O3(s) (mass fraction 0.998) in the temperature range from 126 to 846 K, and the values were found to be within ±2% as compared with the literature values.Reference Chase25
C. Electrochemical cell assembly
A double compartment cell assembly with 0.15 mole fraction calcia stabilized zirconia (CSZ) solid electrolyte tube with one end closed and flat was used to separate the gaseous environments of the two electrodes. A detailed experimental setup was described in an earlier publication.Reference Banerjee, Prasad and Venugopal26 The sample electrode comprising of a mixture of YbRhO3(s) + Yb2O3(s) + Rh(s) was pelletized into pellets of dimension 10 mm diameter and 3 mm thickness at a pressure of 100 MPa and sintered. Argon gas, flowing at a rate of 1 dm3/h, purified by passing it through towers containing the reduced form of the BASF catalyst, molecular sieves, and magnesium perchlorate served as the gaseous atmosphere for the cell. The sample electrode compartment was initially evacuated and flushed with argon gas. The flushing of gas followed by evacuation using a rotary pump was repeated several times while simultaneously the cell was heated to around 573 K so as to drive all moisture and other atmospheric gases present in the electrode compartment. The purified argon gas served as the cover gas over the working electrode and was bubbled out at a steady rate through an oil bubbler without disturbing the equilibrium at the working electrode. An alumina guide tube directed the argon cover gas to the working electrode. Synthetic dry air from an air generator was used as the reference electrode. The oxygen partial pressure of synthetic air from the generator does not depend on humidity or pressure variation. A Faraday cage was placed between the furnace and cell assembly. The cage was grounded to minimize induced e.m.f. in the cell leads. Alumina sheathed Pt–40% Rh lead wires were used to measure the e.m.f. The temperature of the cell was measured by a calibrated chromel–alumel thermocouple located in the vicinity of the pellet. The e.m.f. of the cell was measured when the value of the e.m.f. was steady for 2–3 h using a high impedance Keithley 614 electrometer (Keithley, Cleveland, Ohio). At each experimental temperature, the e.m.f. was noted when the voltage varied to within ±0.0002 V. Voltages were reproducible in subsequent heating cycles. Initially after assembling the cell, the e.m.f. was measured after equilibrating the galvanic cell at 1000 K for at least 24 h. The following cell configuration was used in the present study:
 $${{\left( - \right){\rm{Pt}} - {\rm{Rh}}} / {\left\{ {{\rm{YbRh}}{{\rm{O}}_{\rm{3}}}\left( {\rm{s}} \right) + {\rm{Y}}{{\rm{b}}_2}{{\rm{O}}_3}\left( {\rm{s}} \right) + {\rm{\ Rh}}\left( {\rm{s}} \right)} \right\}}}{\rm{//CSZ//}}{{\rm{O}}_2}{{\left\{ {{\rm{p}}\left( {{{\rm{O}}_{\rm{2}}}} \right) = 21.21{\rm{\ kPa}}} \right\}} / {{\rm{Pt}} - {\rm{Rh}}\left( + \right)}}\quad .$$
The cell above is written in such a manner that the right-hand electrode is positive. The reversibility of the solid-state electrochemical cell was checked by microcoulometric titration in both directions. A small quantity of current was passed through the cell in either direction. Removal of the applied current returned the cell e.m.f. to its original value. The e.m.f. of the cell was also found to be independent of the flow rate of the inert gas passing over the sample electrode. After electrochemical measurements, the X-ray diffraction pattern of the sample pellet did not reveal any new phase indicating no chemical reaction either with the electrolyte tube or with the Pt–40% Rh lead wire.
III. RESULTS AND DISCUSSION
A. Standard molar heat capacity of YbRhO3(s)
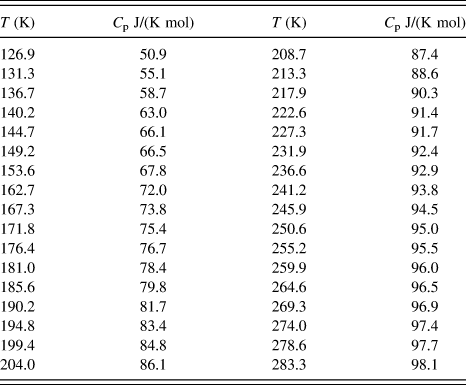
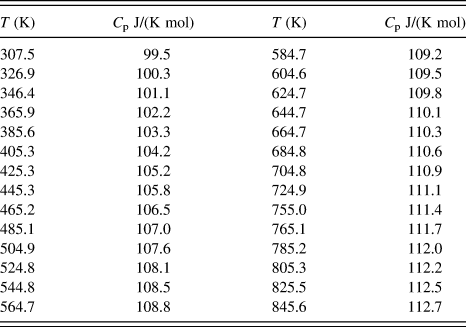
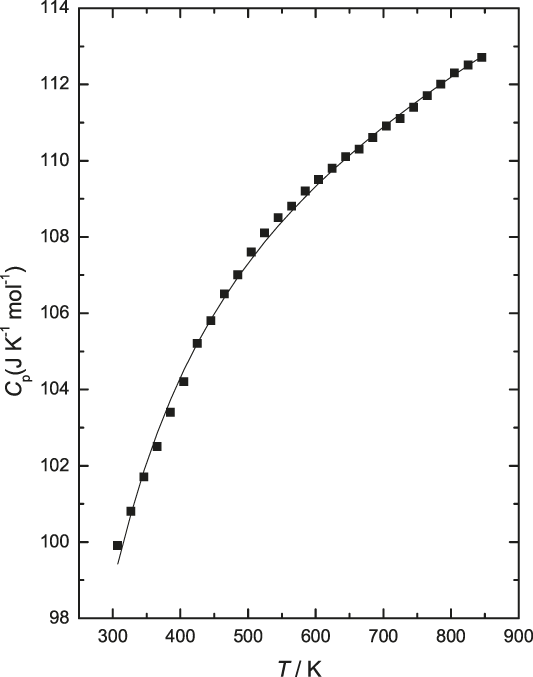
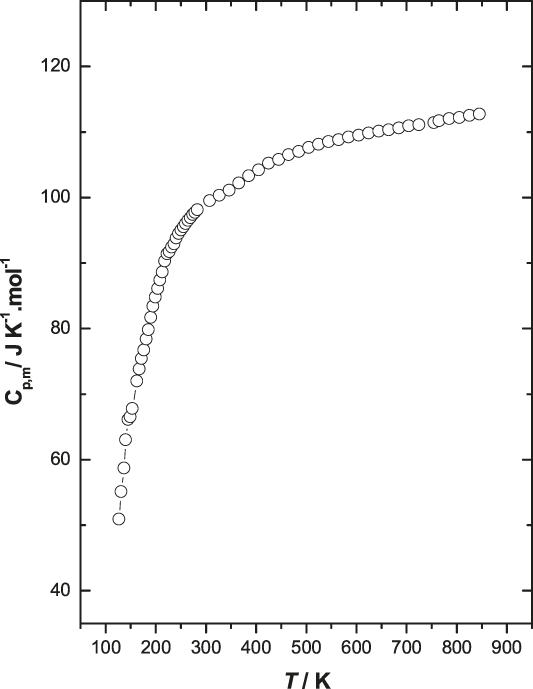
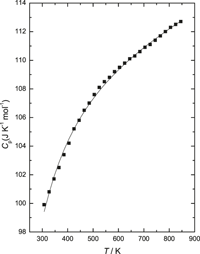
The standard molar heat capacity values of YbRhO3(s) obtained in the two different temperature ranges: (i) 126 ≤ T (K) ≤ 284 and (ii) 307.5 ≤ T (K) ≤ 845.6 are tabulated in Table I and Table II, respectively. The high temperature heat capacities are plotted as a function of temperature and are shown in Fig. 1. The standard molar heat capacity in the entire temperature range, from 126 to 846 K, has been plotted as a function of temperature and is shown in Fig. 2. The values of heat capacities are best fitted into the following polynomial expression: (a) in the low temperature range Eq. (3) and (b) high temperature range Eq. (4) by the least squares method.
 $$C_{{\rm{p,m}}}^{\rm{o}}\left( {{\rm{YbRh}}{{\rm{O}}_{\rm{3}}},\;{\rm{s}},\;T} \right)\left[ {{{\rm{J}} / {\left( {{\rm{K}}\;{\rm{mol}}} \right)}}} \right] = - 86.58{\rm{\ }} + 1.65T\left( {\rm{K}} \right) - 0.005{\rm{\ }}{T^2}\left( {\rm{K}} \right) + 5.25 \times {10^{ - 6}}{T^3}\left( {\rm{K}} \right).\;\left( {126 \le T\left( {\rm{K}} \right) \le {\rm{\ }}284} \right)\quad ,$$
 $$C_{{\rm{p,m}}}^{\rm{o}}\left( {{\rm{YbRh}}{{\rm{O}}_{\rm{3}}},{\rm{s}},T} \right)\left[ {{{\rm{J}} / {\left( {{\rm{K}}\;{\rm{mol}}} \right)}}} \right] = {{106.82 <$$><$$>+ 8.57 \times {{10}^{ - 3}}T\left( {\rm{K}} \right) - 9.48 \times {{10}^5}} / {{T^2}\left( {\rm{K}} \right)}}.\;<$$><$$>\left( {307 \le T\left( {\rm{K}} \right) \le 846} \right)\quad {\rm{.}}$$
Low temperature standard molar heat capacity of YbRhO3(s).

High temperature standard molar heat capacity of YbRhO3(s).

High temperature standard molar heat capacity of YbRhO3(s).

Plot of standard molar heat capacity of YbRhO3(s) against temperature from 126 to 846 K.

The standard molar heat capacity data for YbRhO3(s) at 298.15 K from Eq. (4) were calculated to be 98.7 J/(K mol). The heat capacity at 298.15 K was also estimated in the present study by the Neumann–Kopp’s rule,Reference Kubachewski, Alcock and Spencer27 from the heat capacity data of the constituent binary oxides, that is, Yb2O3(s) and Rh2O3(s). However, there is considerable scatter in the standard molar heat capacity data of Rh2O3(s).Reference Jacob, Uda, Okabe and Waseda29 The values obtained by Nell and O NeillReference Nell, St and O’Neill30 matched well with those of Jacob et al.Reference Jacob, Uda, Okabe and Waseda29 Based on the heat capacity data of Yb2O3(s)28 and optimized heat capacity data of Rh2O3(s),Reference Jacob, Uda, Okabe and Waseda29 the estimated heat capacity of YbRhO3(s) at 298.15 K was found to be 99.6 J/(K mol). As can be seen, there is good agreement between the estimated values obtained by Neumann–Kopp’s rule using the heat capacity value of Rh2O3(s) from Jacob et al.Reference Jacob, Uda, Okabe and Waseda29,Reference Nell, St and O’Neill30 and Yb2O3(s) from the literature28 and the values calculated using Eq. (4) obtained experimentally. The standard molar heat capacity data for YbRhO3(s) has been reported for the first time.
B. Solid-state electrochemical measurements for the oxide cell
The e.m.f. of the solid state electrochemical cell is related to the partial pressure of oxygen at the two electrodes and is given by the following relation:
 $$p''\left( {{{\rm{O}}_2}} \right)$$
 $$E = \left( {{{RT} / {nF}}} \right) \cdot \int {t\left( {{{\rm{O}}^{2 - }}} \right) \cdot d\;\ln \;} p\left( {{{\rm{O}}_2}} \right)\quad ,$$
 $$p'\left( {{{\rm{O}}_2}} \right)$$
where E is the measured e.m.f. of the cell, R = 8.314 J/(K mol) is the universal gas constant, n is the number of electrons participating in the electrode reaction, F = 96485.3 C/mol is the Faraday constant, T is the absolute temperature, t(O2−) is the effective transference number of O2− ion for the solid electrolyte, and p″(O2) and p′(O2) are the equilibrium oxygen partial pressures at the positive and negative electrodes, respectively. The transport number of oxygen ion in the present electrolyte cell arrangement is nearly unity [t(O2−) > 0.99] at the oxygen pressures and temperature range covered in this study. Hence the e.m.f. of the cell is directly proportional to logarithm of the ratio of partial pressures of oxygen at the electrodes:
 $$E{\rm{\ }} = {\rm{\ }}\left( {{{RT} / {nF}}} \right) \cdot \ln \left\{ {{{p''\left( {{{\rm{O}}_2}} \right)} / {{\rm{\ }}p'\left( {{{\rm{O}}_2}} \right)}}} \right\}\quad .$$
Thus,
 $$nFE{\rm{\ }} = {\rm{\ }}RT\ln {\rm{\ }}p''\left( {{{\rm{O}}_2}} \right) - RT\ln {\rm{\ }}p'\left( {{{\rm{O}}_2}} \right)\quad .$$
RT ln p″(O2) is the oxygen chemical potential over the positive electrode and RT ln p′(O2) is the oxygen chemical potential over the negative electrode. The solid-state electrochemical cell configuration is given in Eq. (2).
The electrochemical reaction at the reference electrode of the cell can be given by
 $${3 / 2}\;{{\rm{O}}_2}\left( {\rm{g}} \right) + {\rm{\ }}6{\rm{\ }}{{\rm{e}}^ - }{\rm{\ }} = {\rm{\ }}3{\rm{\ }}{{\rm{O}}^{2 - }}\quad \left( {{\rm{at}}\;{\rm{the}}\;{\rm{cathode}}} \right)\quad .$$
The electrochemical reaction at the working electrode of the cell can be given by
 $${\rm{Y}}{{\rm{b}}_2}{{\rm{O}}_3}\left( {\rm{s}} \right) + 2{\rm{\ Rh}}\left( {\rm{s}} \right) + 3{{\rm{O}}^{2 - }}{\rm{\ }} = {\rm{\ }}2{\rm{YbRh}}{{\rm{O}}_3}\left( {\rm{s}} \right) <$$><$$>+ 6{{\rm{e}}^ - }\quad \left( {{\rm{at}}\;{\rm{the}}\;{\rm{anode}}} \right)\quad .$$
The net cell reaction for the passage six Faradays of electricity obtained by combining the two half cell reactions is
 $${\rm{Y}}{{\rm{b}}_2}{{\rm{O}}_3}\left( {\rm{s}} \right) + 2{\rm{Rh}}\left( {\rm{s}} \right) + {3 / 2}{\rm{\ }}{{\rm{O}}_2}\left( {\rm{g}} \right) = 2{\rm{YbRh}}{{\rm{O}}_3}\left( {\rm{s}} \right)\quad .$$
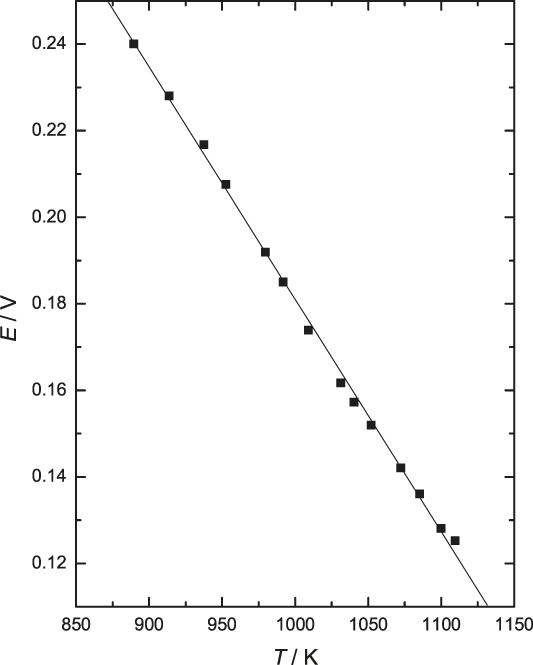
Within experimental uncertainty, the least squares regression analysis of the e.m.f. gives
 $${E / V}\left( { \pm 0.00168} \right) = {\rm{\ }}0.7178 - 5.368{\rm{\ }} \times {10^{ - 4}} \cdot \left( {{T / {\rm{K}}}} \right)\;\left( {889 \lt {T / {{\rm{K}} \lt 1110}}} \right)\quad .$$
Variation of e.m.f. as a function of temperature is given in Fig. 3. The ΔrG o(T) for the reaction given in Eq. (10) involves the transfer of six electrons. Hence from Nernst equation, we get
 $${\Delta _{\rm{r}}}{G^{\rm{o}}}\left( T \right) = - 6{\rm{F}}E{\rm{\ \ }} = 2{\Delta _{\rm{f}}}{G^{\rm{o}}}{\rm{\ }}\left\{ {{\rm{YbRh}}{{\rm{O}}_{\rm{3}}}\left( {\rm{s}} \right)} \right\} - {\Delta _{\rm{f}}}{G^{\rm{o}}}\left\{ {{\rm{Y}}{{\rm{b}}_{\rm{2}}}{{\rm{O}}_3}\left( {\rm{s}} \right)} \right\} - {3 / 2}RT\ln {\rm{\ }}p\left( {{{\rm{O}}_2}} \right)\quad .$$
Variation of e.m.f. of the cell (−)Pt–Rh/{YbRhO3(s) +Yb2O3(s) + Rh(s)}//CSZ//O2{p(O2) = 21.21 kPa}/Pt–Rh(+) as a function of temperature.

ΔfG o{Yb2O3(s)} from the literature28 was substituted and e.m.f. values from Eq. (11), were used to determine the standard Gibbs energy of formation of YbRhO3(s) from elements in their standard state:
 $${\Delta _{\rm{f}}}{G^{\rm{o}}}{{\left\{ {{\rm{YbRh}}{{\rm{O}}_{\rm{3}}}{\rm{(s)}}} \right\}} / {{{{\rm{kJ}}} / {{\rm{mol}}}}\left( {{\rm{ \pm 1}}{\rm{.6}}} \right)}}{\rm{ = }} - 1110.9{\rm{\ <$$><$$>+ \ 0}}{\rm{.287\ }}T\left( {\rm{K}} \right)\quad {\rm{.}}$$
The error includes the standard deviation in the e.m.f. and uncertainty in the data taken from the literature. The Gibbs energy of formation is a linear function of temperature within the investigated temperature range, i.e., from 889 to 1110 K. The intercept and the slope of this linear equation correspond, respectively, to the average values of the standard molar enthalpy and entropy of formation of YbRhO3(s) in the temperature range covered by e.m.f. measurements.
C. Molar enthalpy of formation and absolute molar entropy
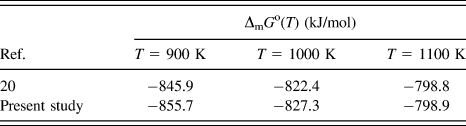
The molar enthalpy of formation of YbRhO3(s) at 298.15 K has been calculated by the second law method. In this method, ΔfH o(298.15 K) can be calculated from the heat capacities of the reactants and products along with the transition enthalpies occurring in the temperature range under study. Molar heat capacity data and the molar Gibbs energy of formation of YbRhO3(s) obtained in this study by using a differential scanning calorimeter and electrochemical cell, respectively, along with heat capacity and transition enthalpies of Rh(s),28 Yb(s),Reference Berg, Spedding and Daane31 and O2(g),Reference Graves, Kirby and Rardin32 were used to determine the value of ΔfH o(YbRhO3, s, 298.15 K) and was found to be −1132.4 kJ/mol. The standard molar entropy S o(298.15 K) was estimated by the Latimer entropy contribution of individual ions,Reference Kubachewski, Alcock and Spencer27 which gives S o(298.15 K) = 107.2 [J/(K mol)]. Based on the calculated value of entropy and the measured heat capacity, the thermodynamic functions of YbRhO3(s) were calculated and the resulting values were extrapolated to 1000 K and given in Table III, where fef denotes free energy function. Standard Gibbs energy of formation of YbRhO3(s) from elements in their standard state obtained in the present study was compared with literature valuesReference Jacob, Gupta, Han and Uda20 and presented in Table IV. The ΔfG o(T) matches well with those obtained by Jacob et al.Reference Jacob, Gupta, Han and Uda20 at the average experimental temperature of our study T av. = 1000 K but differs by about 10 kJ/mol at lower temperatures, as can be seen from Table IV.
Derived thermodynamic functions of YbRhO3(s).

a Fef = −(G o(T) − H o(298.15 K))/T.
Comparison of ΔmG o(T) of YbRhO3(s) from elements in their standard state, obtained in the present study, with literature values.Reference Jacob, Gupta, Han and Uda20

IV. CONCLUSIONS
Ytterbium rhodium(III) oxide, the only oxide in the Yb–Rh–O system, was synthesized by the solid-state reaction route and characterized by the X-ray diffraction method. The standard molar heat capacity of YbRhO3(s) is C op,m(YRhO3, s, T) [J/(K mol)] = 106.82 + 8.57 × 10⁻³ T(K) − 9.48 × 10⁵/T 2(K). The standard molar heat capacity data for YbRhO3(s) at 298.15 K were calculated to be 98.7 J/(mol K). An oxide electrochemical cell using calcia stabilized zirconia as an electrolyte was used to measure the electromotive force for the coexisting phase field {YbRhO3(s) + Yb2O3(s) + Rh(s)}in the temperature range from 889 to 1110 K. The standard molar Gibbs energy of formation of YbRhO3(s) from elements in their standard state calculated by the least squares regression analysis of the data obtained in the present study and the data of binary oxides from the literature can be represented by
 $${\Delta _{\rm{f}}}{G^{\rm{o}}}{{\left\{ {{\rm{YbRh}}{{\rm{O}}_{\rm{3}}}\left( {\rm{s}} \right)} \right\}} / {{{{\rm{kJ}}} / {{\rm{mol}}}}}}\left( { \pm 1.6} \right) = - 1110.9 + 0.287\;T\left( {\rm{K}} \right)\quad .$$
The second law method gave the value of ΔfH o(YbRhO3, s, 298.15 K) as − 1132.4 kJ/mol. The heat capacity of ytterbium rhodium(III) oxide was determined and reported for the first time and no other experimental data are available in the literature for comparison.
ACKNOWLEDGMENTS
The authors are thankful to Dr. S. Kannan Head, Fuel Chemistry Division and Dr. P.K. Pujari, Associate Director, Radiochemistry and Isotope Group BARC, Mumbai for their constant support and encouragement.