Introduction
For the past decades, in the Southern region of Portugal, land use was intensive with monoculture of cereals and soils were subject to tillage operations with heavy implements. The characteristic undulating relief associated with this form of land use management led to erosion, resulting in degraded, shallow and stony soils, with low organic matter content, and a tendency to become acidic with limited productivity. Since the 1980s, various soil conservation policies have been gradually implemented, including the recommended installation of permanent and grazed pastures in Montado ecosystem (Efe Serrano, Reference Efe Serrano2006). Farmers’ management of this ecosystem, in terms of soil fertilization, balance, biodiversity and pasture regeneration or grazing intensity, requires the monitoring of pasture development variability for identification of site-specific management (SSM) zones. These subfield regions consist of areas that have similar permanent characteristics (Schellberg et al., Reference Schellberg, Hill, Gerhards, Rothmund and Braun2008).
Traditional soil and pasture sampling and the necessary laboratory analysis are time-consuming and cost prohibitive, not viable from a practical SSM perspective. The low economic value of grassland products limits the application of expensive technologies, but grassland can benefit from technological developments that have been made for arable crops during the past decades (Schellberg et al., Reference Schellberg, Hill, Gerhards, Rothmund and Braun2008). Electormagnetic Induction (EMI) sensors, active optical sensors and electronic capacitance probes are some examples of these technological developments. Measurement of the apparent soil electrical conductivity (ECa), using EMI sensors, is one of the most reliable techniques to characterize the spatial pattern of soil properties within fields (Corwin and Lesch., Reference Corwin and Lesch2005). Several vegetation indices, obtained by means of remote and proximal sensing, have been developed, tested and improved in order to estimate and compare many leaf and canopy properties. Normalized difference vegetation index (NDVI) is correlated with vegetative vigour (Gitelson, Reference Gitelson2004), so this can be seen as another rapid means of obtaining information for detailed pasture mapping. The relationship between pasture dry matter yield and corrected meter reading (CMR) of an electronic capacitance probe is known to vary with such factors as floristic composition, phenological stage or pasture moisture content (Serrano et al., Reference Serrano, Peça, Marques da Silva and Shahidian2011); natural vegetation dynamics which justify the interest in performing calibration tests.
The main objective of this work was to evaluate sensing techniques which have potential for monitoring aspects related to spatial and temporal variability of soil nutrients and pasture yield and support to decision making for the farmer.
Material and methods
Site characteristics
The experimental field, with an area of about 7 ha, is located at the Silveira farm (38°62.2’N and 7°94.8’W) in Southern Portugal. It is a natural ecosystem of pasture (mainly grasses) and sparse trees (olive, oak and mulberries trees), which was not grazed between 2014 and 2016. The predominant soil of this field is a Cambisol derived from granite (FAO, 2006).
Characterization of the climate
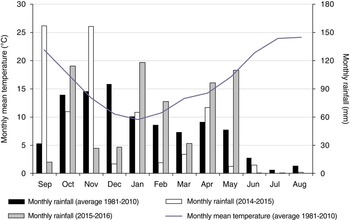
The Mediterranean climate can be considered as a transition between temperate and dry subtropical climates, is characterized by summer drought, variable rainfall, and mild or moderately cold winters. The monthly average temperature is between 9 and 24°C and the historic annual rainfall is approximately 600 mm, which occurs mainly between October and March and is practically non-existent during summer. However, the concentration of rainfall between March and June is variable from year to year and is an important factor for maintaining the development of the pasture and to extend its vegetative cycle. According to Murray et al. (Reference Murray, Yule and Gillingham2007), rainfall is one of the major factors governing annual pasture production. Figure 1 presents the average thermo-pluviometric information from the Évora meteorological station between 1981 and 2010 and the monthly rainfall for the agricultural years of 2014/2015 and 2015/2016. The distribution of the monthly rainfall was quite different between 2014/2015 and 2015/2016, with particular relevance to the period when there is a clear rise in air temperature (from March onwards) until the end of Spring (June). Thus, in terms of accumulated rainfall in this period, the average historical value is 162 mm, while in 2015 it was 107 mm (only 8 mm in May) and in 2016 it was 240 mm (with 110 mm in May).
Monthly mean temperature and rainfall for the study area.

Soil and pasture sample collection and analysis
A regular sampling grid of 34 m was defined. Forty-seven sampling points were geo-referenced with a real-time kinematic (RTK) GNSS instrument (Trimble RTK/PP-4700 GPS, manufactured by Trimble Navigation Limited, USA). Forty-seven composite soil samples were taken in October of 2015 using a gouge auger, from the 0–0.30 m soil layer. Each composite sample comprised six sub-samples taken within a 3-m radius area of the georeferenced sampling point. The texture, moisture content, pH, organic matter, P2O5 and K2O were determined according to standard protocols. Forty-seven pasture samples were taken monthly during Spring of 2015 (March, April and May) and 2016 (March, April, May and June), using a portable electric grass shear at 1–2 cm above ground level. The pasture of each 0.1 m2 area delimited by a metallic rim were stored in marked plastic bags and weighed to determine the green matter production per hectare (GM, kg ha−1). The samples were placed in an oven at 65°C for 48 hours to determine the moisture content (PMC, %), which was used to calculate dry matter yield (DM, kg ha−1).
Sensor measurements
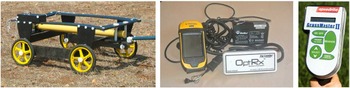
The variability of Spring rainfall and soil and pasture spatial variability justifies the need to evaluate and calibrate non-destructive techniques that are useful for monitoring large areas. Three types of sensors (Figure 2) were evaluated in a 7 ha pasture experimental field: an EMI sensor (“DUALEM 1S”, that measures the ECa), an active optical sensor (“OptRx®”, that measures the NDVI) and a capacitance probe (“GrassMaster II” that estimates plant mass).
Left: “DUALEM 1S” sensor; Centre: optical sensor (“OptRx”), GPS receiver (“Trimble”) and portable battery; Right: console of the “Grassmaster II” capacitance probe.

Apparent soil electrical conductivity survey
A DUALEM 1S non-contact sensor (Dualem, Inc., Milton, ON, Canada), equipped with a global positioning system (GPS) antenna, was used to map the apparent soil electrical conductivity (ECa) in the survey field in October 2013 and 2015 (Fig. 2). The sensor, transported by a PVC platform 0.20 m above ground surface, measured the ECa from 0–0.30 m and 0–1.30 m soil layers. The sensor recorded measurements every second.
Vegetation multispectral surveys
A commercial active crop sensor (“OptRx”, Ag Leader, 2202 South Riverside Drive, Ames, IOWA 50010, USA) was used in association with a Trimble GNSS GeoExplorer 6000 series receiver (GmbH, Am Prime Parc 11, 65479 Raunheim, Germany) (Fig. 2, centre). This sensor measures simultaneously three infrared bands: i) RED; ii) RED EDGE; and iii) NIR. With two of the previous spectral bands, the NDVI index ([NIR-RED]/[NIR+RED]) was calculated. The “OptRx” crop sensor was manually transported by an operator 0.75 m above ground surface. Multispectral information was collected monthly during Spring of 2015 and 2016, before cutting the pasture in the forty-seven sampling points.
Vegetation capacitance measurements
Once the optical sensor operator had finished at each sampling point (at Spring of 2015 and 2016), a second operator would measure capacitance with the “Grassmaster II” probe (Fig. 2, right). The capacitance readings (CMR) were registered after the instrument had been positioned vertically over the vegetation, some 0.2–0.3 m away from the operator’s body. In each measuring area, ten readings were carried out with the probe and averaged.
Classical statistics, spatial interpolation and regression analyses
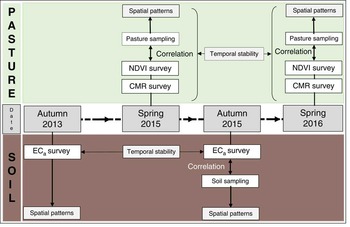
Figure 3 shows the schematic diagram of the experimental layout. Descriptive statistical analysis (mean, standard deviation and range) was calculated for the various data. The values were spatially represented in the form of surface maps generated in raster format and produced with ArcGIS 10.2 (ESRI, Redlands, CA, USA) software. All surfaces were interpolated on a 5-m grid, using an ordinary kriging method and a spherical semivariogram model with a 30-m lag size. The Pearson correlation coefficient was used to evaluate the relationships between soil variables and ECa and between pasture parameters (GM and DM) and sensor parameters (CMR and NDVI). Correlations were established with a level of statistical significance of 95% (p<0.05).
Schematic diagram of the experimental layout showing type and timing of measurements.

Results and discussion
Evaluation of soil properties of the experimental field
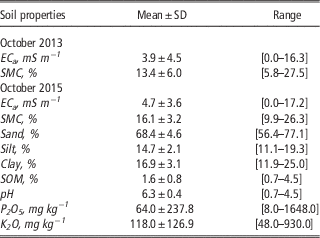
Table 1 presents the mean, standard deviation and range of soil properties in the experimental field in sampling years. The spatial coefficient of variation (CV) for some soil properties are large, especially with regard to P2O5, K2O, ECa (spatial CV>100%) and SOM (spatial CV about 50%). Others, as texture and pH are even less variable (spatial CV of 5–6%). SMC shows CV variability of, between 20 and 45%, depending on the data. Other authors have documented this soil variability in studies involving the soil-pasture-tree-animal ecosystem. Mallarino and Wittry (Reference Mallarino and Wittry2004) for example, in field tests with grazed pastures in similar soils, also found largest CV for P2O5 and lowest for pH, whereas those for K2O and SOM were intermediate.
Descriptive statistics of soil properties of experimental field

SD- Standard deviation; SOM- Soil organic matter; ECa- Apparent soil electrical conductivity; SMC- Soil moisture content.
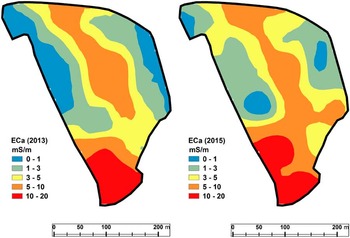
Figure 4 shows the maps of spatial patterns of ECa in the experimental field in October of 2013 and October of 2015. The spatial variability of this parameter and the temporal stability of ECa measurements are evident (r=0.893). The temporal stability of ECa, was also demonstrated by Serrano et al. (Reference Serrano, Shahidian and Marques da Silva2016a) as important to the implementation of SSM strategies.
Maps of spatial patterns of ECa of the study field in October 2013 (left) and October 2015 (right).

The ECa measurements had significant correlation coefficients with some soil parameters: pH (r=0.623; p<0.01), clay (r=0.447; r<0.05) and SMC (r=0.383; p<0.05). One aspect that could have conditioned the correlation between soil parameters and ECa is the reduced depth of these shallow soils; in these cases the probe was possibly measuring the ECa of the bedrock, which has an adverse effect on the ECa values (Serrano et al., 2010).
Evaluation of pasture parameters of the experimental field
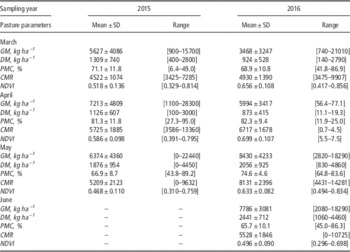
Table 2 presents the mean, standard deviation and range of pasture parameters in the experimental field in sampling years. In June 2015, no measurements were taken because the pasture was already very dry as a result of the high temperatures and the low rainfall in the previous month. The higher pasture productivity in March and April 2015 is evident, exactly the opposite of May 2016, reflecting the better temperature-rainfall conjugation. Throughout the sampling months, CMR and NDVI were always higher in 2016, compared to 2015, reflecting not only higher pasture productivity, but also soil moisture conditions that allowed the end of the vegetative cycle to be delayed.
Descriptive statistics of pasture parameters in Spring of 2015 and 2016

SD- Standard deviation; GM- Green matter; DM-Dry matter; PMC- Pasture moisture content; CMR- Capacitance; NDVI- Normalized difference vegetation index.
The interest in evaluating fast tools for monitoring pastures has led various research teams to study these new technologies in various parts of the world. Nonetheless, there are no published works that provide a direct comparison of the capacitance probe and optical sensor in the monitoring of pasture productivity (Serrano et al., Reference Serrano, Shahidian and Marques da Silva2016a).
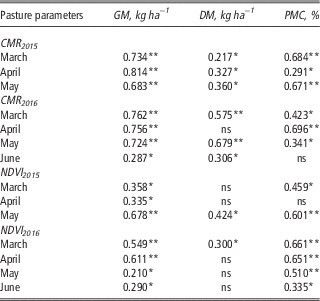
Table 3 presents the significant correlation coefficients between pasture parameters (GM, DM and PMC) and parameters measured by sensors (CMR and NDVI), at sampling times. In both cases (CMR and NDVI), the strongest relationships were obtained with GM. The results reveal significant correlation between GM and CMR and between GM and NDVI at all sampling times, which is justified by the underlying operating principles of the two technologies and in their relation to the pasture productivity: (i) the “Grassmaster II” capacitance probe is sensitive to pasture humidity (PMC) and thus tends to present higher values in pastures with higher GM content (Serrano et al., Reference Serrano, Peça, Marques da Silva and Shahidian2011); (ii) under the conditions of this current study there exists an optimum PMC for estimating both GM and DM with the Grassmaster II and this device responds to the wet biomass (Serrano et al., Reference Serrano, Shahidian and Marques da Silva2016b); (iii) the OptRx® sensor measures higher values of NDVI in areas with higher density of photosynthetically active vegetation (Dusseux et al., Reference Dusseux, Moy-Hubert, Corpetti and Vertès2015), which also corresponds to higher concentration of GM; (iv) however, the correlations between the NDVI and the pasture productivity were weaker or even not significant, which, according to Schaefer and Lamb (Reference Schaefer and Lamb2016), might be caused by saturation at top-end biomass levels, given that the biomass value at which saturation occurs is critically dependent on the species, morphology and chlorophyll concentration in the leaves.
Significant correlation coefficients between pasture parameters (GM, DM and PMC) and sensor parameters (CMR and NDVI) at sampling times

*-Correlation significant at the 0.05 level; **-Correlation significant at the 0.01 level; ns- Correlation not significant.
Conclusions
The optimization of Montado agro-forestry systems is a complex and long-term process requiring practical studies. The application of sensing techniques to pasture production systems is complex due to the highly spatial and temporal variability of these environments. Proximal sensing tools with higher spatial and spectral resolution could overcome some of these challenges. The results indicate the possibility of using a soil electrical conductivity sensor for monitoring the characteristics of the soil, which could represent an important aid in simplifying the process of sampling and support decision making. On the other hand, the significant correlations obtained between capacitance or NDVI and pasture productivity in two consecutive years with different rainfall patterns affecting the pasture vegetative cycle, shows the potential of these tools for monitoring the evolution of spatial and temporal patterns of biodiverse pastures in Alentejo dry-land farming systems. These results are relevant for the selection of an adequate sensing system for a particular application and open new perspectives for other works that would allow the testing, calibration and validation of the sensors in a wider range of pasture production conditions, namely the extraordinary diversity of botanical species that are characteristic of the Mediterranean region. In the future it will be important to evaluate the possibility of developing an ideal pasture monitoring system that combines data from multiple sources: proximal sensing data for repeated and continuous monitoring of the pastures, and remote sensing images collected at a limited number of times when a spatial assessment of pastures is required. These measures allow the farmer to simplify the pasture monitoring process and obtain a much better understanding of the livestock system, the basis for formulating the most appropriate management strategies, such as grazing rotations, nutrient management or yield prediction, which are fundamental for the sustainability of this strategic sector.
Acknowledgments
This work was funded by National Funds through FCT - Foundation for Science and Technology under the Project UID/AGR/00115/2013.