1. INTRODUCTION
Biologically inspired design (BID) uses biological phenomena as analogies to help solve design problems. Designers commonly use sketching to generate, express, and evaluate ideas, producing high-quality creative outcomes in the conceptual stage of product design (Sun et al., Reference Sun, Xiang, Chai, Wang and Liu2013, Reference Sun, Xiang, Chai, Wang and Huang2014). Although biological analogies have inspired many innovative solutions (Cheong et al., Reference Cheong, Hallihan and Shu2014), how to evaluate the sketching of products in an intelligent and systematic way has not been explored before, which is important for understanding the effects of biological analogies in conceptual design.
The main goal of this research is to test the following specific hypotheses: exposure to biological examples in ideation will correlate with sketches of conceptual design and exposure to biological examples in ideation will increase the perceptual matching degree between design ideas generated via sketching and the desired function.
Therefore, we proposed an objective and subjective method for the evaluation of the effects of biological examples on sketching contours of products in response to a visual analogy with different transfer distances (far, medium, and near). With regard to the design problem in the paper, we focused on visual analogy in the dimension of transfer content. Because visual features frequently assist designers more than instructional sentences and key words (Goldschmidt & Smolkov, Reference Goldschmidt and Smolkov2006; Chai et al., Reference Chai, Cen, Ruan, Yang and Li2015), visual analogies are largely employed by designers to solve design problems. For objective evaluation, elliptic Fourier analysis (EFA) was performed on the sketches, transforming the outline into a series of elliptic Fourier coefficients (elliptic Fourier descriptors [EFDs]). These coefficients were then subjected to principal components analysis (PCA), and one-way analysis of variance (ANOVA) tests were performed on the principal component values. For subjective evaluation, perceptual matching based on the semantic differential evaluation of design problem and the sketching results of conceptual design was used. To examine these methods, an experimental study was conducted in which participants were exposed to biological examples in the idea generation process. As a consequence, these results were then compared to that of participants receiving no examples and to those receiving two kinds of human-engineered examples from different product categories and within one product category.
The sections of this paper are organized as follows. Related work about analogies in conceptual design, BID research, and biological analogies evaluation research is reviewed in Section 2. Methods and experiments for evaluating bioinspired sketching in conceptual designs are described in Section 3. Section 4 reports the results of the objective and subjective evaluation, followed by the discussion in Section 5. Section 6 concludes the paper and presents the remarks on the future work.
2. RELATED WORK
2.1. Analogies in conceptual design
Conceptual design is often regarded as a process that transforms a customer need or a desired function into a solution concept (Chen, Zhang, et al., Reference Chen, Zhang, Xie and Zhao2015). It is widely acknowledged that conceptual design is the most crucial front-end phase in a product development cycle (Wang et al., Reference Wang, Shen, Xie, Neelamkavil and Pardasani2002; Atilola et al., Reference Atilola, Tomko and Linsey2016). Therefore, many conceptual design models have been proposed as the theoretical foundations of computer-aided conceptual design systems (van Dijk, Reference van Dijk1995; Komoto & Tomiyama, Reference Komoto and Tomiyama2012;), for example, the need–function–principle–system model (Chen, Zhao, et al., Reference Chen, Zhao, Xie and Zhang2015), the function–behavior–structure models (Gero, Reference Gero1990; Gero & Kannengiesser, Reference Gero and Kannengiesser2004; Goel, Reference Goel2013), the need–function–physical solution model, the Pahl and Beitz model (Pahl & Beitz, Reference Pahl and Beitz2013) and the function–behavior–state model (Umeda & Ishii, Reference Umeda and Ishii1996). These conceptual design models can not only improve our understanding of the conceptual design process but also serve as a theoretical foundation for design researches. All the conceptual design models are trying to elaborate how to map the desired function into an existing solution concept or how a concept in the intentional world can be gradually transformed into a concept in the physical world (Chen, Zhang, et al., Reference Chen, Zhang, Xie and Zhao2015).
These conceptual design models, especially the function–behavior–structure framework, have been adopted in analogies to capture semantic information in design protocol research (Qian & Gero, Reference Qian and Gero1996; Kan & Gero, Reference Kan, Gero, McDonnell and Lloyd2009; Pourmohamadi & Gero, Reference Pourmohamadi and Gero2011). Analogies are often used in idea generation to transfer knowledge through analogical mapping from a source domain containing the analogous phenomena to a target domain containing the problem to be solved by the analogy (Holyoak & Thagard, Reference Holyoak and Thagard1995; Mak & Shu, Reference Mak and Shu2004). There are three dimensions to differentiate analogies into several types: the transfer distance, the transfer content, and the hint paradigm (Casakin, Reference Casakin2004; Kalogerakis et al., Reference Kalogerakis, Lüthje and Herstatt2010). Analogies can be described by the conceptual distance between the source and the target (Chai et al., Reference Chai, Cen, Ruan, Yang and Li2015). According to the findings by Dunbar (Reference Dunbar, Ward, Smith and Viad1997) and Kalogerakis et al. (Reference Kalogerakis, Lüthje and Herstatt2010), the analogies are segregated into three categories. Analogies within one product category represent near analogies. If the base and the target of the analogy stem from different product categories, the distance of analogy is considered medium. If the base and the target of the analogy stem from nonproduct categories (e.g., nature), the distance of analogy is considered far. According to dichotomy, near and medium analogies belong to within-domain/local analogies in which designers receive surface similar human-engineered examples, and far analogy belongs to between-domain/distant analogy in which designers receive surface dissimilar biological examples (Casakin, Reference Casakin2004; Christensen & Schunn, Reference Christensen and Schunn2007; Wilson et al., Reference Wilson, Rosen, Nelson and Yen2010). Analogies can also be described by the type of solution element being transferred from the base domain to the target problem. In this dimension the analogical transfers are assigned to two categories: transfers of technological solutions or functional principles; and transfers of shapes and design arrangements (Kalogerakis et al., Reference Kalogerakis, Lüthje and Herstatt2010). Analogies can occur with the provision of sources containing instructional sentences, key words, or visual hints (pictures; Malaga, Reference Malaga2000; Casakin, Reference Casakin2004; Schwert, Reference Schwert2007).
2.2. BID research
In BID, designers use analogies between biological phenomena and design problems to develop design solutions (Mak & Shu, Reference Mak and Shu2004; Nagel et al., Reference Nagel, Nagel, Stone and McAdams2010). Since nature has spent millions of years developing these economical solutions, it seems rational that designers should take a look to nature for energy-efficient answers to similar problems raised by their technologies (Wilson, Reference Wilson2008). According to the dimension of the transfer distance, BID belongs to the far analogy, between-domain analogy, or distant analogy. The literature in the design sciences contains many case studies of BID (Autumn et al., Reference Autumn, Sitti, Liang, Peattie, Hansen, Sponberg, Kenny, Fearing, Israelachvii and Full2002; Vincent & Mann, Reference Vincent and Mann2002; Nakrani & Tovey, Reference Nakrani and Tovey2003; Lingbo et al., Reference Lingbo, Jianwen, Zhuqing, Hess and Wong2005; Floyd et al., Reference Floyd, Keegan, Palmisano and Sitti2006; Lahr et al., Reference Lahr, Yi and Hong2016). Several researchers have begun developing systematic approaches for supporting BID (Bruck et al., Reference Bruck, Gershon, Golden, Gupta, Gyger, Magrab and Spranklin2006; Helms et al. Reference Helms, Vattam and Goel2009; Vandevenne et al., Reference Vandevenne, Verhaegen, Dewulf and Duflou2014). For example, SAPPHIRE tool (Chakrabarti et al., Reference Chakrabarti, Sarkar, Leelavathamma and Nataraju2005) provides descriptions of the structures, behaviors, and functions of biological and industrial designs previously used in BID. It also uses verbs to describe industrial design problems, and retrieves biological and industrial designs based on matches between the verbs used in the problem descriptions. BID has also been developed as an intelligent search mechanism that uses a functional taxonomy to direct search and a formal modeling notation for annotating relevant search targets (Spiliopoulou et al., Reference Spiliopoulou, Rugaber, Goel, Chen, Wiltgen and Jagannathan2015). More details on BID can be found in Goel et al. (Reference Goel, McAdams and Stone2015).
2.3. Biological analogies evaluation research
Several metrics for measuring ideation effectiveness have previously been proposed, identifying novelty, variety, quantity, and quality to characterize sets of designs and the degree to which they describe design space exploration and expansion (Nelson et al., Reference Nelson, Wilson, Rosen and Yen2009; Wilson et al., Reference Wilson, Rosen, Nelson and Yen2010; Atilola et al., Reference Atilola, Tomko and Linsey2016). Wilson et al. (Reference Wilson, Rosen, Nelson and Yen2010) evaluated the effect of surface dissimilar analogies in the form of biological examples on the ideation process. They found that exposure to biological examples in idea generation can increase the novelty of design ideas generated after exposure without inhibiting the variety of the design ideas generated, unlike human-engineered examples, which resulted in decreased variety. This increase in novelty can be correlated to a broadening of the design space of the designer (Shah et al., Reference Shah, Smith and Vargas-Hernandez2003). This agrees with other work in the literature where the distantly related information presented after participants had begun problem solving increased the novelty (Tseng et al., Reference Tseng, Moss, Cagan and Kotovsky2008). However, the use of distant analogies does have challenges. If the source examples are too distant from the design problem, they could impede the design process (Fu et al., Reference Fu, Chan, Cagan and Kotovsky2013). Wilson et al. (Reference Wilson, Rosen, Nelson and Yen2010) found that participants receiving human-engineered examples produced more novel designs than those receiving biological examples. The authors explained that because surface dissimilar analogies have a larger conceptual distance to the design problem, participants are less likely to view them as relevant and, thus, less likely to utilize them. In this case, the larger conceptual distance of the surface dissimilar examples leads to a lower utilization rate versus that of the surface similar examples where attributes can be easily transferred. However, there has been little empirical evidence on using sketching itself and related methods for measuring ideation effectiveness. In this research, we believe that sketches can provide a source of metrics for describing solution concepts, as studies on sketching always presented models for the general sketching process and effective methods to improve sketch quality (Sun et al., Reference Sun, Xiang, Chai, Wang and Huang2014).
In this paper, we extend the work of Wilson et al. (Reference Wilson, Rosen, Nelson and Yen2010) and prior literature by assessing the effect of biological examples on the sketches of solution concept objectively and evaluating the effect of these analogs on the perceptual matching relationship between desired function and the sketches of solution concept subjectively.
3. METHODS AND EXPERIMENTAL MATERIALS
3.1. Methods
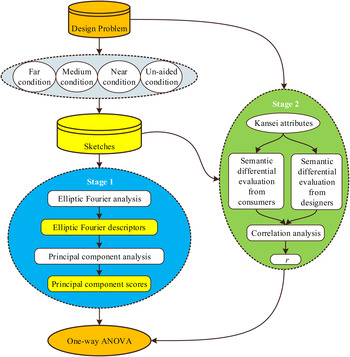
In this study, the EFA and perceptual matching methods were used to evaluate bioinspired sketching in conceptual designs. These methods were applied to the case of shape design of an electrical car to test the two hypotheses. The conceptual framework is shown in Figure 1.
Conceptual framework of the proposed methods.

3.1.1. Selected type of sketches
Sketching is useful as a way to mentally offload concepts during complex design activity (Römer et al., Reference Römer, Leinert and Sachse2000). We can consider sketches from several perspectives. Three types of sketches can be classified by their intended purpose: the thinking sketch serving as a reflective medium, the prescriptive sketch acting as a blueprint for design work, and the talking sketch supporting design collaboration (Ferguson, Reference Ferguson1994). Five categories of sketches can be labeled based on the physical elements of sketches as follows: Level 1, a simple monochrome line drawing that does not include shading or annotations; Level 2, a detailed monochrome line drawing with annotations but no shading; Level 3, a Level 2 drawing with shading to suggest three-dimensional form; Level 4, a Level 3 drawing with more gradations of shading and possibly color to emphasize three-dimensional form; Level 5, the most “realistic” type of sketch includes extensive shading and annotation (Rodgers et al., Reference Rodgers, Green and Mcgown2000). In this paper, we collected the prescriptive sketches of Level 1 for getting normalized shape data.
3.1.2. Elliptic Fourier shape analysis
To our knowledge, there has been little design research concentrating on sketching or shape analysis using objective measures, although there is a trend for testing the impacts of independent variable in design study through metrics that are relatively objective (Vasconcelos & Crilly, Reference Vasconcelos and Crilly2016). The relatively objective metrics used in design studies are limited to the number of ideas, the number of final concepts, the number of different types of concepts, and the repetition of key features from the stimuli (Vasconcelos & Crilly, Reference Vasconcelos and Crilly2016). Shape recognition has been very popular in the field of image recognition recently (Asano & Honda, Reference Asano and Honda2010). There are many effective objective methods that have been proposed for shape description in the field of pattern recognition and computer vision (Latecki & Lakämper, Reference Latecki and Lakämper1999; Direkolu & Nixon, Reference Direkolu and Nixon2011). Current methods for shape description can be classified into two categories: contour based and region based (Janan & Brady, Reference Janan and Brady2015). These methods may provide many objective measures for design research. To date, this is the first reported study that tests the impacts of external stimuli in the conceptual design through EFDs of sketches.
As a classical method proposed for contour-based shape representation, EFDs can delineate any type of shape with a closed two-dimensional contour (Kuhl & Giardina, Reference Kuhl and Giardina1982), and have been effectively applied to the evaluation of various biological shapes in animals and plants (Iwata & Ukai, Reference Iwata and Ukai2006; Neto et al., Reference Neto, Meyer, Jones and Samal2006; Smith, Reference Smith2015). This method describes the entire shape mathematically through transforming coordinate information concerning its contour into elliptic Fourier coefficients (Iwata et al., Reference Iwata, Nesumi, Ninomiya, Takano and Ukai2002). The closed-contour was first defined with differential chain code, and then EFA decomposes the contour into a series of closed curves (harmonics) that vary in size, shape, and orientation. Each harmonic is described by four Fourier coefficients, two each for the x and y axes, generating a total of 4n coefficients labeled a n , b n , c n , and d n , where n is the number of harmonics (Crampton, Reference Crampton1995; Neto et al., Reference Neto, Meyer, Jones and Samal2006). The first, largest harmonic describes the overall length of the shape, and the following harmonics provide increasingly detailed information about its complexity (Carlo et al., Reference Carlo, Barbeitos and Lasker2011). PCA of the coefficients can then extract the independent shape characteristics, and make it possible to analyze the shape quantitatively by using the component scores as ordinary quantitative characters (Rohlf & Archie, Reference Rohlf and Archie1984).
For each harmonic, the nth set of four harmonic coefficients a n , b n , c n , and d n was defined as
 $$a_n = {T \over {2n^2{\rm \pi} ^2}} \sum\limits_{p = 1}^K {\displaystyle{{\Delta x_p} \over {\Delta t_p}}} \left[ \cos \left( {2n{\rm \pi} t_p \over T} \right) - \cos \left( {2n{\rm \pi} t_{\,p - 1} \over T} \right) \right],$$
 $$b_n = {T \over 2n^2{\rm \pi} ^2} \sum\limits_{p = 1}^K {\displaystyle{{\Delta x_p} \over {\Delta t_p}}} \left[ \sin \left( {2n{\rm \pi} t_p \over T} \right) - \sin \left( {2n{\rm \pi} t_{p - 1} \over T} \right) \right],$$
 $$c_n = {T \over 2n^2{\rm \pi} ^2} \sum\limits_{p = 1}^{K} {\Delta y_p \over \Delta t_p} \left[ \cos \left( {2n{\rm \pi} t_p \over T} \right) - \cos \left( {2n{\rm \pi} t_p - 1 \over T} \right) \right],$$
 $$d_n = {T \over 2n^2{\rm \pi} ^2} \sum\limits_{p = 1}^{K} {\Delta y_p \over \Delta t_p} \left[ \sin \left( {2n{\rm \pi} t_p \over T} \right) - \sin \left( {2n{\rm \pi} t_{p - 1} \over T} \right) \right],$$
where t p is the number of steps required to traverse the first p components or links of the chain code; Δx p and Δy p are the spatial changes in the x and y projections of the chain code, respectively, at link p, the values of which may be 1, 0, or –1, depending on the orientation of link p; and Δt p is the step change required to traverse link p of the chain code.
3.1.3. Perceptual matching
Perceptual matching that has been discussed in many psychological works is a term generally used to describe the strength of the correlation between a phenomenon and the human response it elicits (Krueger, Reference Krueger1978; Hsu et al., Reference Hsu, Chuang and Chang2000; Luo, Fu, & Korvenmaa, Reference Luo, Fu and Korvenmaa2012). Perceptual matching can be used to describe the relationship between the perception that designers intend to deliver through product design and the consumer perception evoked by the product. Luo, Fu, and Korvenmaa (Reference Luo, Fu and Korvenmaa2012) proposed a visual matching and affective matching integrated perceptual matching procedure to evaluate beverage bottle designs. During affective matching, a semantic differential experiment was executed to quantify the achieved feeling and target feeling of each bottle design into specific values. Then, the correlation between the achieved feeling and target feeling of each design was evaluated by a correlation analysis. Luo, Fu, and Zhou (Reference Luo, Fu and Zhou2012) also proposed a methodology for evaluating the perceptual matching quality between the shape design styles of cars and wheel hubs through matching evaluation by ranking method, and semantic differential evaluation of wheels and car bodies using Kansei attributes identified at first. Although the results were encouraging, their researches only used perceptual matching for evaluating the existing products.
In this study, we used a perceptual matching procedure to test the impacts of biological examples in sketches of conceptual design subjectively. The perceptual matching procedure contains a spanning of the semantic space, a semantic differential experiment to acquire the subjects’ perceptions of the design problem (desired function) and the design results (sketches), and a correlation analysis to evaluate the correlation between the design problem and the design results.
3.1.4. Evaluation procedure
In testing Hypotheses 1 and 2, designers were placed into one of four potential conditions: a far condition in which participants received biological examples after rating the design problem; a medium condition in which participants received human-engineered examples from different product categories after rating the design problem; a near condition in which participants received human-engineered examples within one product category after rating the design problem; and an unaided condition where no example was presented. Then, the evaluation procedure was implemented as follows:
-
Stage 1: The objective evaluation began with an EFA in which the contours of sketches can be transformed into EFDs. In a subsequent PCA, the EFDs were summarized. Then, the principal component scores were collected for examining the effects of stimuli with one-way ANOVA and post hoc analysis.
-
Stage 2: The subjective evaluation began with a semantic differential experiment to quantify the designer perceptions of the design problem and consumer perceptions of each car design into specific values of Kansei attributes. Through a correlation analysis, the correlation between the consumer perceptions of sketches and designer perceptions of the design problem was evaluated. Finally, to detect variations of Pearson r value among the four experimental conditions, one-way ANOVA and post hoc analysis were performed.
3.2. Participants
Twenty-eight first-year postgraduate students (11 male, 17 female) majoring in industrial design were recruited in this design experiment as designers. To be eligible for the study, students needed well-trained sketching skills to complete the conceptual design. They were volunteers and did not receive payment for participation in the study. Twenty young white-collar single women (range = 26–30 years, M = 27.5, SD = 1.8) were recruited as consumers to rate the sketches of conceptual design.
3.3. Materials
3.3.1. Design problem
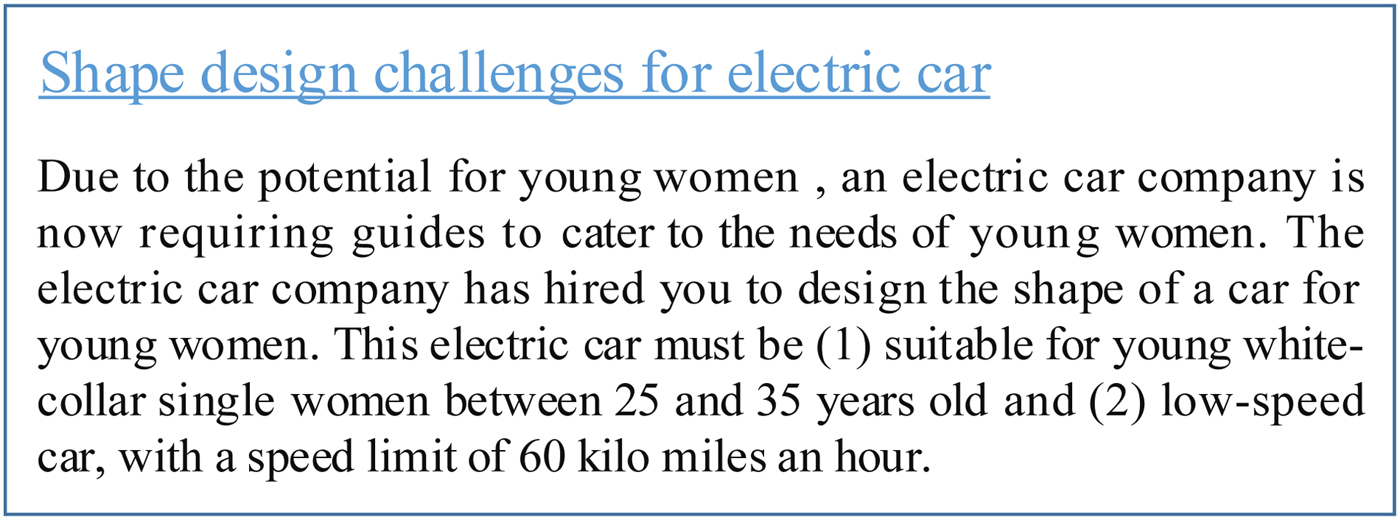
All participants were asked to individually solve the same design problem. The design problem given in this study is displayed in Figure 2. The design problems used were written in Chinese and are approximately translated into English in this paper.
Design problem for study.

3.3.2. Spanning of the semantic space
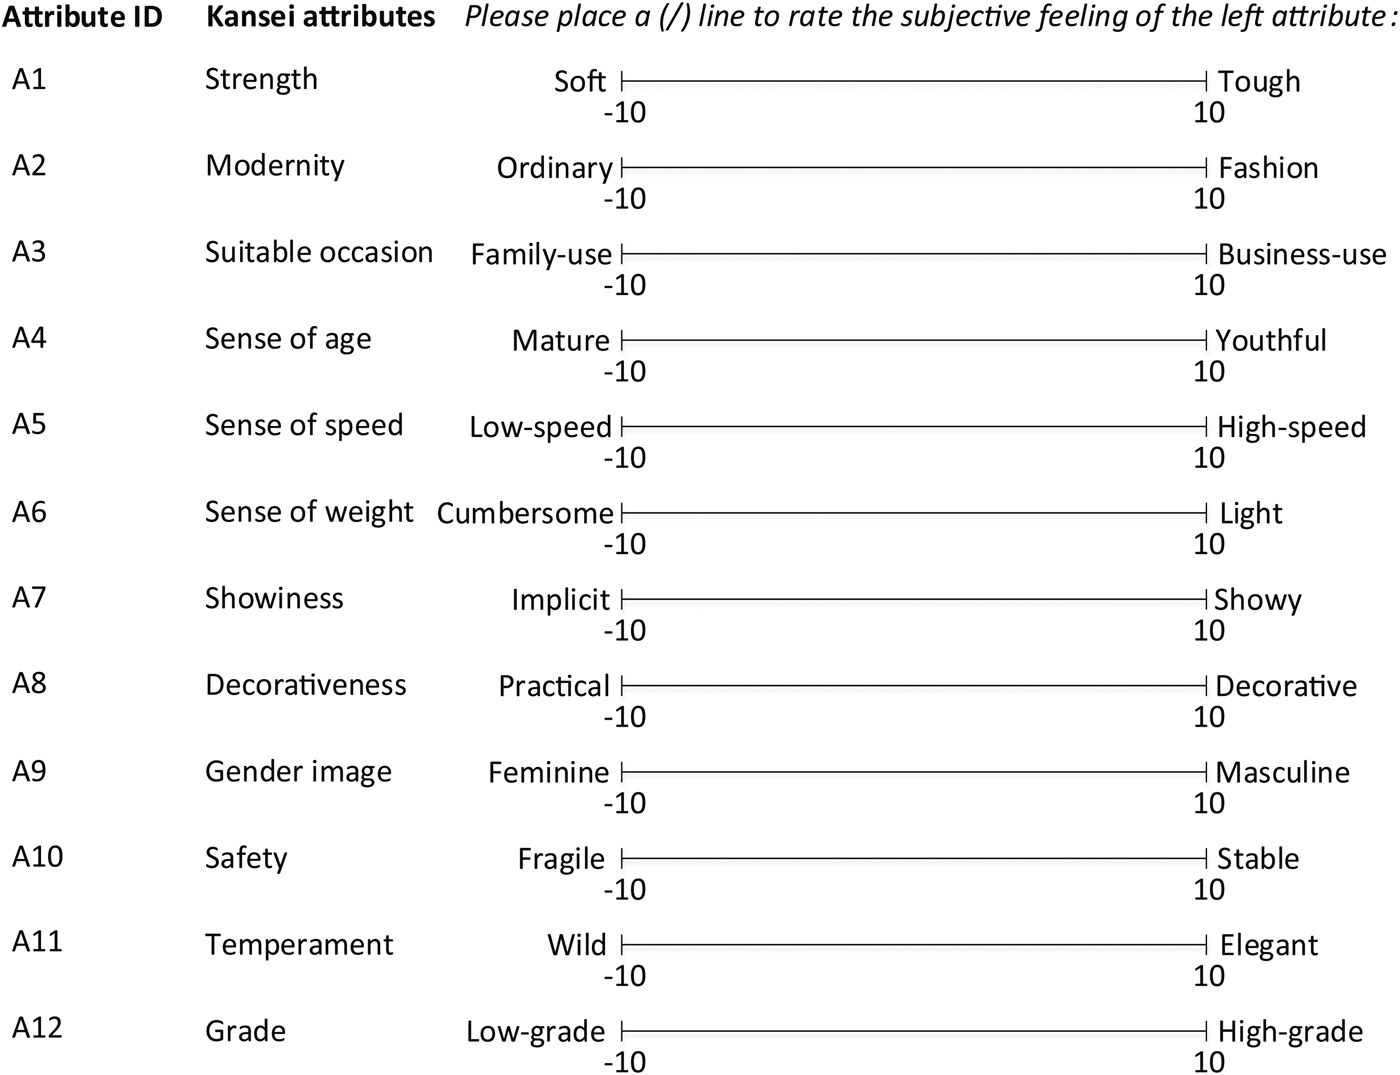
Before the experiment, to define an efficient semantic space, we used 12 Kansei attributes within three dimensions that describe the design style, function, and market position of the car design in the form of a pair of bipolar adjectives (Yan et al., Reference Yan, Huynh, Murai and Nakamori2008). The 12 Kansei attributes were first proposed by Luo, Fu, and Zhou (Reference Luo, Fu and Zhou2012). We designed a visual analog scale (Viscusi et al., Reference Viscusi, Bergman, Novak, Faulkner, Palmiero, Powell and Shaffer2011; Chen et al., Reference Chen, Yang, Wang and Gong2016) for the semantic differential evaluation with 12 items representing 12 Kansei attributes, respectively, as shown in Figure 3. The Kansei words used in the experiment were written in Chinese and are approximately translated into English in this paper.
The scale of measuring subjective perceptions.

3.3.3. Source example selection
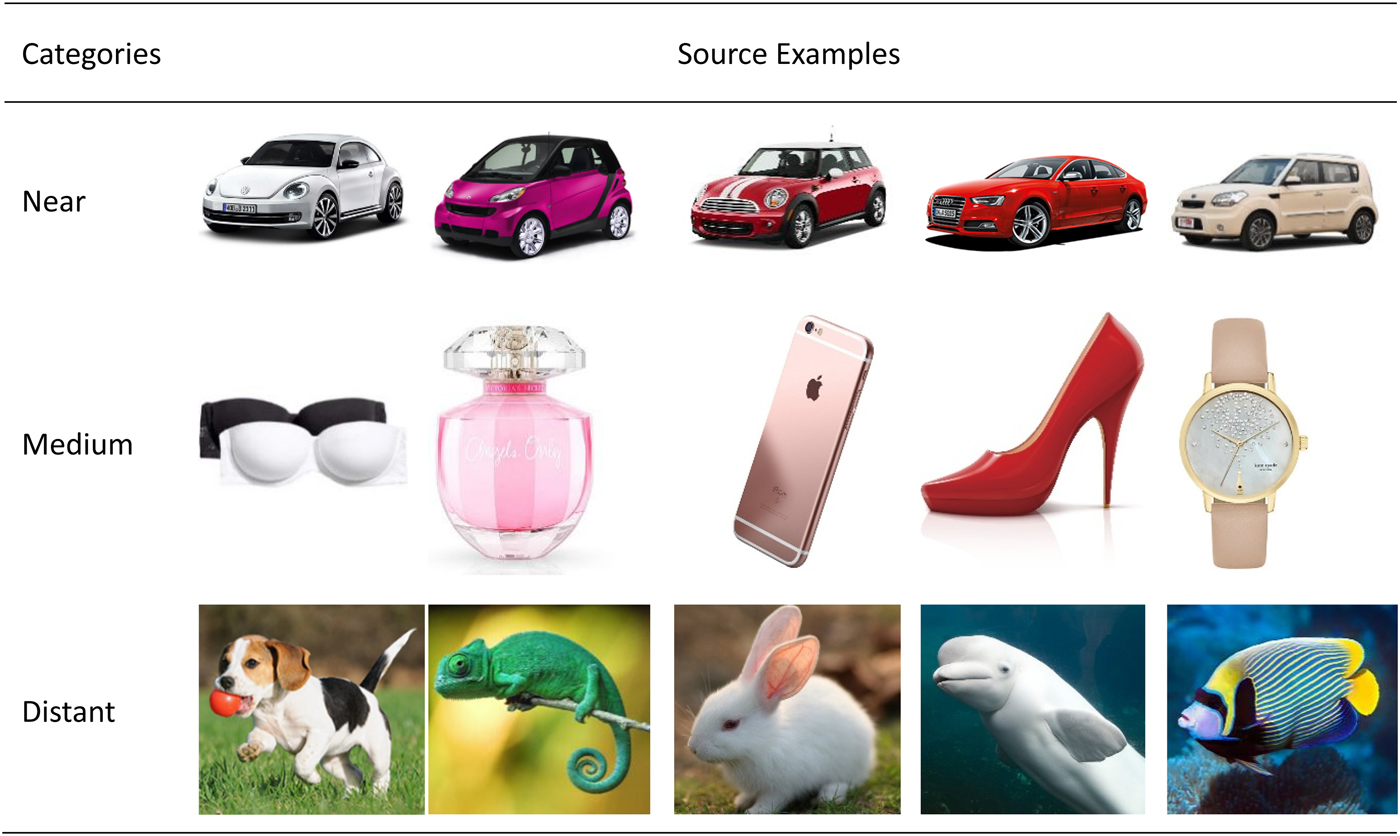
We selected the source analogs from near, medium, and distant source examples, which correspond to human-engineered examples within one product category (car), human-engineered examples from different product categories, and biological examples, respectively. The source examples were intentionally chosen to match each other very closely in design problem (desired function). Physical prototypes involve more superficial similarity, as compared with sketches (Christensen & Schunn, Reference Christensen and Schunn2007), which may be good for the task of car shape design (solving visual analogical problem) in this study. Moreover, using realistic source examples can also exclude the impact of the level of abstraction for the representation of prior knowledge on visual analogical problem solving (Christensen & Schunn, Reference Christensen and Schunn2007; Linsey et al., Reference Linsey, Wood and Markman2008; Cardoso & Badke-Schaub, Reference Cardoso and Badke-Schaub2011).
The realistic source examples for visual analogies in this study were selected in a two-phase process. First, five graduate students of industrial design chose 150 realistic pictures on the Internet according to the high soundness of source examples in the context of car design for young white-collar single women. Soundness represents the degree to which inferences from one story would hold for the other (Gentner et al., Reference Gentner, Rattermann and Forbus1993; Chai et al., Reference Chai, Cen, Ruan, Yang and Li2015). Every teacher was required to choose 30 pictures, which consisted of 10 cars, 10 products, and 10 biological examples. In the second phase, another five college teachers of industrial design were required to select inspirational pictures from 150 realistic pictures for design problem (Fig. 2), which consisted of 50 cars, 50 products, and 50 biological examples. Each teacher selected 10 pictures for each category. According to the co-occurrence rate of pictures in each category, the number of source examples was reduced to 15, numbering 5 for each category, as shown in Figure 4.
Source examples selected for each category.

3.3.4. Paper and pen
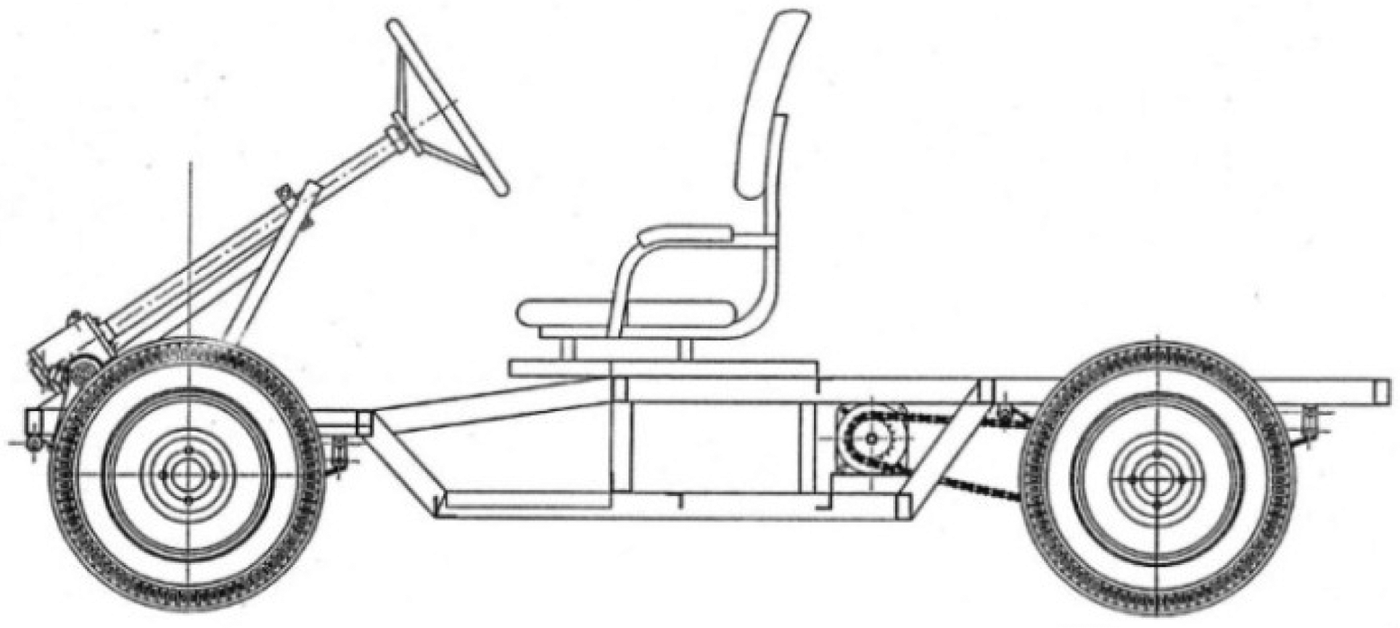
In order to get prescriptive and standardized sketches, we provided every participant with a certain amount of A4 paper and a black pen. We printed the side view of the chassis of the electric car on each A4 paper with a shallow color. Subjects were required to sketch a simple monochrome line drawing that does not include shading or annotations (Level 1) on the paper, that is, the side view of conceptual design of electric cars on the chassis. Figure 5 shows the chassis of the electric car.
The chassis of the electric car.

3.4. Experimental protocol
In order to test the proposed two hypotheses, a study was performed in which participants generated sketches of conceptual designs to solve design requirements. Source examples (stimuli) can be presented to designers at different moments during the design process (Vasconcelos & Crilly, Reference Vasconcelos and Crilly2016), and the moment plays an important role in idea generation (Sio et al., Reference Sio, Kotovsky and Cagan2015). Many researchers have been trying recently to find out the best moment of presenting stimuli. However, their conclusions were not consistent (Moss et al., Reference Moss, Kotovsky and Cagan2007; Siangliulue et al., Reference Siangliulue, Chan, Gajos and Dow2015; Sio et al., Reference Sio, Kotovsky and Cagan2015). To exclude the impact of the moment of presenting stimuli, designers will receive stimuli simultaneously during the design process.
The design study was carried out in four adjacent classrooms of one teaching building. Participants were randomly assigned to either the distant analogy (N = 7), the medium analogy (N = 7), the near analogy (N = 7), or the unaided (N = 7) condition by the classroom the participants entered. The assigned condition was designated by the classroom the participants entered. The distant, medium, and near source examples are shown in Figure 4. At the onset of the study, experimenters gave each designer a design problem, five sheets of A4 paper, and a black pen. During the design brief, the participants were instructed to generate sketches of conceptual design on A4 paper printed with the chassis of the electric car, and they were required to use up all the paper that they received. Each paper can only contain one distinct design sketch. After instructions, the participants were required to utilize the same semantic differential scale (Fig. 3) to rate the design problem for 5 min. Then they were given their respective source examples or no example for concept generation. When the participants were given their respective design aids (except for the unaided condition), they were verbally instructed to generate design concepts by means of analogical reasoning.
The design of the experiment was a Condition (4) × Designer (7) × Sketch (5) between-subjects design, amounting to 140 sketches collected. After the experiment, comparisons of sketches were made between groups across different conditions.
3.5. Data analysis
Before objective evaluation, the images were processed in Photoshop CS6 to create a black-and-white image, in which the background was white and the entire sketch black. For objective evaluation, the black and white images were processed and analyzed using SHAPE, ver. 1.3 (Iwata & Ukai, Reference Iwata and Ukai2006), a package of programs that identifies the outline of the sketch and generates EFDs. At first, a program named ChainCoder extracted the contours of objects from black and white images and stored the relevant information as chain code (Freeman, Reference Freeman1974). Then, a program named Chc2Nef provided the normalized EFDs from chain-coded contours. The coefficients of EFDs that were normalized to avoid variations related to the size, rotation, and starting point of the contour traces, were calculated through the procedure on the ellipse of the first harmonic (Kuhl & Giardina, Reference Kuhl and Giardina1982). To summarize the information contained in the coefficients of each group, we performed PCA based on a variance–covariance matrix using program PrinComp from the SHAPE package. It is possible to analyze the shape quantitatively by using the principal component scores of the EFDs as ordinary quantitative characteristics (Rohlf & Archie, Reference Rohlf and Archie1984; Furuta et al., Reference Furuta, Ninomiya, Takahashi, Ohmori and Yasuo1995; Iwata et al., Reference Iwata, Niikura, Matsuura, Takano and Ukai2000; Yoshioka et al., Reference Yoshioka, Iwata, Ohsawa and Ninomiya2004). Thus, the principal component scores generated by PrinComp were used as characteristics of sketches in the following analyses.
For subjective evaluation, SPSS V16 (SPSS Inc., Chicago) was used for performing the correlation analyses to evaluate the correlations between the design problem and the design results. The obtained Pearson correlation coefficient (Pearson r) is represented for the strength of consistency of each design result from the point of view of the consumers’ affective perceptions and corresponding design problem from the point of view of the designers’ affective perceptions.
To evaluate the significance of differences of four experimental conditions in terms of principal component scores of EFDs and Pearson correlation coefficients, one-way ANOVA was conducted in SPSS. The Tukey multiple comparison tests were used for all post hoc analysis of significant effects.
4. RESULTS
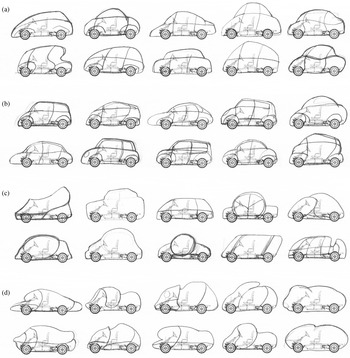
Figure 6 displays some examples of sketches generated in this study. Statistical analyses were conducted to determine significant differences among the sketches from objective and subjective perspectives.
Sketches samples generated by students. (a) Receiving no example; (b) receiving human-engineered examples within one product category; (c) receiving human-engineered examples from different product categories; and (d) receiving biological examples.

4.1. Results of objective evaluation
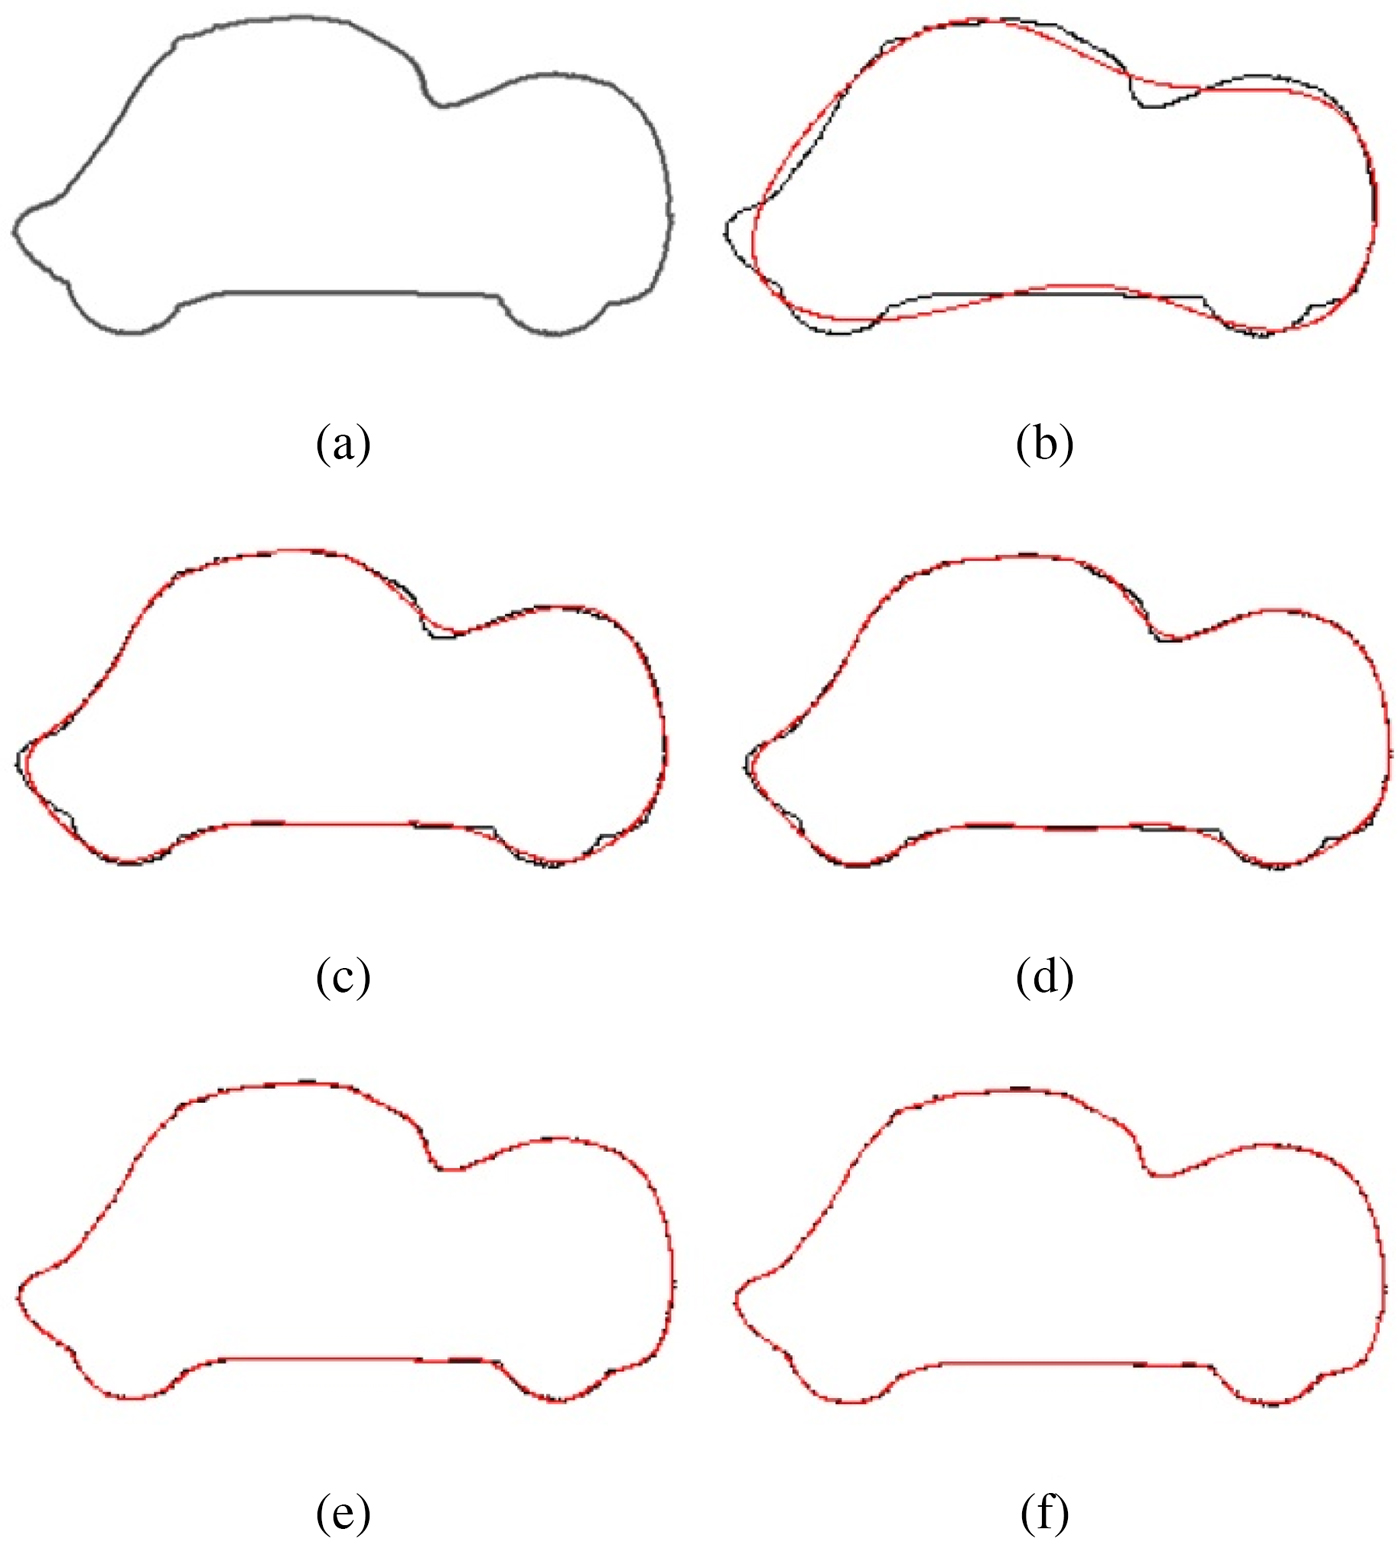
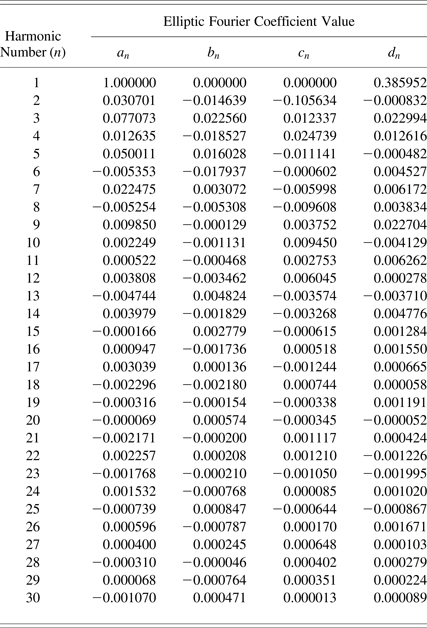
Figure 7 shows an EF approximation to the shape of a sketch using the set of coefficients a n , b n , c n , and d n , generated with the 4th, 8th, 10th, 20th, and 30th harmonics. Crampton (Reference Crampton1995) suggests that eight harmonics are usually sufficient to capture most of the shape and variance in a shape. However, sketches are complex, and higher level harmonics were necessary to fully recreate the shape of sketches. In this study, EFDs of 30 harmonics successfully captured most of the sketches (Fig. 7). We approximated each sketch by the first 30 harmonics, corresponding to the 117 coefficients of normalized EFDs, because the normalized a 1, b 1, and c 1 are the constant coefficients (Iwata et al., Reference Iwata, Nesumi, Ninomiya, Takano and Ukai2002; Neto et al., Reference Neto, Meyer, Jones and Samal2006). The EF coefficient values for the 30 sets of harmonics for closed contour of one randomly selected sketch are shown in Table 1.
Elliptic Fourier (EF) shape approximations for a sketch. (a) Original chain-coded contour, (b) 1st + 2nd + 3rd + 4th EF, (c) 1st + · · · + 8th EF harmonics, (d) 1st + · · · + 10th EF harmonics, (e) 1st + · · · + 20th EF harmonics, and (f) 1st + · · · + 30th EF harmonics. (The original contour coded by chain-code is drawn by a black line, and the contour reconstructed from elliptic Fourier descriptors is shown by a red line.)

Sample normalized elliptic Fourier coefficients for one randomly selected sketch

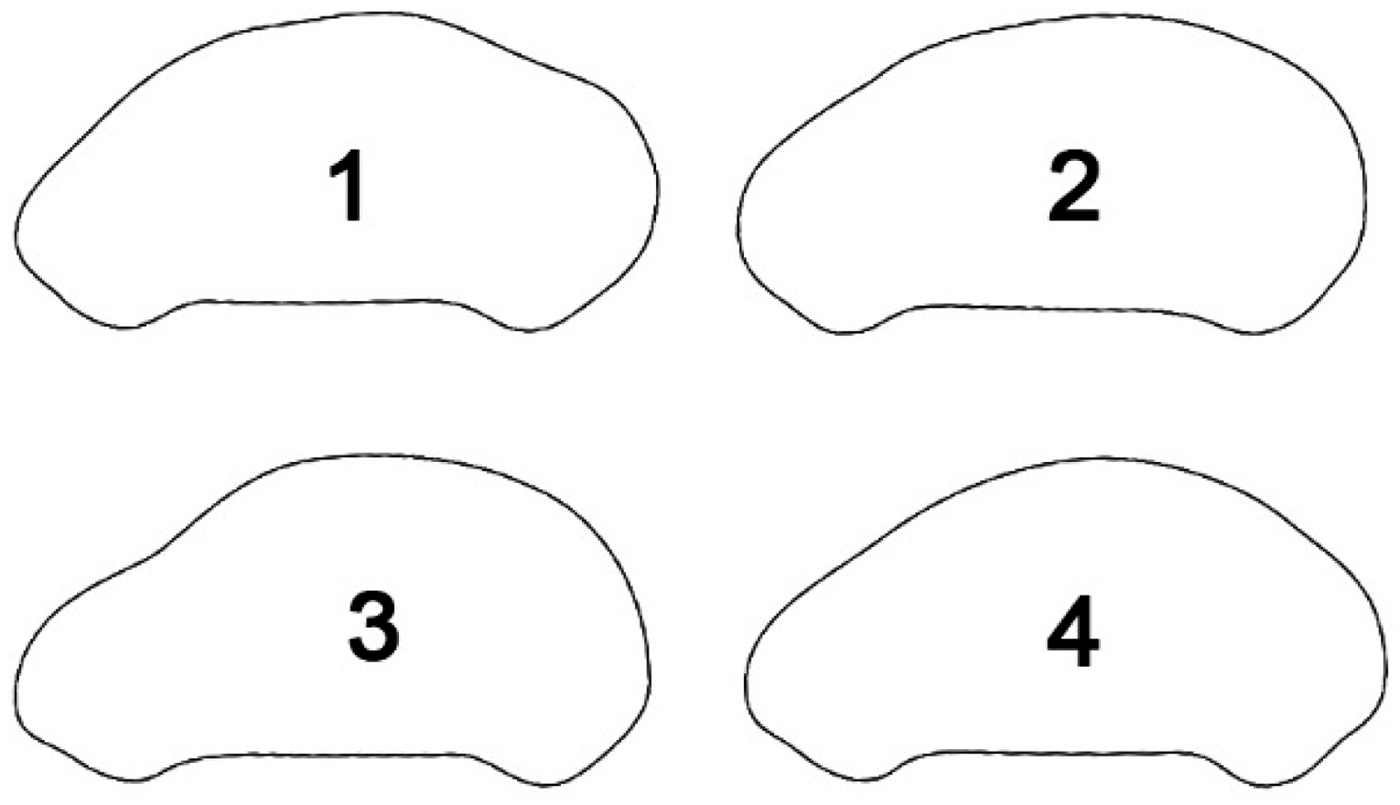
The standardized elliptic Fourier coefficients of 140 sketches (28 designers × 5 sketches) from the four conditions were calculated. The mean sketch shape of each condition was then drawn using the mean values of the standardized Fourier coefficients within each experimental condition, as shown in Figure 8.
Mean sketch shapes of the four experimental conditions in this study. 1, far condition; 2, medium condition; 3, near condition; and 4, unaided condition.

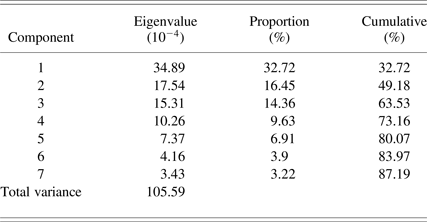
PCA was performed using 117 EF coefficients of each sketch to produce a reduced set with the best discriminatory power. The cumulative contribution rates were calculated to determine the number of dimensions. In this study, the dimensions of principal components were selected with the cumulative contribution beyond 85% (Fan et al., Reference Fan, Haihong and Yuan2012). The first seven principal components of the EFDs for the sketches provide a good summary of the data, accounting for 87.2 % of the total variance (Table 2).
Eigenvalues and contributions of principal components of the EFDs

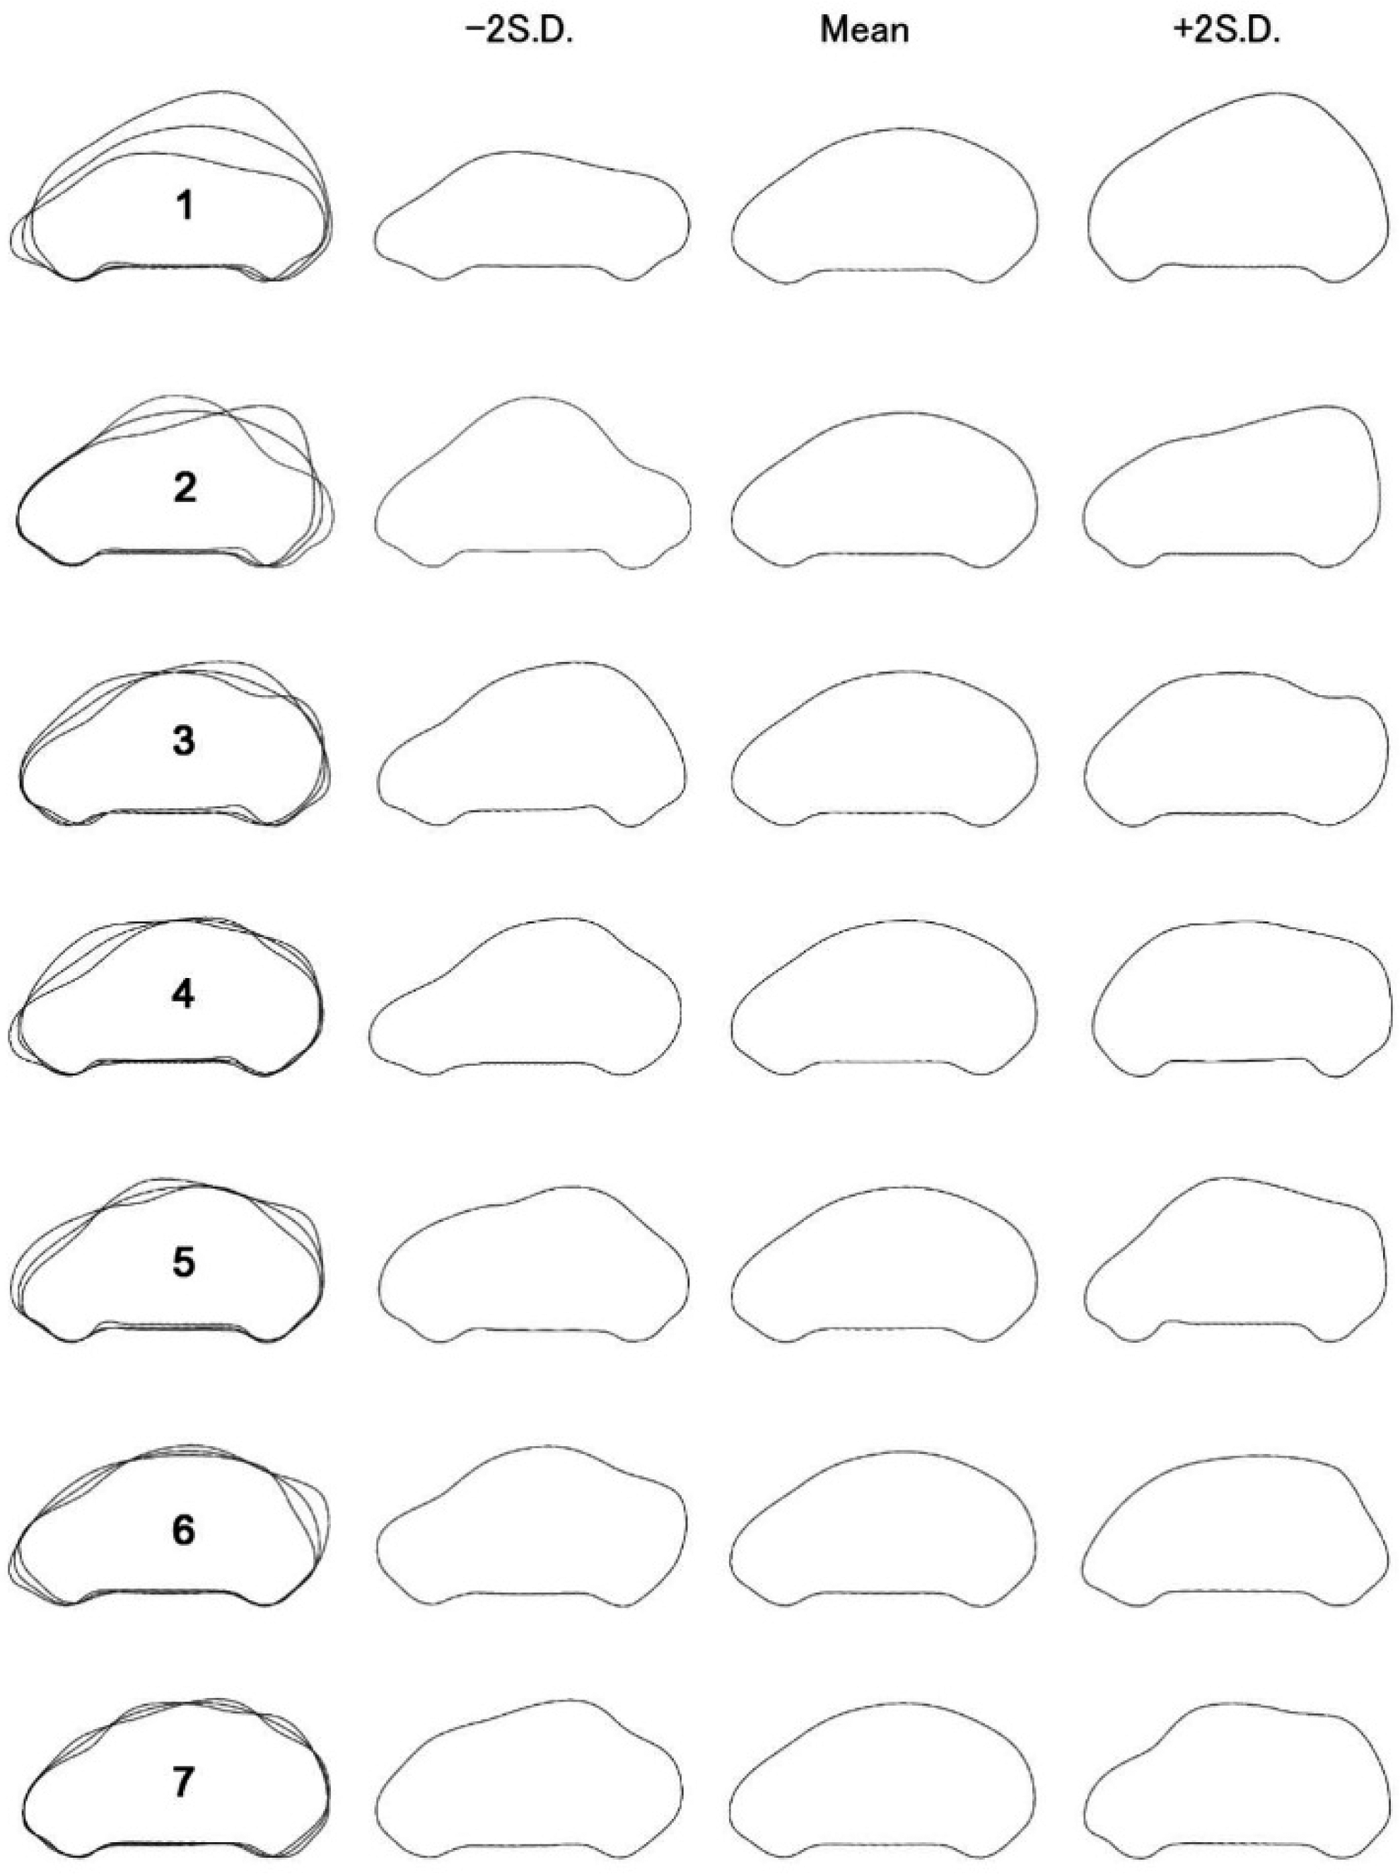
The effect of each principal component on car shape was visualized (Fig. 9). For this visualization, the coefficients of the EFDs were recalculated inversely using an eigenvector matrix, letting the score on a particular principal component be equal to the mean±2 SD, while the scores on the remaining components remained at the mean. Then the contour shape for each score condition was reconstructed based on the recalculated coefficients (Yoshioka et al., Reference Yoshioka, Iwata, Ohsawa and Ninomiya2004).
Effects of each principal component on shape of sketching. The numbers 1–7 correspond to the first to seventh principal components, respectively. Each column shows the case where the score takes –2 SD, mean, or +2 SD as labeled, and the left-hand column shows the overlaid drawings of all three cases.

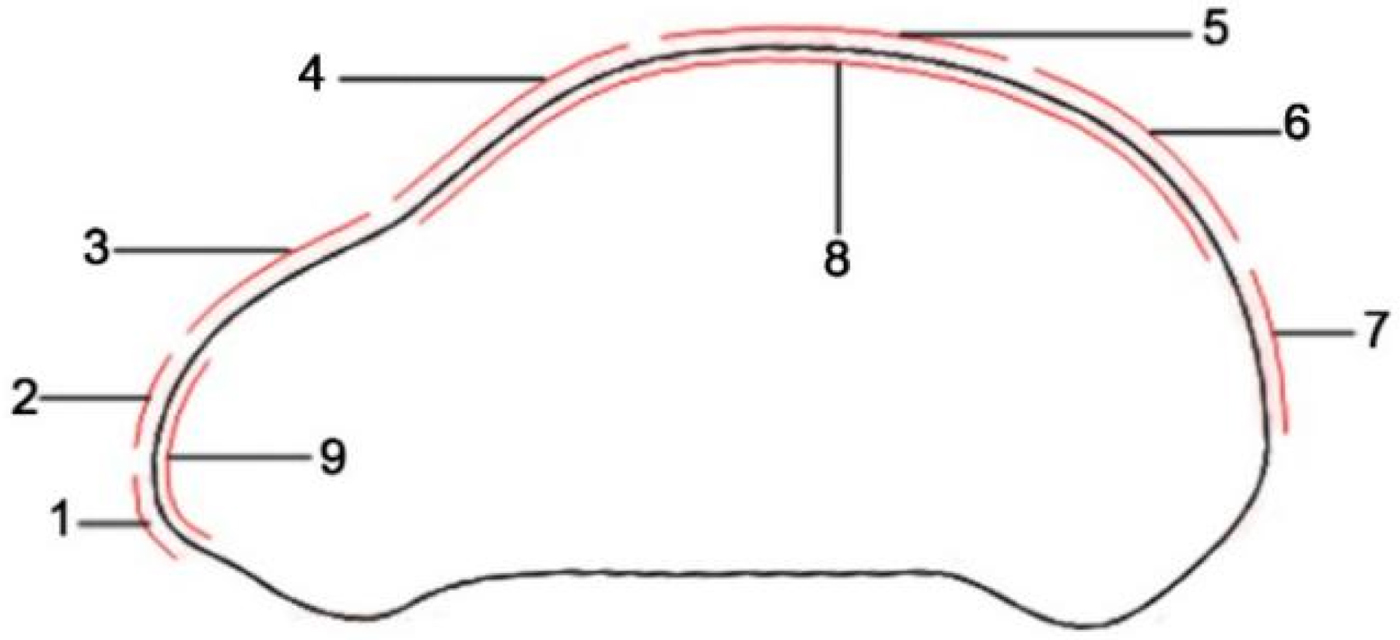
These reconstructed shapes indicate that the first principal component is a good measure of the aspect ratio (Fig. 9). According to the brief introduction of car profile in Figure 10, the second component is associated with the difference of curvature and swelling in roof, rear screen, and rear mask; the third component is related to the curvature and swelling of bonnet, roofline, and rear mask; the fourth component expresses the curvature and swelling of front screen, bonnet, and front face; and the fifth component expresses the curvature and swelling of the upper mask, front screen, and rear mask. The sixth component is related to the curvature and swelling of the front face, front screen, and rear mask. The seventh component is related to the curvature and swelling of roofline. Because all sketches are based on the same chassis of the electric car, we will ignore the change of bottom chassis outline.
Brief introduction of car profile. 1, lower mask; 2, upper mask; 3, bonnet; 4, front screen; 5, roof; 6, rear screen; 7, rear mask; 8, roofline; and 9, front face.

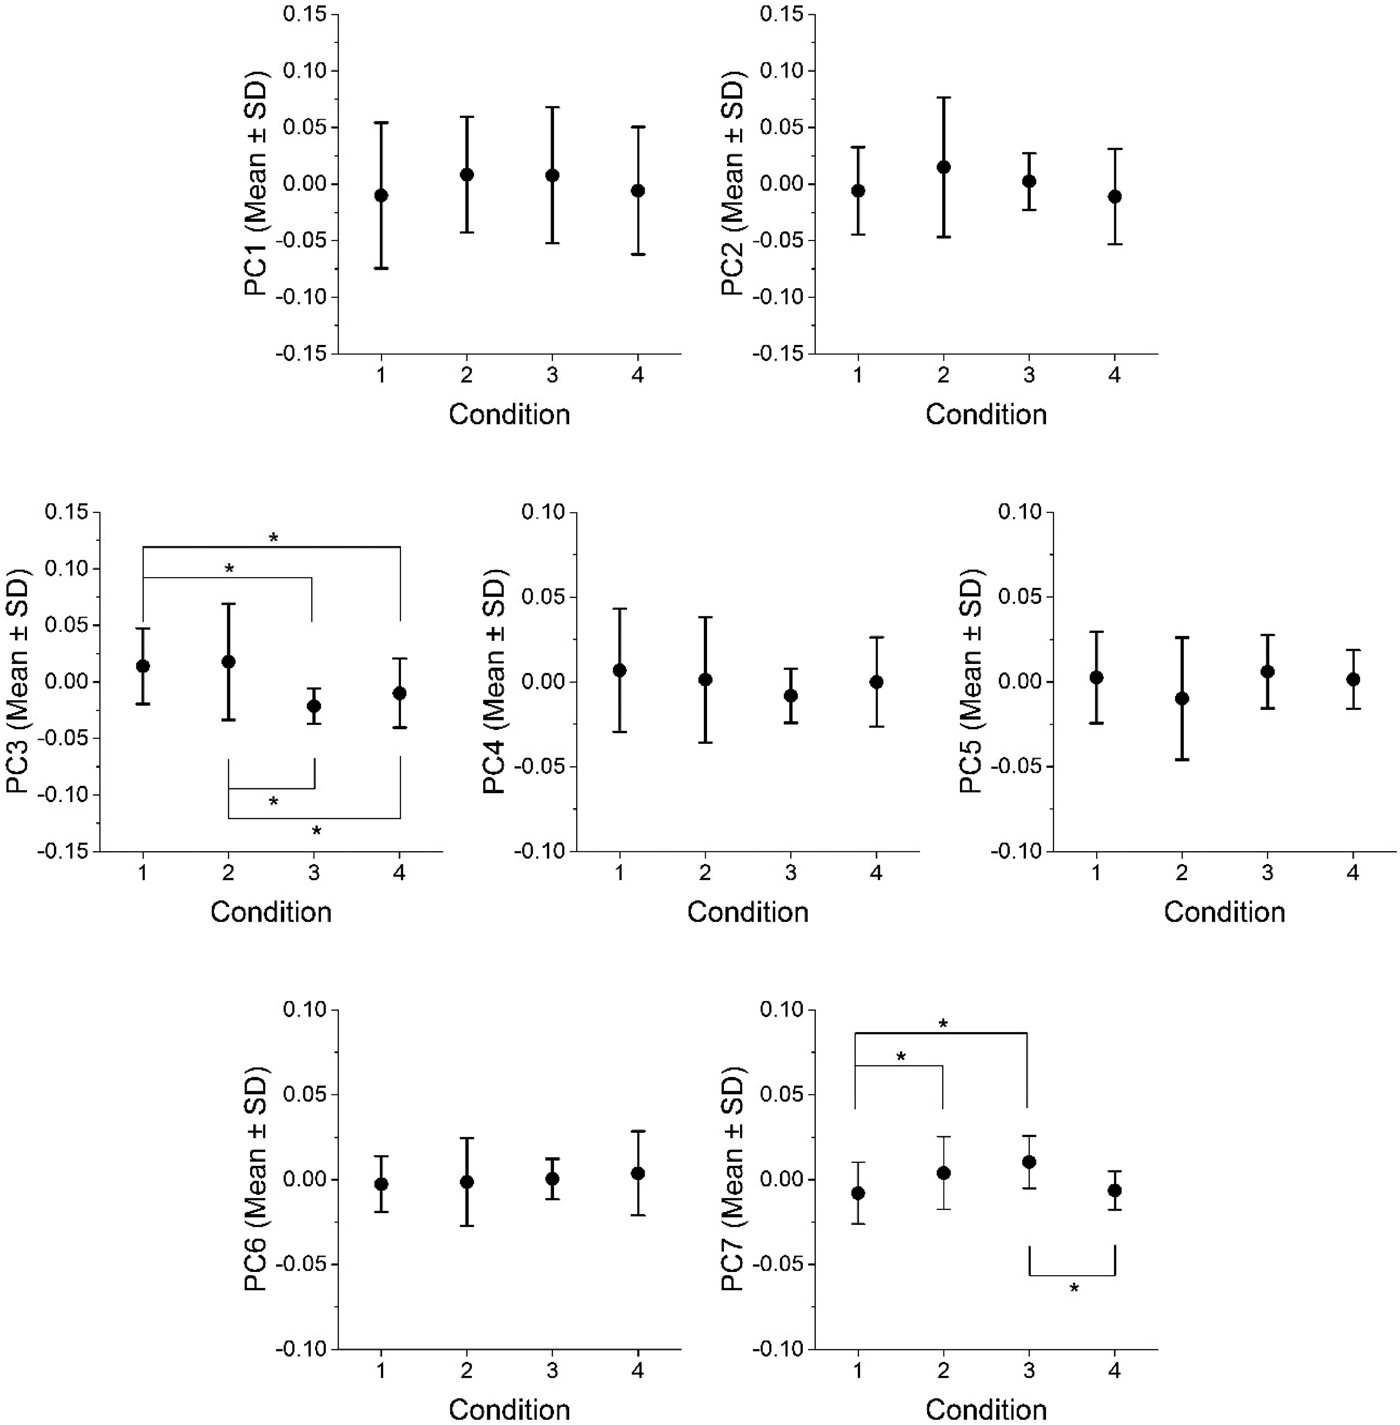
Figure 11 shows the variation of the first to seventh principal component scores of the 117 EFDs among the four experimental conditions. Significant differences among the four conditions in the third and seventh principal component scores were observed (Table 3).
Variations of the first to seventh principal component scores based on 117 elliptic Fourier descriptors among the four experimental conditions. Mean scores are indicated by circles. Vertical bars indicate standard deviations. 1, far condition; 2, medium condition; 3, near condition; and 4, unaided condition. *p < 0.05.

Results of ANOVA for the first seven principal components (PC) scores

*p < 0.05.
Table 3 shows the results of the one-way ANOVA performed on the principal component scores. There are significant differences in the third and seventh principal components (PC3 and PC7), which will be further analyzed by post hoc test. The Tukey multiple comparison test results are also shown in Figure 11. The post hoc test shows that the far condition and medium condition significantly increases the PC3, compared with the unaided and near condition. It also shows that the far condition shows a significantly lower PC7 than the medium and the near conditions, and the near condition has a significantly higher PC7 than the unaided condition.
4.2. Results of subjective evaluation
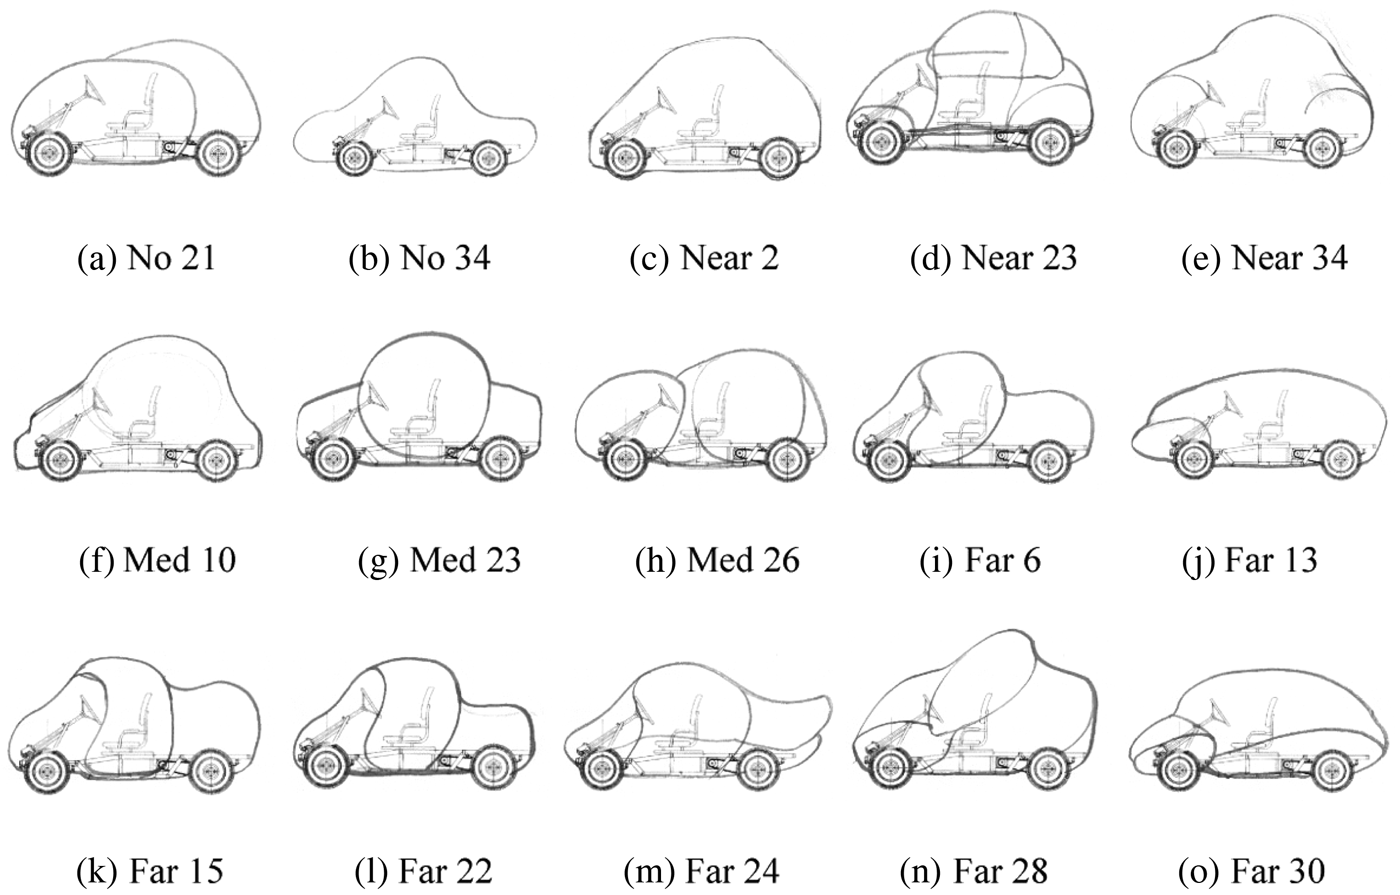
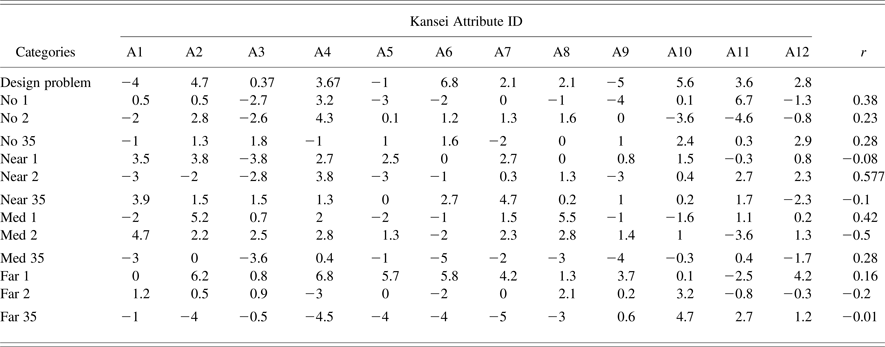
After the semantic differential experiment, the designer panel provided a total number of 336 (28 designers × 12 Kansei attributes) evaluation scores, and the consumer panel provided 33,600 (20 consumers × 28 designers × 5 sketches × 12 Kansei attributes). Table 4 presents partial averaged evaluation scores for each adjective of design problem from designers and sketches from consumers as the result of a global assessment (Jindo & Hirasago, Reference Jindo and Hirasago1997). These 12 averaged evaluation scores for design problem are the means of these indices for the 28 designers. The 12 averaged evaluation scores for each sketch are the means of these indices for the 20 consumers. The Pearson correlation coefficients between consumers’ affective perceptions of sketches and designers’ affective perceptions of the design problem are also shown in Table 4. According to former studies (Das & Bhattacharyya, Reference Das and Bhattacharyya2009; Luo, Fu, & Korvenmaa, Reference Luo, Fu and Korvenmaa2012), the sketches that achieved correlation coefficient above 0.5 can be generally described as a high perceptual matching degree. In this study, No. 21 (0.52), No. 34 (0.6), Near 2 (0.58), Near 23 (0.5), Near 34 (0.65), Med 10 (0.68), Med 23 (0.57), Med 26 (0.51), Far 6 (0.57), Far 13 (0.5), Far 15 (0.71), Far 22 (0.55), Far 24 (0.63), Far 28 (0.53), and Far 30 (0.53) achieved Pearson r above 0.5. Thus, far analogy can produce more sketches with a high perceptual matching degree than other three conditions. The sketches achieving Pearson r above 0.5 are shown in Figure 12.
The sketches achieving Pearson r above 0.5. No, no examples; Near, near analogy; Med, medium analogy; and Far, far/distant analogy.

Average semantic differential evaluation scores of design problem and sketches, and the Pearson r values obtained from correlation analysis (partial)

Note: No, no examples; Near, near analogy; Med, medium analogy; Far, far/distant analogy.
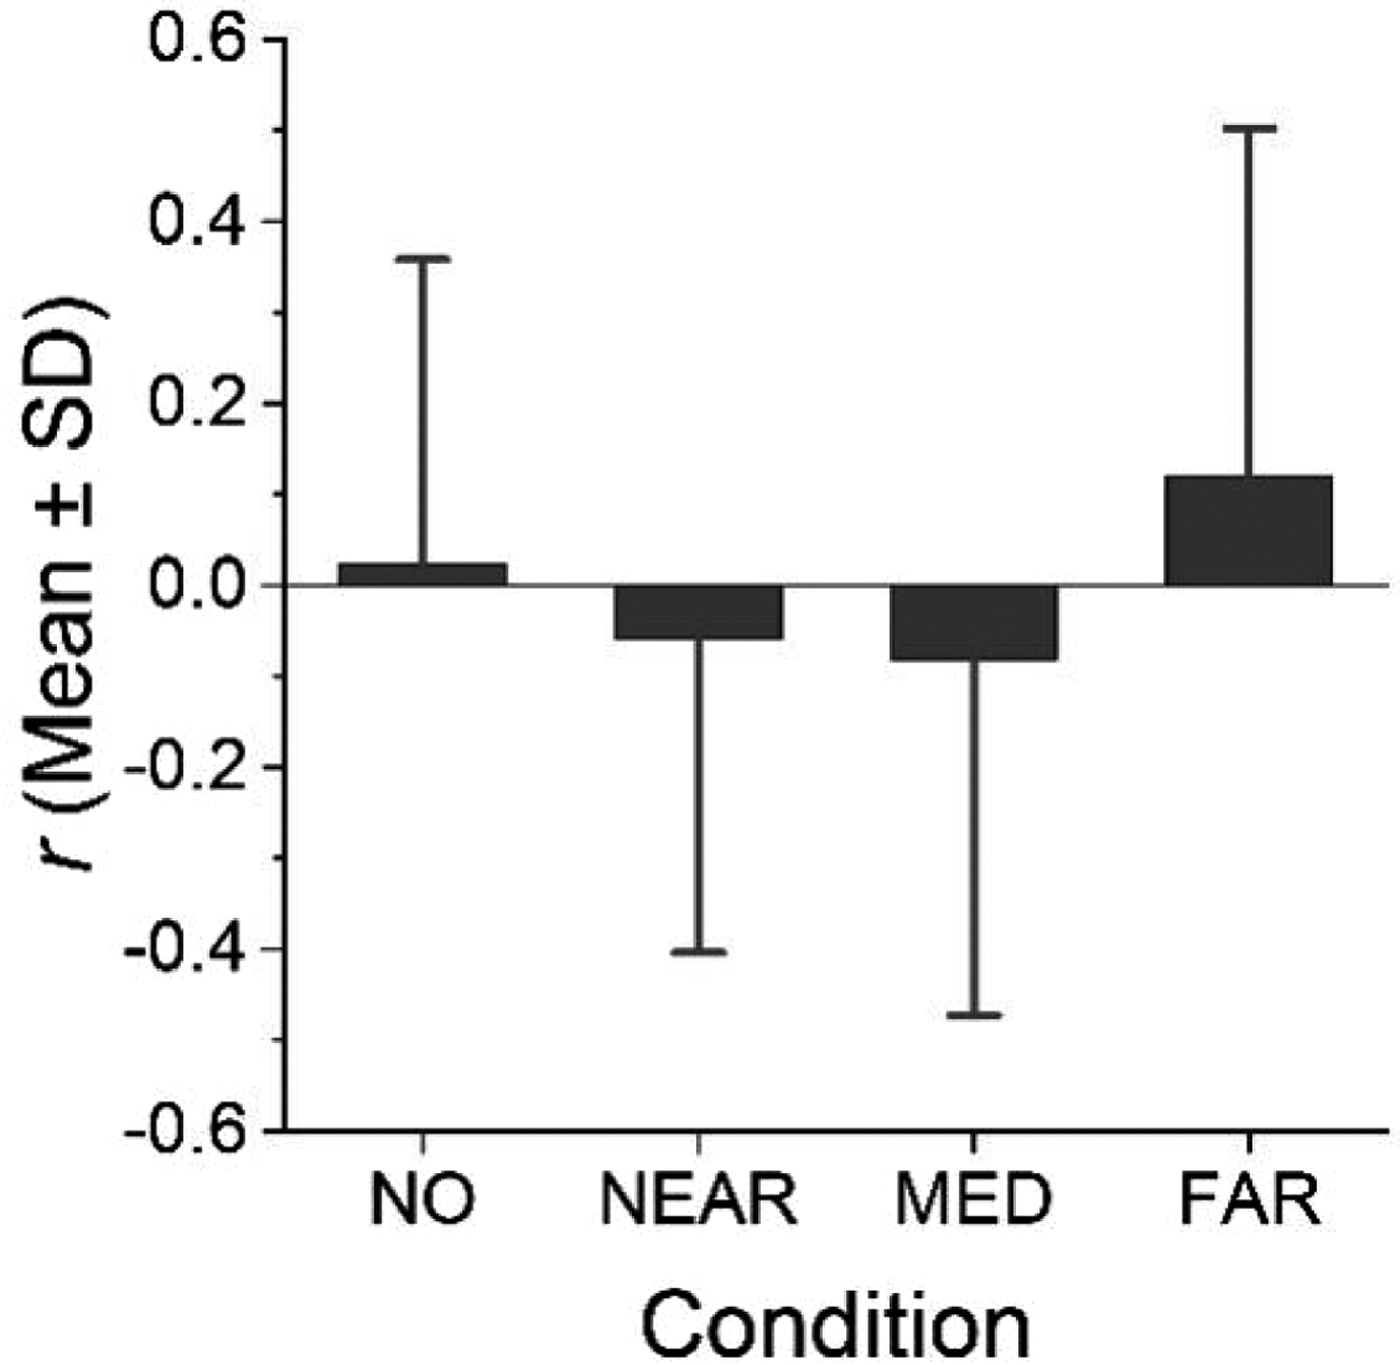
Figure 13 shows the variation of the Pearson r values of the 140 sketches among the four experimental conditions. ANOVA revealed no significant main effects of the stimuli (example exposure) on the correlations of semantic differential evaluation value vectors between design problem and sketches of conceptual design (F = 2.19, p = 0.09).
Variations of the Pearson r values of the 140 sketches among the four experimental conditions. No, unaided condition; Near, near condition; Med, medium condition; and Far, far condition.

5. DISCUSSION
The results presented in this paper supported the hypothesis that exposure to biological examples in ideation will correlate with sketches of conceptual design. The results from the study did not support the hypothesis that exposure to biological examples in ideation will increase the perceptual matching degree between design ideas generated via sketching and the desired function. However, exposure to biological examples can produce more sketches with a high perceptual matching degree than the other three conditions.
In this work, the principal component scores of EFDs were used as shape characteristics for objective evaluation of bioinspired sketches with respect to the unaided set of sketches generated by the group of participants. Hypothesis 1 stated that exposure to biological examples in ideation will correlate with sketches of conceptual design, and the results indicated that exposure to biological examples did increase the third principal component score of sketches generated. This increase in the third component signifies that participants in the far condition were able to generate sketches that have blunter and more swelling bonnet and front screen, more concave rear screen, and higher curvature of the rear mask than those in the unaided condition. A significant increase in the third principal component score of participants receiving human-engineered examples from different product categories was also found (Fig. 11). This implies that the presence of external stimuli with far and medium analogous distance in the conceptual design process has effects on the third principal component score of sketches. Participants receiving human-engineered examples within one product category produced significantly higher seventh principal component scores than those receiving no examples, which indicates that near analogy affects the curvature and swelling of the roofline.
The influence of biological analogies is different from the analogies of human-engineered examples. The type of analogy (far vs. medium vs. near) was also found to have an effect on the third and seventh principal component scores (Fig. 11 and Table 3). Participants receiving biological examples and human-engineered examples from different product categories produced significantly higher third principal component scores than those receiving human-engineered examples within one product category. Participants receiving human-engineered examples produced significantly higher seventh principal component scores than those receiving biological examples. We can conclude that biological analogy can produce sketches with blunter bonnet and front screen, and more concave rear screen compared with near analogy (Figs. 8–11). The biological analogy can also generate sketches with more concave rear screen compared with the medium analogy. Moreover, participants in the medium condition were able to generate sketches that have blunter bonnet and front screen, more concave rear screen, and higher curvature of the rear mask than those in the near condition.
No significant different was found among the four conditions in the first principal component. This was unexpected because it is a good measure of the aspect ratio, accounting for 32.72% of the total principal components (Tables 2, 3). This signifies that the aspect ratios of car profile based on the chassis of the electric car (Fig. 5) were not be affected by different external stimuli. It can be explained that postgraduate participants have taken the course of ergonomics, and they are able to sketch relatively reasonable and standard aspect ratios of car profile.
The second, fourth, fifth, and sixth principal components also showed no significant differences among the four conditions (Table 3). It indicated that car shapes were mainly decided by the design problem (Fig. 2) and subject to the chassis of the electric car (Fig. 5). The results also reconfirmed the principal of form follows function that is associated with modernist architecture and industrial design in the 20th century (Michl, Reference Michl2009). The principle is that the shape of a building or object should be primarily based upon its intended function or purpose.
Overall, a method has successfully been established to evaluate objectively and quantitatively the bioinspired sketches in conceptual design using principal component scores obtained from standardized EFDs. The principal components are independent of each other, and it can be observed visually how each principal component affects the shape by drawing the contours under particular score value conditions, thus demonstrating that the principal component scores can be used as new shape characteristics of sketches (Yoshioka et al., Reference Yoshioka, Iwata, Ohsawa and Ninomiya2004). There are two distinctive advantages in the use of EFDs and principal component analysis (EF-PCA). First, EF-PCA provides an intelligent and purely objective method for evaluating design results (sketches), and it can have potential applications in intelligent design and evaluation. Second, this method can accurately detect small shape variations (Yoshioka et al., Reference Yoshioka, Iwata, Ohsawa and Ninomiya2004). The contributions of the fourth, fifth, sixth, and seventh principal components to the total variance were 9.63%, 6.91%, 3.9%, and 3.32%, respectively (Table 2). It is difficult for humans to detect such small variations, but the one-way ANOVA and post hoc test based on the principal component scores could clearly detect significant variations among the four experimental conditions. Although EF–PCA can detect small variations of outer closed contour, it always misses shape characteristics of inner details in conceptual design. Inner details such as beltline, shoulder line, and lamps also have effects on car shape design, which need further research. Thus, the principal component scores of EFDs can be used as a novel metric of sketching for the intelligent evaluation of other design problems.
Hypothesis 2 stated that exposure to biological examples in ideation will increase the perceptual matching degree between design ideas generated via sketching and the desired function. This hypothesis was unsupported by the results. The exposure to the biological example and no examples showed no statistically significant difference in perceptual matching degree. However, even though exposure to the biological examples did not significantly increase the perceptual matching degree of sketches generated, such exposure also had the maximum sketches with high perceptual matching (r > 0.5). The results can support Siangliulue et al. (Reference Siangliulue, Chan, Gajos and Dow2015), who also reported that examples automatically shown to participants who had temporarily run out of ideas might not lead to necessarily better ideas. One possible explanation for the lack of significant results may be that the designs were not evaluated with adequate measures. In future work, others metrics, such as novelty, variety, or quality (Atilola et al., Reference Atilola, Tomko and Linsey2016) could be considered. Another possibility may be that the analogues did not have the desired effects. A third possibility may be that the designers did not get enough external stimuli when exposed to one analogue (one photo per analogue). For further study, we will design a new experiment and provide designers with more detailed pictures of each analogue.
In this study, we have selected five examples for each condition except for the unaided condition, which can reduce the effects from single example and address our research purpose of exploring the effects of four conditions on sketches. Examples are very different from one another. If only one example was selected for each condition except for the unaided condition, the effects of particular example on sketches would be explored.
6. CONCLUSIONS
Currently, there is little empirical evidence as to the effects of biological examples on sketching itself, despite the existence of several research efforts devoted to the effects on novelty and variety of design ideas generated (Wilson et al., Reference Wilson, Rosen, Nelson and Yen2010). The aim of this work was to evaluate the effects of far analogies from the biological domain on sketching itself objectively and subjectively. In this study, we describe experimental results for the concept generation demonstrated by postgraduate students who all majored in industrial design exposed to biological examples during the conceptual design process. We compared these results to participants receiving no examples as well as to those receiving human-engineered examples from different product categories and within one product category. The results indicated that, in this case, exposure to biological examples increased the third principal component scores of sketches generated without increasing the perceptual matching degree of sketches generated, although such exposure had the maximum sketches with high perceptual matching. The results also indicated that the type of example used (far vs. medium vs. near) had a significant impact on the third and seventh principal component scores of sketches generated.
The results of the work presented in this paper have a number of implications in industrial design, such as intelligent design and design evaluation. These results have been found for postgraduate students who all majored in industrial design, but are anticipated to be extendable for designers with different expertise levels.
The application of EFA coupled with the use of PCA opens interesting prospects for the characterization of sketches, allowing the study of differences and/or relationships that cannot be detected by simple observations.
The limitations of the current study include the relatively small number of subjects and the data might not be representative of the general population. However, the initial findings of significant effect on EFDs and perceptual matching quality are worthy of further larger scale study.
In conclusion, these described research findings can contribute toward developing new theories and methods that support and facilitate BID and conceptual design for engineering design. In future studies, we will build evaluation models between the EFDs of sketching and other subjective metrics, and a software tool that can quickly assess the ideation effectiveness through sketching directly at the stage of conceptual design will be developed based on the models.
ACKNOWLEDGMENTS
The authors thank the participants of the experiment. This study was partly supported by the National Natural Science Foundation of China (No. 51305077), the Zhejiang Provincial Key Laboratory of integration of healthy smart kitchen system (No. 2014E10014), the Fundamental Research Funds for the Central Universities (No. CUSF-DH-D-2016068), and the China Scholarship Council (Nos. 201506630036 and 201506635030).
Zhongliang Yang is an Associate Professor in the College of Mechanical Engineering at Donghua University. He received a PhD in computer science from Zhejiang University. From 2016 to 2017 he was a Visiting Researcher in the Engineering Design Centre, Department of Engineering at the University of Cambridge. Dr. Yang is a member of IEEE and ACM and has published more than 20 papers in various journals and conference proceedings. His research interests are in bioinspired design, human–computer interaction, and artificial intelligence for engineering design.
Yumiao Chen is a PhD student in the Fashion Institute of Donghua University, majoring in apparel design and engineering. She received her MS degree in industrial design engineering from Zhejiang University. Yumiao sees artificial intelligence technologies as a powerful means for solving difficult engineering problems. She has published more than 10 journal and conference papers.
Zheng Liu is an Associate Professor in the College of Art Design at the China Academy of Art. As a member of the Health & Intelligent System Integrated Kitchen Key Laboratory, his research interests cover the application of knowledge management to support industrial design. Zheng has published more than 12 journal and conference papers. He has an interest in design cognition, design processes, and the product form.