1 Background
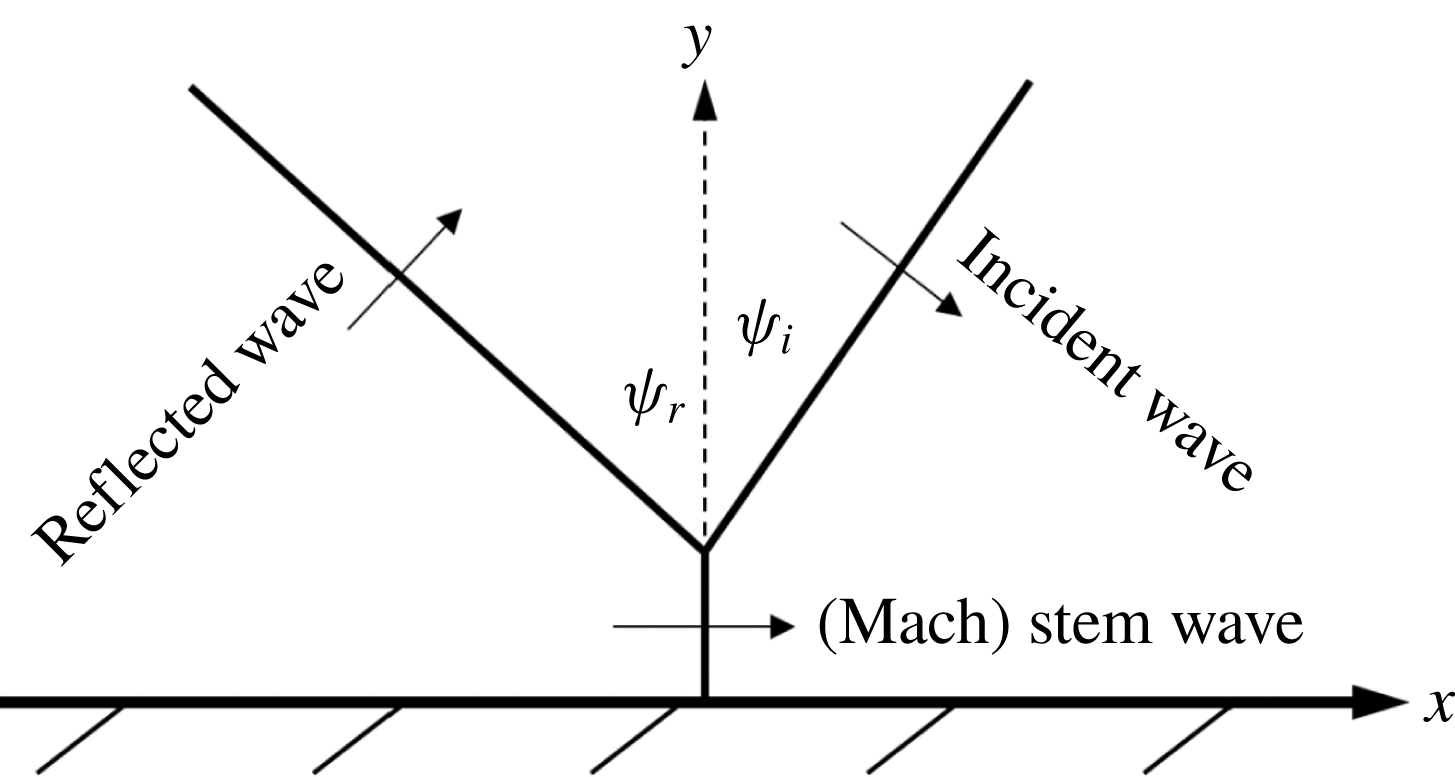
The first explorative laboratory work on the reflection of solitary waves with oblique incidence along a vertical wall was reported by Perroud (Reference Perroud1957). Perroud observed a wave configuration resembling the ‘Mach reflection’ pattern (see figure 1) originally attributed to compressible shockwaves (von Neumann Reference von Neumann1943). Inspired by Perroud’s experimental findings, Miles (Reference Miles1977a
,Reference Miles
b
) developed a theory considering a shallow-but-finite water depth and small-but-finite wave amplitude to the lowest order. His theory predicts a maximum amplification of
 $\unicode[STIX]{x1D6FC}_{w}=a_{M}/a_{i}=4$
at the wall when
 $\unicode[STIX]{x1D713}_{i}=\sqrt{3a_{i}}$
for a small angle of incidence
 $\unicode[STIX]{x1D713}_{i}$
. Here, the parameter
 $a_{M}$
is the maximum amplitude at the wall and
 $a_{i}$
is the incident wave amplitude. All lengths are normalized by the still water depth
 $h_{0}$
and time is normalized by
 $\sqrt{g/h_{0}},$
where
 $g$
is the gravitational acceleration. Melville (Reference Melville1980) conducted laboratory experiments in an attempt to validate Miles’s theory, but only attained an amplification of 2.0 at the wall. Funakoshi (Reference Funakoshi1980) conducted numerical experiments, but only achieved a maximum amplification of
 $\unicode[STIX]{x1D6FC}_{w}\approx 3.42$
. Unlike Funakoshi (Reference Funakoshi1980), whose numerical model was of the same order of approximation as the theory by Miles (Reference Miles1977a
,Reference Miles
b
), Tanaka (Reference Tanaka1993) conducted numerical experiments based on a higher-order pseudo-spectral method to solve the Euler formulation. This higher-order model allowed Tanaka to study conditions less restricted by
 $\unicode[STIX]{x1D713}_{i}$
and
 $a_{i}$
. However, this model only yielded an amplification of
 $\unicode[STIX]{x1D6FC}_{w}=2.897$
.
Mach reflection:
 $\unicode[STIX]{x1D713}_{i}$
, incident wave angle;
 $\unicode[STIX]{x1D713}_{r}$
, reflected wave angle.

The theoretical prediction of a fourfold amplification of the Mach stem can also be arrived at through Kadomtsev–Petviashvili (KP) theory as shown by Chakravarty & Kodama (Reference Chakravarty and Kodama2009), and corresponds to the confluence of the so called (3142)-type and (2143)-type solutions. Miles (Reference Miles1977b
) introduced the interaction parameter
 $k=\unicode[STIX]{x1D713}_{i}/\sqrt{3a_{i}}$
in order to predict wave amplification. Based on the KP theory, Li, Yeh & Kodama (Reference Li, Yeh and Kodama2011) heuristically proposed the following modification:
 $$\begin{eqnarray}k=\frac{\tan \unicode[STIX]{x1D713}_{i}}{\sqrt{3a_{i}}\cos \unicode[STIX]{x1D713}_{i}}.\end{eqnarray}$$
To achieve a consistent theory, a normal form of the KP equation with higher-order corrections was derived by Kodama & Yeh (Reference Kodama and Yeh2016) resulting in
 $$\begin{eqnarray}k=\frac{\sqrt{1+\sqrt{1+5a_{i}}}\tan \unicode[STIX]{x1D713}_{i}}{\sqrt{6a_{i}}\cos \unicode[STIX]{x1D713}_{i}},\end{eqnarray}$$
together with the newly defined KP amplification
 $$\begin{eqnarray}\hat{\unicode[STIX]{x1D6FC}}=\left\{\begin{array}{@{}ll@{}}\displaystyle \frac{\unicode[STIX]{x1D6FC}_{w}(1+\sqrt{1+5a_{i}})}{(1+\sqrt{1+5\unicode[STIX]{x1D6FC}_{w}a_{i}})\cos ^{2}\unicode[STIX]{x1D713}_{i}}, & \text{for}~k<1,\\ \displaystyle \unicode[STIX]{x1D6FC}_{w}, & \text{for}~k>1,\end{array}\right.\end{eqnarray}$$
where
 $$\begin{eqnarray}\unicode[STIX]{x1D6FC}_{w}=\left\{\begin{array}{@{}ll@{}}\displaystyle (1+k)^{2}, & \text{for}~k<1,\\ \displaystyle \frac{4}{1+\sqrt{1-k^{-2}}}, & \text{for}~k>1.\end{array}\right.\end{eqnarray}$$
Equation (1.3) can be used to convert data to the KP coordinate which produces a better agreement between experimental and theoretical results (see Kodama & Yeh Reference Kodama and Yeh2016). Hereinafter,
 $k$
will refer to (1.2). In spite of this higher-order interpretation of the wave amplification, the resulting amplifications for both numerical and laboratory experiments are still
 $\hat{\unicode[STIX]{x1D6FC}}\approx 3$
. Here we revisit this remarkable prediction of the fourfold amplification by following the same procedure as Tanaka (Reference Tanaka1993), but with the use of better computational capabilities available nowadays.
2 Numerical methodology
A higher-order pseudo-spectral method developed by Dommermuth & Yue (Reference Dommermuth and Yue1987) is used to simulate the reflection of an obliquely incident solitary wave at a vertical wall, which is practically the same model as that used by Tanaka (Reference Tanaka1993) and Jia (Reference Jia2014). The Zakharov–Craig–Sulem formulation (Zakharov Reference Zakharov1968; Craig & Sulem Reference Craig and Sulem1993) of the full water-wave equations is solved numerically:
 $$\begin{eqnarray}\left.\begin{array}{@{}ll@{}}\unicode[STIX]{x1D6F7}_{xx}+\unicode[STIX]{x1D6F7}_{yy}+\unicode[STIX]{x1D6F7}_{zz}=0 & \text{for}~-1\leqslant z\leqslant \unicode[STIX]{x1D702},\\ \unicode[STIX]{x1D6F7}_{z}=0 & \text{at}~z=-1,\\ \left.\begin{array}{@{}c@{}}\displaystyle \unicode[STIX]{x1D702}_{t}+\unicode[STIX]{x1D735}\unicode[STIX]{x1D6F7}^{S}\boldsymbol{\cdot }\unicode[STIX]{x1D735}\unicode[STIX]{x1D702}-(1+|\unicode[STIX]{x1D735}\unicode[STIX]{x1D702}|^{2})\unicode[STIX]{x1D6F7}_{z}=0\\ \displaystyle \unicode[STIX]{x1D6F7}_{t}^{S}+\unicode[STIX]{x1D702}+{\textstyle \frac{1}{2}}|\unicode[STIX]{x1D735}\unicode[STIX]{x1D6F7}^{S}|^{2}-{\textstyle \frac{1}{2}}(1+|\unicode[STIX]{x1D735}\unicode[STIX]{x1D702}|^{2})\unicode[STIX]{x1D6F7}_{z}^{2}=0\end{array}\right\} & \text{at}~z=\unicode[STIX]{x1D702},\end{array}\right\}\end{eqnarray}$$
where
 $\unicode[STIX]{x1D6F7}(\boldsymbol{x},z,t)$
is the velocity potential,
 $\unicode[STIX]{x1D702}(\boldsymbol{x},t)$
is the surface displacement,
 $\unicode[STIX]{x1D6F7}^{S}(\boldsymbol{x},t)=\unicode[STIX]{x1D6F7}(\boldsymbol{x},z=\unicode[STIX]{x1D702}(\boldsymbol{x},t),t)$
is the velocity potential at the free surface,
 $\unicode[STIX]{x1D735}=(\unicode[STIX]{x2202}/\unicode[STIX]{x2202}x,\unicode[STIX]{x2202}/\unicode[STIX]{x2202}y)$
represents the horizontal gradient and
 $\boldsymbol{x}=(x,y)$
. The velocity potential is expressed as a series expansion:
 $$\begin{eqnarray}\unicode[STIX]{x1D6F7}(\boldsymbol{x},z=\unicode[STIX]{x1D702},t)=\unicode[STIX]{x1D6F7}^{S}(x,y,t)=\mathop{\sum }_{m=1}^{M}\mathop{\sum }_{k=0}^{M-m}\unicode[STIX]{x1D716}^{m}\frac{\unicode[STIX]{x1D702}^{k}}{k!}\left.\frac{\unicode[STIX]{x2202}^{k}\unicode[STIX]{x1D719}^{(m)}}{\unicode[STIX]{x2202}z^{k}}\right|_{(\boldsymbol{x},z=0,t)}.\end{eqnarray}$$
Here
 $\unicode[STIX]{x1D716}\ll 1$
and
 $$\begin{eqnarray}\unicode[STIX]{x1D719}^{(m)}(\boldsymbol{x},z,t)=\mathop{\sum }_{p=-\infty }^{\infty }\mathop{\sum }_{q=-\infty }^{\infty }\unicode[STIX]{x1D719}_{p,q}^{(m)}(t)\frac{\cosh |\boldsymbol{k}_{p,q}|(z+1)}{\cosh (|\boldsymbol{k}_{p,q}|)}\text{e}^{\text{i}\boldsymbol{k}_{p,q}\boldsymbol{\cdot }\boldsymbol{ x}}.\end{eqnarray}$$
The basis functions
 $\unicode[STIX]{x1D719}^{(m)}$
satisfy Laplace’s equation as well as the bottom kinematic boundary condition. In (2.3)
 $\boldsymbol{k}_{p,q}=(p\unicode[STIX]{x03C0}/L_{x},q\unicode[STIX]{x03C0}/L_{y})$
is the wave number vector, where
 $L_{x}$
and
 $L_{y}$
are the length and width of the domain, respectively,
 $\text{i}=\sqrt{-1}$
, and the sum is truncated at some large
 $N\sim O(1000)$
.
A four-stage Runge–Kutta (RK4) method (e.g. Boyce & DiPrima Reference Boyce and DiPrima2009) is used to numerically time-integrate the evolution equations:
 $$\begin{eqnarray}\left.\begin{array}{@{}c@{}}\unicode[STIX]{x1D702}_{t}=-\unicode[STIX]{x1D735}\unicode[STIX]{x1D6F7}^{S}\boldsymbol{\cdot }\unicode[STIX]{x1D735}\unicode[STIX]{x1D702}+(1+|\unicode[STIX]{x1D735}\unicode[STIX]{x1D702}|^{2})\unicode[STIX]{x1D6F7}_{z},\\ \unicode[STIX]{x1D6F7}_{t}^{S}=-\unicode[STIX]{x1D702}-{\textstyle \frac{1}{2}}|\unicode[STIX]{x1D735}\unicode[STIX]{x1D6F7}^{S}|^{2}+{\textstyle \frac{1}{2}}(1+|\unicode[STIX]{x1D735}\unicode[STIX]{x1D702}|^{2})\unicode[STIX]{x1D6F7}_{z}^{2}.\end{array}\right\}\end{eqnarray}$$
The horizontal gradient is calculated by the algebraic derivative by making use of the two-dimensional fast Fourier transform (FFT2). The initial conditions for the surface displacement
 $\unicode[STIX]{x1D702}$
and the velocity potential at the water surface
 $\unicode[STIX]{x1D6F7}^{S}$
are given by the higher-order solitary wave solution (Grimshaw Reference Grimshaw1971)
 $$\begin{eqnarray}\left.\begin{array}{@{}c@{}}\unicode[STIX]{x1D702}=a_{i}S^{2}-{\textstyle \frac{3}{4}}a_{i}^{2}(S^{2}-S^{4})+a_{i}^{3}\left({\textstyle \frac{5}{8}}S^{2}-{\textstyle \frac{151}{80}}S^{4}+{\textstyle \frac{101}{80}}S^{6}\right),\\ \begin{array}{@{}rcl@{}}\unicode[STIX]{x1D6F7}^{S}\ & =\ & \displaystyle 2\sqrt{\frac{a_{i}}{3}}\left\{T+a_{i}\left[\frac{5}{24}T-\frac{1}{3}S^{2}T+\frac{3}{4}(1+\unicode[STIX]{x1D702})^{2}S^{2}T\right]\right.\\ \ & \ & \displaystyle +\,a_{i}^{2}\left[-\frac{1257}{3200}T+\frac{9}{200}S^{2}T+\frac{6}{25}S^{4}T+(1+\unicode[STIX]{x1D702})^{2}\left(-\frac{9}{32}S^{2}T-\frac{3}{2}S^{4}T\right)\right.\\ \ & \ & \displaystyle \left.+\left.(1+\unicode[STIX]{x1D702})^{4}\left(-\frac{3}{16}S^{2}T-\frac{3}{2}S^{4}T\right)\right]\right\}.\end{array}\end{array}\right\}\end{eqnarray}$$
In (2.5)
 $S$
and
 $T$
are
 $$\begin{eqnarray}S=\operatorname{sech}\unicode[STIX]{x1D705}[(x-x_{i})\cos \unicode[STIX]{x1D713}_{i}-y\sin \unicode[STIX]{x1D713}_{i}],\quad T=\tanh \unicode[STIX]{x1D705}[(x-x_{i})\cos \unicode[STIX]{x1D713}_{i}-y\sin \unicode[STIX]{x1D713}_{i}],\end{eqnarray}$$
in which
 $\unicode[STIX]{x1D705}=\sqrt{3a_{i}}/2(1-(5/8)a_{i}+(71/128)a_{i}^{2})$
and
 $x_{i}$
is the initial location of the crest at the vertical wall. This solution is correct up to the third order, so the perturbation expansion is also truncated at the third term
 $(M=3)$
.
At the offshore boundary the solitary wave maintains its initial identity by artificially extending its form beyond the computational domain. This treatment allows us to achieve a long computational time by circumventing the effects of wave diffraction at the offshore boundary. To accomplish this, we use the same method implemented by Tanaka (Reference Tanaka1993) and Jia (Reference Jia2014).
On account of the initial conditions being a-periodic, the domain is extended periodically in the horizontal directions to accommodate for the Fourier basis functions. It takes a very large domain to run the simulation to reach the asymptotic state, causing the calculation to be quite formidable. A computer with a CPU of 3.40 GHz is used to simulate a number of trials for various combinations of
 $a_{i}$
and
 $\unicode[STIX]{x1D713}_{i}$
. The spatial resolution in the
 $x$
and
 $y$
direction is taken to be
 $\text{d}x=(8\unicode[STIX]{x1D705}\cos \unicode[STIX]{x1D713}_{i})^{-1}$
and
 $\text{d}y=(8\unicode[STIX]{x1D705}\sin \unicode[STIX]{x1D713}_{i})^{-1}$
, respectively. The time step used ranged from 0.157 to 0.196 which ensured that the Courant number was always less than one.
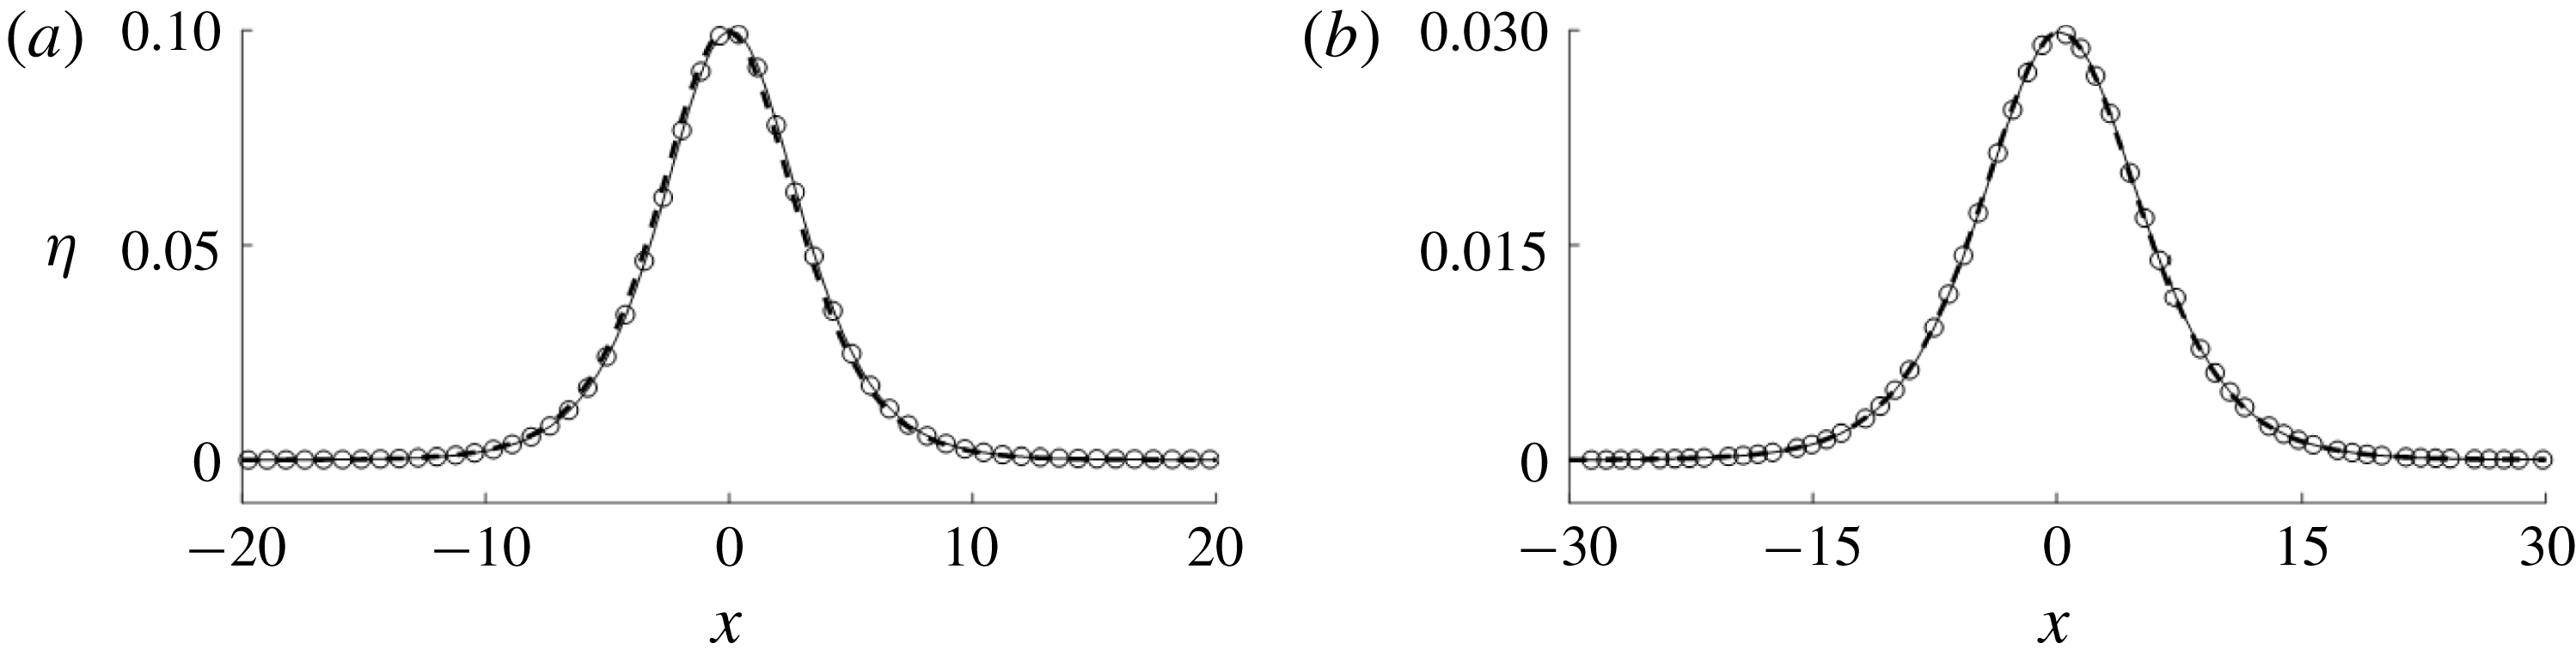
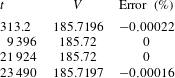
The numerical algorithm is verified by checking conservation of volume and energy for a solitary wave, where
 $a_{i}=0.1$
and
 $\unicode[STIX]{x1D713}_{i}=0^{\circ }$
. Figure 2(a) shows that the amplitude of the solitary wave does not change, indicating that energy is conserved. Table 1 shows that the greatest error for conservation of volume is
 $-0.0022\,\%,$
which is likely caused by the initial condition given by the third-order solution; the error qualitatively presents itself as a formation of small trailing waves.
(a) Overlay of computed solitary wave for
 $a_{i}=0.1$
,
 $\unicode[STIX]{x1D713}_{i}=0^{\circ }$
. (b) Overlay of computed solitary wave for
 $a_{i}=0.03$
and
 $\unicode[STIX]{x1D713}_{i}=15^{\circ },$
where the boundary condition is treated to eliminate wave diffraction. In both plots the computed profile is presented at
 $t=313.2$
(solid line),
 $t=3132$
(dashed line) and
 $t=6264$
(circles).

Conservation of volume
 $V$
for the case
 $a_{i}=0.1$
,
 $\unicode[STIX]{x1D713}_{i}=0^{\circ }$
. The longest simulation time to compute the max
 $\hat{\unicode[STIX]{x1D6FC}}$
was 157 857.

In certain trials (with
 $\unicode[STIX]{x1D713}_{i}=10^{\circ }$
and
 $15^{\circ }$
for values of
 $k$
close to unity) it is necessary to perform a translation on
 $\unicode[STIX]{x1D6F7}^{S}$
and
 $\unicode[STIX]{x1D702}$
due to the long propagation time. This translation is performed before the leading crest reaches the end of the domain. The translation is given by
 $\unicode[STIX]{x1D6F7}_{new}^{S}(x,y,t)=\unicode[STIX]{x1D6F7}^{S}(x-X_{new},y,t)$
and
 $\unicode[STIX]{x1D702}_{new}(x,y,t)=\unicode[STIX]{x1D702}(x-X_{new},y,t),$
where
 $\unicode[STIX]{x1D6F7}_{new}^{S}$
and
 $\unicode[STIX]{x1D702}_{new}$
are the translated values of the free surface velocity potential and surface displacement, respectively. This process is repeated in a cyclic manner until the simulation is terminated. The leading crest is extended in order to prevent the effects of diffraction along the offshore boundary from the wall. An overlay is presented in figure 2(b) for the case
 $a_{i}=0.03$
,
 $\unicode[STIX]{x1D713}_{i}=15^{\circ }$
. The overlays are calculated by taking a cross section perpendicular to the crest in a region where the extension algorithm is being applied. The phase speed is also checked for this case and the maximum value of relative error between the measured phase speed and theoretical higher-order phase speed (Grimshaw Reference Grimshaw1971) is
 $-0.009\,\%$
.
3 Results
Three different angles of incidence were examined (
 $\unicode[STIX]{x1D713}_{i}=10^{\circ },15^{\circ }$
and
 $26^{\circ }$
) for a range of interaction parameters (
 $0.5\leqslant k\leqslant 1.31$
). We also revisited the work of Tanaka (Reference Tanaka1993) by extending the simulation times for
 $a_{i}=0.3$
with
 $\unicode[STIX]{x1D713}_{i}=30^{\circ },35^{\circ }$
and
 $40^{\circ }$
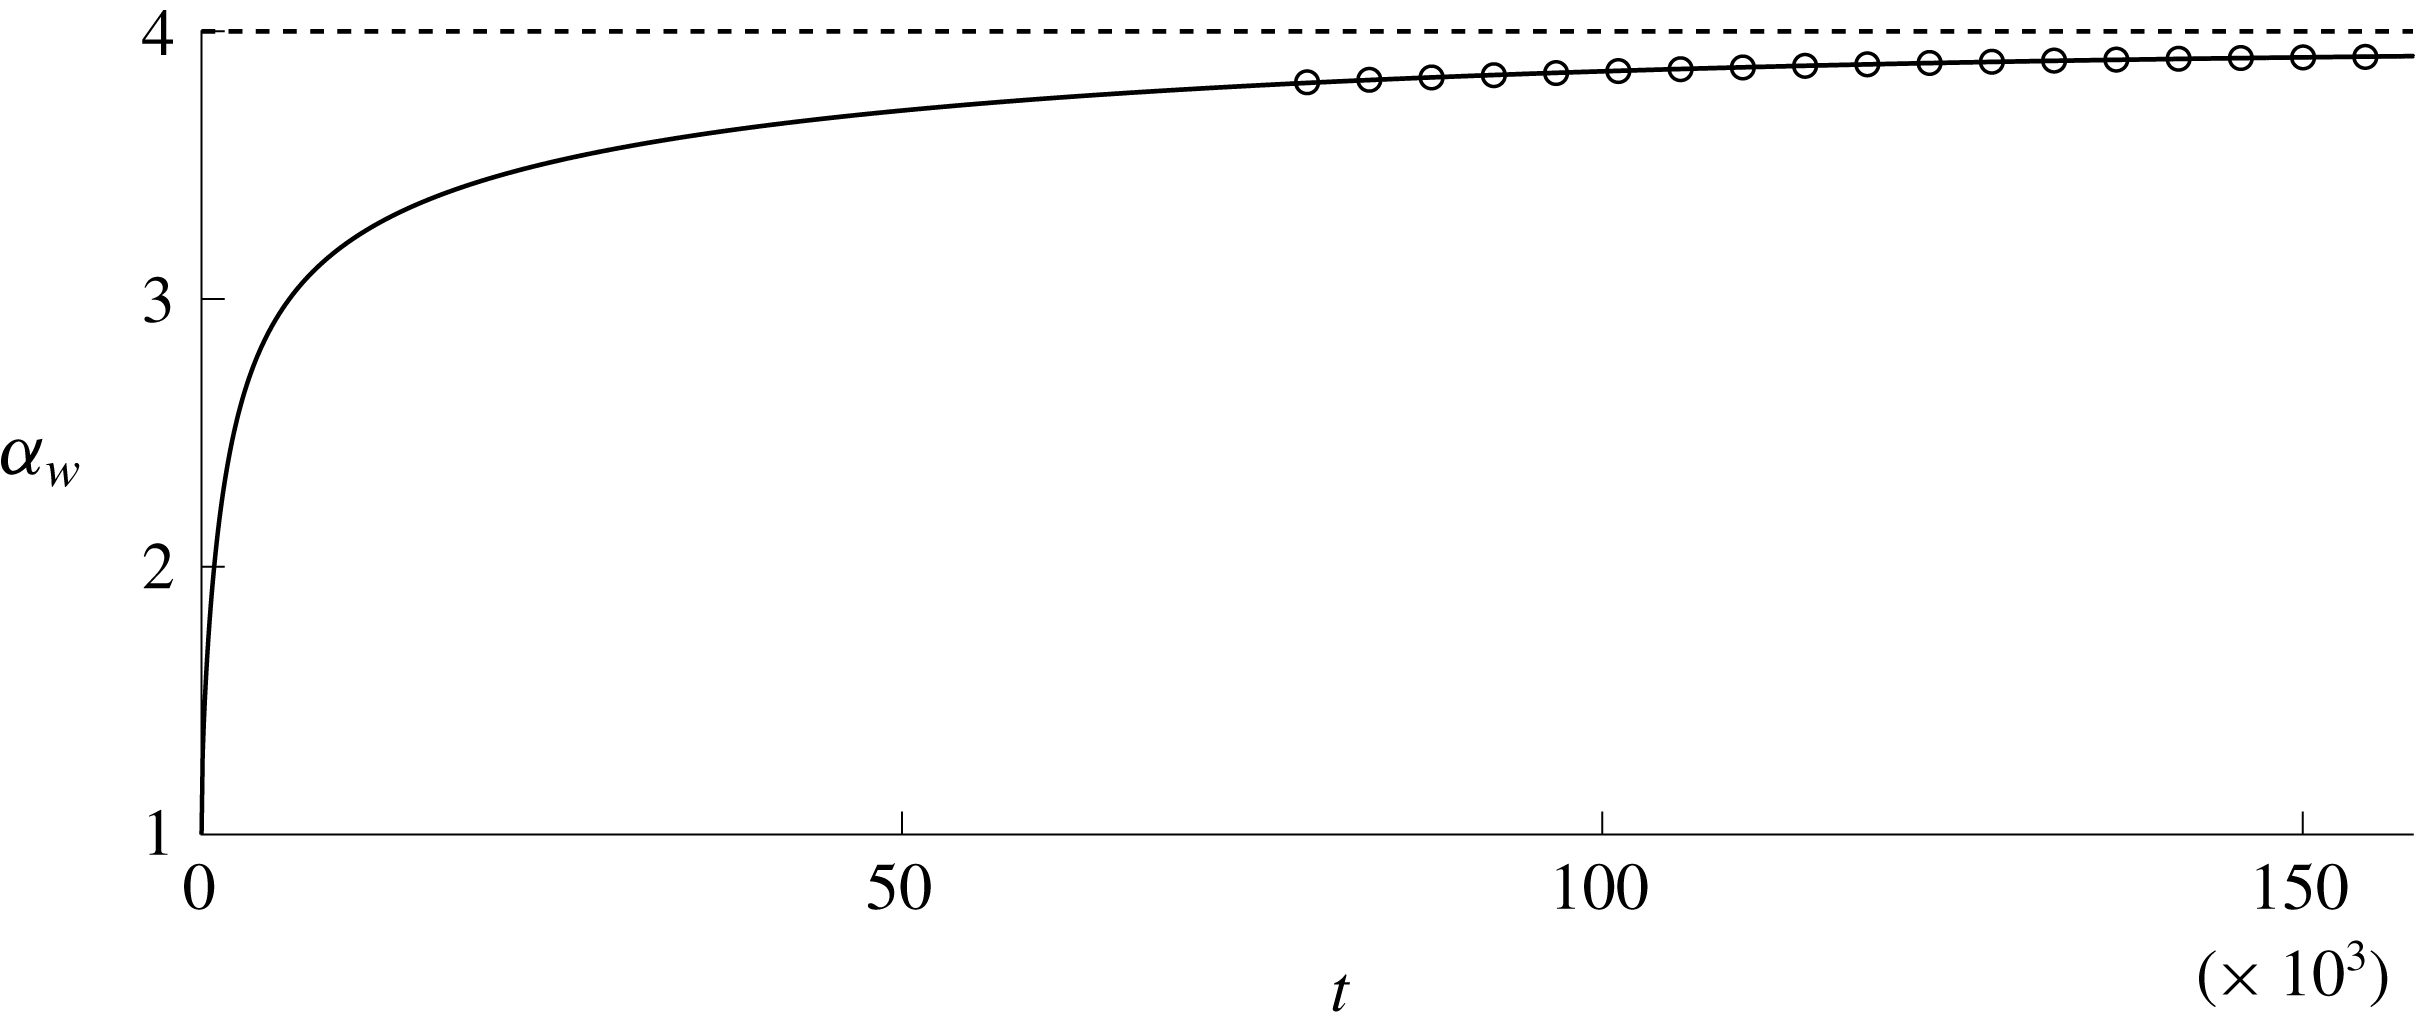
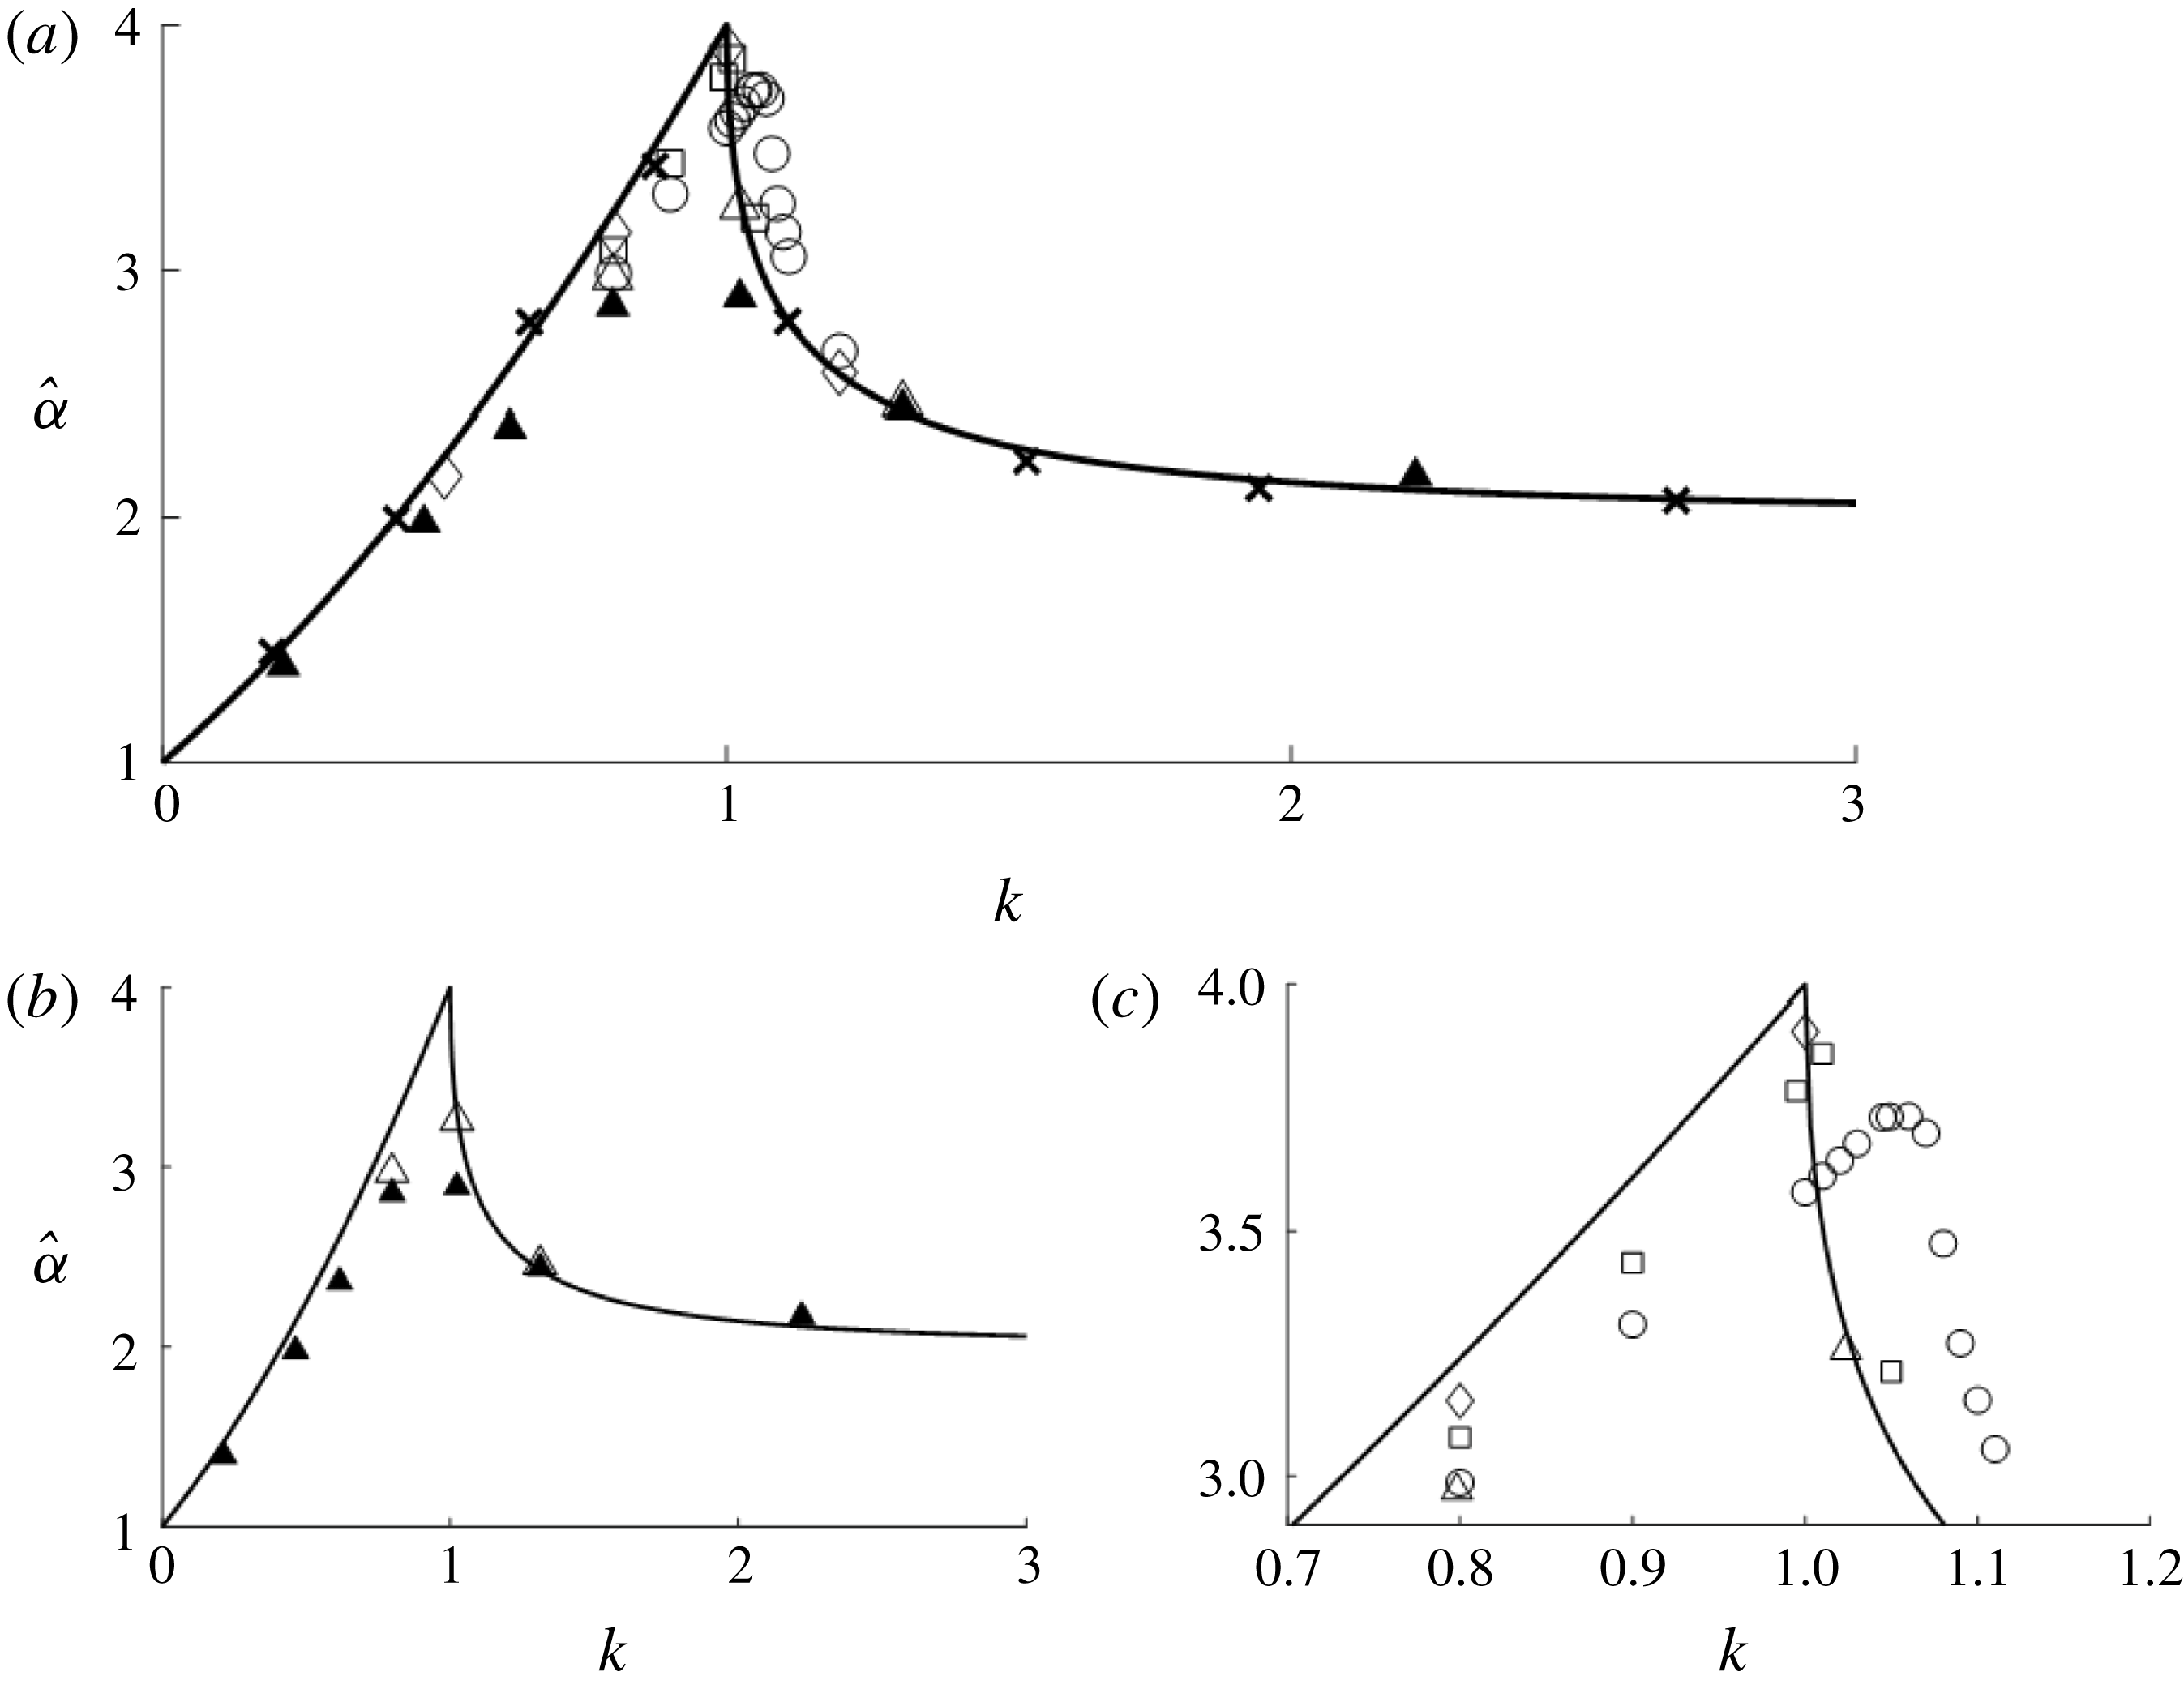
. Figure 3 is demonstrative of how small the growth rate had to be before terminating the simulation. The wave amplification is plotted against the interaction parameter
 $k$
in figure 4, where the KP amplification
 $\hat{\unicode[STIX]{x1D6FC}}$
is given by (1.3). An amplification of
 $\hat{\unicode[STIX]{x1D6FC}}=3.91$
is achieved when
 $\unicode[STIX]{x1D713}_{i}=10^{\circ }$
and
 $a_{i}=0.0108$
(
 $k=1.0$
).
Evolution of amplitude for the case
 $a_{i}=0.0108$
,
 $k=1.0$
,
 $\unicode[STIX]{x1D713}_{i}=10^{\circ }$
. The solid line is the amplification at the wall. The circles are the fit polynomial used to calculate that the slope at
 $t=157\,860$
is
 $3.00\times 10^{-9}$
.

We also examine the length of the stem wave formation (see figure 1) for three different cases: (
 $\unicode[STIX]{x1D713}_{i}=26^{\circ },k=0.90$
), (
 $\unicode[STIX]{x1D713}_{i}=10^{\circ },k=1.0$
) and (
 $\unicode[STIX]{x1D713}_{i}=15^{\circ },k=1.01$
). In the first case, the Mach stem length is continually growing even after the amplitude at the wall has reached an asymptotic state. For the latter two cases, the stem length has stopped growing by the time the amplitude at the wall has reached an asymptotic state. This observation of the numerical experiments is consistent with the theoretical prediction made by Miles (Reference Miles1977a
,Reference Miles
b
) and, more explicitly, by Kodama & Yeh (Reference Kodama and Yeh2016).
Amplification for several higher-order interaction parameters. The solid line is the theoretical curve, ▴
 $=$
Tanaka original, ▵
 $=$
Tanaka new,
 $\times$
 $=$
Funakoshi, ♢
 $=$
 $10^{\circ }$
, ▫
 $=$
 $15^{\circ }$
, ○
 $=$
 $26^{\circ }$
. (a) All the data; (b) comparison of Tanaka’s data; (c) closeup view of data near
 $k=1.0$
.

The results by Funakoshi (Reference Funakoshi1980) for
 $a_{i}=0.05$
are also presented in figure 4(a). The good agreement seen in Funakoshi’s results comes from the fact that he is solving equations that are on the same order of approximation as Miles’s theory. Comparison of the solid and hollow triangle symbols in figure 4(b) demonstrates a clear improvement of the present data over Tanaka’s, particularly for the
 $30^{\circ }$
(
 $k=0.789$
) and
 $35^{\circ }$
(
 $k=1.024$
) cases; this improvement is owing to the better computational hardware available to the present study.
When
 $k<1$
a three-wave resonant interaction occurs. On the other hand, when
 $k>1$
the KP solution is described as a simple reflection accompanied by a phase shift. When
 $k=1$
there is a weak discontinuity-type singularity and the interaction is no longer clearly defined. After this point
 $k=1^{+}$
the amplification begins to drop off sharply which appears to be in agreement with the numerical results.
After computing the amplification at various
 $k$
values, we see that there is a dependency on
 $\unicode[STIX]{x1D713}_{i}$
near
 $k\approx 1$
(figure 4
c) and the data no longer agree well with the theoretical curve. These results show that
 $\hat{\unicode[STIX]{x1D6FC}}$
shifts down and to the right as
 $\unicode[STIX]{x1D713}_{i}$
increases. The open circle and open triangle overlap nicely for the data at
 $k=0.8$
in figure 4(c). The angles used in these two different simulations were similar (open triangle:
 $\unicode[STIX]{x1D713}_{i}=30^{\circ }$
; open circle:
 $\unicode[STIX]{x1D713}_{i}=26^{\circ }$
). However, the nonlinearities used are considerably different (open triangle:
 $a_{i}=0.3$
; open circle:
 $a_{i}=0.1$
) indicating that the incident wave angle appears to have more of an impact on the amplification than the nonlinearity. At
 $k=0.8,$
we see that the amplification appears to increase monotonically as the angle of incidence is decreased.
4 Discussion
Note that in the results an amplification of 4 is nearly realized in one of the numerical simulations. The discrepancy between the numerical result of 3.91 and the theoretical fourfold amplification stems primarily from the ambiguity of the theory itself and the long simulation time for the numerical model to reach an asymptotic state. KP theory requires the angle of incidence to be small and, therefore, at the critical condition
 $(k=1)$
the nonlinearity must also be small. However, without a quantitative definition of ‘small’, it is difficult to determine what the angle and amplitude need to be in order to achieve the fourfold result. As seen in figure 4, the derivative is undefined at
 $k=1$
and, therefore, it is not clear what will happen and it may take an even longer time to reach an asymptotic state if it even ever does reach that limit in a finite amount of time. Therefore, the theory itself has some limitations even after the higher-order corrections presented in Kodama & Yeh (Reference Kodama and Yeh2016).
It takes a very long time (
 ${\approx}$
14 h of scaled physical time for the
 $h_{0}=1$
m case, for example) to reach an amplification of 3.91, which demonstrates that this particular result is of little practical significance. Therefore, we are unlikely to realize this result through physical laboratory experiments and even less likely to observe this result in the field.
5 Conclusions
The oblique incidence of solitary waves at a vertical wall were studied. A higher-order pseudo-spectral method was implemented in order to simulate experiments for
 $\unicode[STIX]{x1D713}_{i}=10^{\circ },15^{\circ }$
and
 $26^{\circ }$
for various interaction parameters (
 $0.5\leqslant k\leqslant 1.31$
). We also re-computed the cases presented by Tanaka (Reference Tanaka1993), resulting in improvement after substantially extending the simulation time; the improvement was attributed to the advances in computational power achieved in the last 25 years. All results were then compared with the theoretical prediction of Miles (Reference Miles1977b
) after converting the results to the higher-order KP theory given by Kodama & Yeh (Reference Kodama and Yeh2016). The greatest amplification achieved was
 $\hat{\unicode[STIX]{x1D6FC}}=3.91$
when
 $a_{i}=0.0108$
,
 $\unicode[STIX]{x1D713}_{i}=10^{\circ }$
, almost realizing the fourfold prediction. It appeared that the amplification was sensitive to the angle of incidence when
 $k$
was near unity. By performing these simulations with the full water-wave model, we have provided results which contribute to the quantitative validity of Miles’s theory, at last.