INTRODUCTION
Canola (Brassica napus L.) seed has multiple uses: the oil is an essential source of vegetable oil and energy in the human diet, whereas the meal is used widely as animal feed (Bell Reference Bell1984; Summers et al. Reference Summers, Spratt and Bedford1990; Ahmad et al. Reference Ahmad, Mushtaq, Mirza and Ahmed2007; Seneviratne et al. Reference Seneviratne, Beltranena, Newkirk, Goonewardene and Zijlstra2011; Landero et al. Reference Landero, Beltranena and Zijlstra2012).
Canola meal is a by-product of canola seed after oil extraction; it has been extensively used in the feed industry and has many benefits for livestock and poultry (Ferlay et al. Reference Ferlay, Legay, Bauchart, Poncet and Doreau1992; Leupp et al. Reference Leupp, Lardy, Soto-Navarro, Bauer and Caton2006; Seneviratne et al. Reference Seneviratne, Beltranena, Newkirk, Goonewardene and Zijlstra2011). The nutritive value of canola meal is desirable because of the high content of some amino acid components, such as methionine (Met) and cysteine (Cys), compared with soybean meal (Bell Reference Bell1984; Khajali & Slominski Reference Khajali and Slominski2012). Previous investigations have suggested that canola meal quality, in particular protein and amino acid composition, is closely associated with nitrogen (N) content (Ahvenjärvi et al. Reference Ahvenjärvi, Vanhatalo and Huhtanen2002; Kong & Adeola Reference Kong and Adeola2011). For example, a diet for pigs with added canola meal had no effect on N retention and utilization, whereas addition of soybean meal increased urinary N excretion and decreased N retention (Grala et al. Reference Grala, Verstegen, Jansman, Huisman and Wasilewko1998). Regarding the origin of proteins and amino acids in canola seed or meal, these components primarily stem from absorption and assimilation of applied N fertilizers, which are transported from the root, leaf, stem and silique wall to the developing seed.
Previous investigations in oilseed rape have focused more on seed yield, oil content and other agronomic traits, such as N use efficiency (Schjoerring et al. Reference Schjoerring, Bock, Gammelvind, Jensen and Mogensen1995; Dreccer et al. Reference Dreccer, Schapendonk, Slafer and Rabbinge2000; Gao et al. Reference Gao, Thelen, Min, Smith, Hao and Gehl2010; Zheljazkov et al. Reference Zheljazkov, Vick, Ebelhar, Buehring and Astakie2012). Generally, N can increase canola seed yield and decrease oil content, as reported in many studies (Cheema et al. Reference Cheema, Malik, Hussain, Shah and Basra2001; Rathke et al. Reference Rathke, Christen and Diepenbrock2005; Gan et al. Reference Gan, Malhi, Brandt, Katepa-Mupondwa and Stevenson2008; Blackshaw et al. Reference Blackshaw, Hao, Brandt, Clayton, Harker, O'Donovan, Johnson and Vera2010; Karamzadeh et al. Reference Karamzadeh, Mobasser, Ramee and Ghanbari-Malidarreh2010). Regarding the influence of N fertilizer application on canola seed or meal protein, N is a positive regulator (Hocking et al. Reference Hocking, Kirkegaard, Angus, Gibson and Koetz1997; Grant et al. Reference Grant, Derksen, McLaren and Irvine2011; Aminpanah Reference Aminpanah2013). The results of N application in the feed industry have suggested that N is a target for improving canola protein yield.
Regardless of the improvement in protein yield attributable to N application, little attention has been given to the influence of N application on canola seed or meal amino acid content. Given that amino acid content is an essential determining trait for meal quality, factors that affect canola seed or meal amino acid content, such as N management, should be studied. Amino acid accumulation and metabolism in plant seeds are regulated by many factors, such as developmental cues and agronomic practices. For example, Angelovici et al. (Reference Angelovici, Lipka, Deason, Gonzalez-Jorge, Lin, Cepela, Buell, Gore and DellaPenna2013) identified the key regulator, branched-chain amino acid transferases2 (BCAT2), on the seed branched-chain amino acid content in Arabidopsis. BCAT2 also accounted for natural variation in glutamate recycling and amino acid homeostasis (Angelovici et al. Reference Angelovici, Lipka, Deason, Gonzalez-Jorge, Lin, Cepela, Buell, Gore and DellaPenna2013). Aside from these developmental cues, genotypic variation has also been shown to contribute to free amino acid content in the seed (Bell et al. Reference Bell, Rakow and Downey2000; Crutis et al. Reference Crutis, Muttucumaru, Shewry, Parry, Powers, Elmore, Mottram, Hook and Halford2009). From an agronomic aspect, Yang et al. (Reference Yang, Zou, Liang, Xia, Liu, Ibrahim, Li, Li, Chen, Zen, Liu, Chen, Li and Zhu2012) revealed that higher soil N content resulted in higher L-proline (Pro) and total protein content as well as lower soluble protein content in rice. All of these examples describe the intricate regulatory system of amino acid accumulation and metabolism in plant organs. Given that the N fertilizer absorbed by plant tissue is a basic substrate for plant amino acid biosynthesis, it is hypothesized in the present study that varieties with differing protein contents have different amino acid compositions and the ways that this is influenced by N fertilizer application are explored.
Considering that amino acid concentration is directly related to canola meal quality, the effect of most agronomic practices, such as N fertilizer application, on variations in the amino acid concentrations should be assessed. Therefore, the present study is aimed to evaluate the responses of seed oil, protein, total amino acid and individual amino acid concentrations to N fertilizer application rate in genotypes with different final protein content and to determine the contributions of individual amino acids to the canola meal quality using analysis of variance (ANOVA) and regression analysis.
MATERIALS AND METHODS
Site description and crop husbandry
Field experiments were performed during the 2010/11 and 2011/12 growing seasons at the experimental station in Yangzhou University, Jiangsu Province, China (32°30′N, 119°25′E, 4·2 m a.s.l.). The soil texture was clay loam in both the nursery and transplanting fields. Three commercially available conventional canola (Brassica napus L.) cultivars, Yangyou 6, Zhongshuang 11 and Zheyou 50, were chosen as plant materials. The selection depended mainly on different seed protein contents found by primary screening. The seed protein content in Yangyou 6 ranked the highest (251 mg/g). The seed protein content in Zhongshuang 11 (237 mg/g) was higher than that of Zheyou 50 (226 mg/g). The varieties chosen were genotypes that are widely grown in the down-stream and middle-stream regions of the Yangtze River area. The canola seeds were broadcast on the seed-bed on 24 September during both growth seasons. Before seeding, 150 kg/ha of urea was applied to the soil. Pest and disease control were performed according to local management practices. Seedlings were transplanted to the experimental field at a density of 125 000 plants/ha on 28 October during both seasons: 750 kg/ha of calcium superphosphate and 135 kg/ha of potassium chloride were manually applied to the soil as basal fertilizer before transplanting. The remaining 135 kg/ha of potassium chloride was manually applied to the soil during the bolting stage (growth stage (GS) 51 on the BBCH scale; Lancashire et al. Reference Lancashire, Bleiholder, Van Dem Boom, Langelüdeke, Stauss, Weber and Witzenberger1991). The field was not irrigated during the growing seasons. The precipitation and mean temperature during the seed filling and pod ripening stages (April and May) were 22·9 and 102·6 mm and 16·3 and 21·9 °C in 2011 and 41·7 and 38·2 mm and 17·7 and 22·1 °C in 2012, respectively.
Experimental design
A 4 × 3 factorial experiment was conducted in a split-plot design with four levels of N assigned to the main plots and three genotypes in sub-plots. The experiment was replicated three times within years. The four N rates were 0, 120, 240 and 360 kg N/ha, which were designated as N0, N1, N2 and N3, respectively. Urea was used as the N fertilizer, half of which was manually applied to the soil before transplanting (basal fertilizer), 0·20 during the seedling stage (20 day after transplanting, GS 15), and 0·3 during the bolting stage (normally at the end of February, GS 51). Each plot consisted of 20 rows that were 8 m in length and 3 m in width.
Seed oil, protein and amino acid concentration determination
Because of the high rate of N fertilizer (360 kg N/ha), later maturity was observed, and the harvesting time for crops using this treatment was 6 day later than that for crops with 0 kg N/ha fertilizer. During the harvesting stage, plants in the core area (15 m2) were harvested manually to determine the seed yield, and a sub-sample was taken to determine the seed oil, protein and amino acid concentrations. The outer plants were abandoned to avoid a border effect. Up to 30 g of seeds were dried in an oven at 80 °C until constant weight. The dried seeds were ground to powder by a pulverizer (Wenlin Dalin Machine Com. Ltd, Wenlin, China) fitted with a 0·5 mm-diameter screen prior to chemical composition determination. Seed oil content was determined by the Soxhlet method as described by AOAC (Reference Horwitz2003). Briefly, the seed powder was dried at 105 °C for 4 h and then cooled to room temperature in a drier. The weight of the sample was recorded and extracted by diethylether for 24 h with a reflux condensation device. After extraction, samples were dried at 105 °C for 4 h and weighed. Crude lipid content was calculated from the decreased seed powder weight after extraction by petroleum ether. Nitrogen content was determined using the Kjeldahl method using an automatic analyser (FOSS 2300, Sweden). The main procedure followed the AOAC method (Reference Williams1984). Nitrogen content was converted into protein by multiplying by the coefficient 6·25. Individual amino acids were determined with an amino acid analyser L-8900 (Hitachi, Japan) according to AOAC (Reference Cunniff1994). The glutamic acid (Glu) concentration was determined as a combination of Glu and glutamine, and the aspartic acid (Asp) concentration as a combination of Asp and asparagines, because glutamine and asparagine were hydrolyzed into Glu and Asp. Considering that tryptophan was completely destroyed during hydrolysis in the determination method, the tryptophan concentration was not measured. Met and Cys are partly oxidized using this procedure; therefore, their measurement was replaced by the oxidation hydrolysis method (Llames & Fontaine Reference Llames and Fontaine1994). The total amino acid concentration was determined as the sum of all of the individual amino acids except for tryptophan.
Statistical analysis
In the present experiment, ANOVA was performed using the R package (R Core Team 2014; www.r-project.org); N rate, genotype and their interaction were considered to be fixed effects, whereas the year, replication and all interactions were considered to be random. Because there were no significant differences on the error of main plot and sub-plot, they were combined into error item. Further comparison of multiple means of chemical components for significance (P < 0·05) was completed by comparing the least square means (Duncan's method). Regression analysis were performed using the mixed model package R lme4 to describe the responses of the dependent variables to the N rate where the genotype Yangyou 6, was used as a standard reference (Hothorn & Everitt Reference Hothorn and Everitt2014).
RESULTS
Response of seed oil, protein and total amino acid concentration to nitrogen rate and genotype
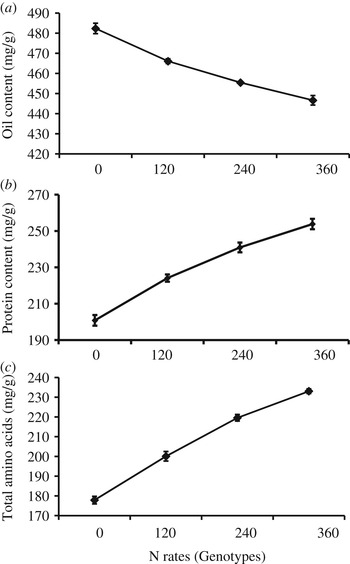
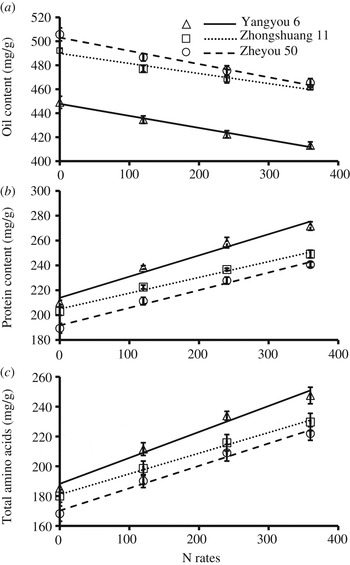
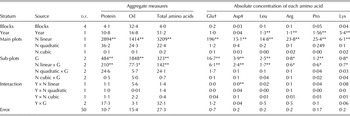
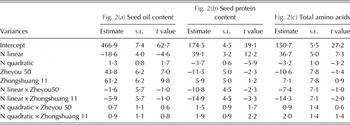
The canola seed oil content was significantly (P < 0·001) affected by N application and genotypic variation (Table 1a ). Further, a significant (P < 0·05) influence of N rate and genotype interaction on seed oil content was observed (Table 1a ). The seed oil content in the genotypes decreased linearly and significantly (P < 0·01) (Fig. 1(a) and Table 2), at a rate of c., 40 mg/g from N0 to N3 (Fig. 2(a)).
Effect of four nitrogen rates (0, 120, 240 and 360 kg N/ha) and three genotypes (Yangyou 6, Zhongshuang 11 and Zheyou 50) on (a) canola seed oil content, (b) protein content with combined genotypes and (c) total amino acid concentration over the 2010/11 and 2011/12 growing seasons. Error bars indicate standard error of mean.

Relationships between nitrogen rate (0, 120, 240 and 360 kg N/ha) and (a) oil content, (b) protein content and (c) total amino acid concentration over the 2010/11 and 2011/12 growing seasons. Equations are shown in Table 2. Error bars indicate standard error of mean.

Analysis for variances (seed protein, oil, total amino acids, Glu, Asp, Leu, Arg, Pro and Lys)

The table shows means block and treatment effects and the significance of each treatment mean square relative to the error mean square is tested by an F ratio test with the appropriate degrees of freedom.
* P < 0·05, **P < 0·01.
† and ‡ indicate glutamic acid and aspartic acid, respectively, are a combination of glutamine acid and glutamine and aspartic acid and asparagine, respectively.
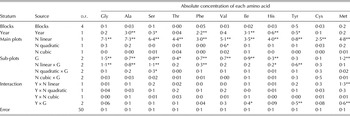
Analysis for variances (Gly, Ala, Ser, Thr, Phe, Val, Ile, His, Tyr, Cys and Met)

The table shows means block and treatment effects and the significance of each treatment mean square relative to the error mean square is tested by an F ratio test with the appropriate degrees of freedom.
* P < 0·05, **P < 0·01.
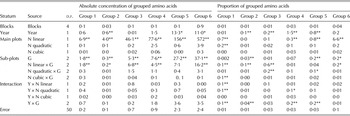
Analysis for variances (absolute concentration of grouped amino acids and proportion of grouped amino acids)

The table shows means block and treatment effects and the significance of each treatment mean square relative to the error mean square is tested by an F ratio test with the appropriate degrees of freedom.
*P < 0·05, **P < 0·01.
Coefficients for intercept, linear and quadratic terms of trends over N rates for seed oil, protein and total amino acid concentration for three genotypes using Yangyou 6 as a standard reference for the 2010/11 and 2011/12 growing seasons*

* The 5, 1 and 0·1% t values based on the appropriate error degrees of freedom (38) were 1·686, 2·429 and 3·319.
Both N rate and genotype significantly (P < 0·001) affected seed protein content with a strong N × genotype interaction (P < 0·01) (Table 1a ). The seed protein content was affected by identical linear and quadratic terms (Fig. 2(b) and Table 2). Although the seed protein content can benefit from N fertilizer application (Fig. 1(b)), the potential for improvement from increased N rates across the genotypes was as follows: Yangyou 6 > Zheyou 50 > Zhongshuang 11 (Fig. 2(b) and Table 2). This finding was revealed by the relative sizes of the coefficients (Table 2). Seed protein content with the N3 treatment increased by 29·3, 22·7 and 27·1% compared with the controls in Yangyou 6, Zhongshuang 11 and Zheyou 50, respectively, averaged across both years (Fig. 2(b)). For genotypic variation, the seed protein content in Zhongshuang 11 and Zheyou 50 was lower by 8·4 and 11·8%, respectively, with N2 and by 8·3 and 11·4%, respectively, with N3 when compared with Yangyou 6, averaged across both years (Fig. 2(b)).
A significant (P < 0·01) N rate × genotype interaction was observed in the total amino acid concentration (Table 1a ). The seed total amino acid concentration in the genotypes was influenced by linear and quadratic terms (Fig. 2(c) and Table 2). The total seed amino acid concentrations in the genotypes regarding the same N rate (Fig. 1(c)) were as follows: Yangyou 6 > Zhongshuang 11 > Zheyou 50.
Effect of nitrogen rate and genotype on absolute concentrations of individual amino acids
Very significant responses to the N application and genotypic variation were observed in the absolute concentrations of the individual amino acids, except Tyr and Cys (Table 1b ). Furthermore, 12 out of 17 amino acids showed significant (P < 0·05) interaction between N and genotype with the exception of Thr, Val, Ile, Cys, and Met (Table 1b ). Significant (P < 0·05) year effects were also found in some amino acids such as Leu and arginine (Arg) (Tables 1a and b ). Significant (P < 0·05) interaction effects between year and N application were found in Asp and Met (Tables 1a and b ).
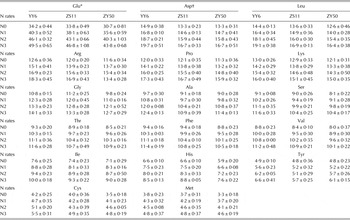
The results showed that Glu was present in the highest concentration, and two sulphur-containing amino acids, Cys and Met, were the lowest concentration among the 17 amino acids (Table 3). Furthermore, the absolute concentration of Glu was 8·1-fold–10·3-fold higher than that of Cys or Met. Each amino acid had a positive response to N rate in the three genotypes. The absolute concentrations of the individual amino acids in Yangyou 6 ranked first with all of the N rates, except for His and Met. Generally, the absolute concentrations of the individual amino acids in Zhongshuang 11 were higher than that in Zheyou 50, except for Asp, Ala, Tyr and Cys. The higher concentrations of these four amino acids were usually found with the higher N dose (i.e., N3) and were higher in Zheyou 50 compared with Zhongshuang 11 (Table 3).
Response of individual amino acids to nitrogen (N) rate in three genotypes (Yangyou6, YY6; Zhongshuang 11, ZS11; and Zheyou 50, ZY50) during the 2010/11 and 2011/12 growing seasons (mg/g) ± s.e., the number of residual error degrees of freedom of the standard errors was 35

* and † indicate glutamic acid and aspartic acid, respectively, are a combination of glutamine acid and glutamine and aspartic acid and asparagine, respectively.
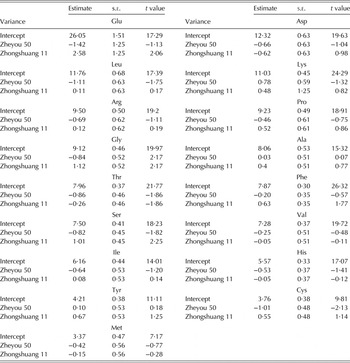
To further explore the effect of N rate on the increasing rate of individual amino acids, regression analysis was performed. It was found that Glu, Leu and Asp exhibited not only the highest absolute concentration among the individual amino acids but also the highest slope (linear coefficient) (Table 4). Two sulphur-containing amino acids, Met and Cys, showed the least potential for increasing with N rate (Table 4).
Coefficients for intercept and linear terms of trends over nitrogen rate for individual amino acids for three genotypes using Yangzhou 6 as a standard reference for the 2010/11 and 2011/12 growing seasons*

* The 5, 1 and 0·1% t values based on the appropriate error degrees of freedom (38) were 1·686, 2·429 and 3·319.
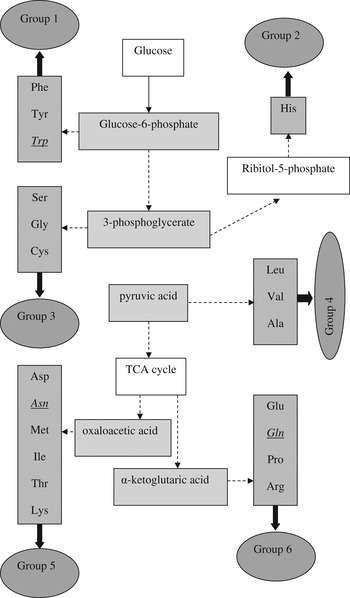
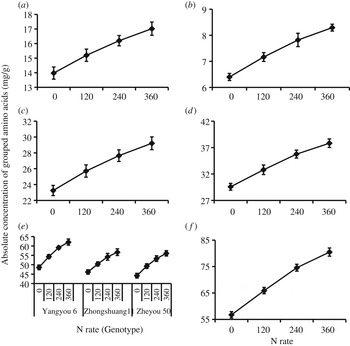
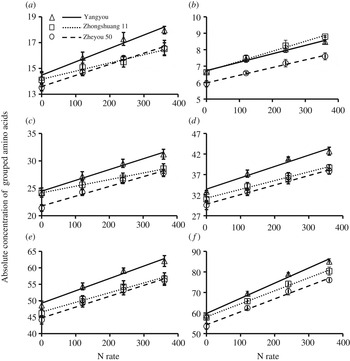
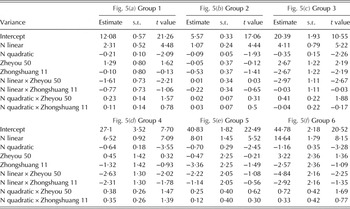
To further analyse the effect of N application on amino acid concentration, 17 amino acids were divided into six groups according to their biosynthetic pathways (Fig. 3). Group 1 comprised Phe and Tyr, Group 2 comprised His, Group 3 comprised Ser, Gly and Cys, Group 4 comprised Leu, Val and Ala, Group 5 comprised Lys, Met, Thr, Ile and Asp, and finally, group 6 comprised Glu, Pro and Arg. The N rate and genotype significantly (P < 0·01) affected the absolute concentrations of the grouped amino acids; however, only Group 5 showed no significant N rate × genotype interaction (Table 1c ). For absolute concentrations of the grouped amino acids, the sequence was as follows: Group 6 > Group 5 > Group 4 > Group 3 > Group 1 > Group 2 (Figs 4(a)–(f)). The results of regression analysis revealed that the grouped amino acids responded to N rates in the same way (Figs 5(a)–(f) and Table 5). In Group 1, two genotypes, Yangyou 6 and Zhongshuang 11, showed a linear response to N rate, but both showed linear and quadratic terms in Zheyou 50. Furthermore, the increased potential of the N rate in the genotypes was as follows: Yangyou 6 > Zheyou 50 > Zhongshuang 11 (Fig. 5(a) and Table 5). The absolute concentration of the amino acids in Group 2 responded linearly to N rate and had the weakest response (Table 5). The absolute concentrations of the amino acids in Groups 3, 4, 5 and 6 responded to N rates both linearly and in quadratic terms, except for Zhongshuang 11 in Group 3 (Table 5).
Illustration of the biosynthetic pathway of amino acids from glucose. Six groups were identified. Trp was in group 1, but it was degraded during hydrolysis. Thus, Trp was italicized and underlined. Asn and Gln were in groups 5 and 6. However, they were also degraded into Asp and Glu, and the content of each component was a combination of Asp and Asn (Glu and Gln). The simplified legend was outlined from Berg et al. (Reference Berg, Tymoczko and Stryer2002) and Buchanan et al. (Reference Buchanan, Gruissem and Jones2002).

Effect of four nitrogen rates (0, 120, 240 and 360 kg N/ha) and three genotypes (Yangyou 6, Zhongshuang 11 and Zheyou 50) on concentrations of the six amino acid groups, (a) group 1 with combined genotypes, (b) group 2, (c) group 3 with combined genotypes, (d) group 4, (e) group 5 and (f) group 6 over 2010/11 and 2011/12 two growth seasons. Error bars indicate standard error of mean.

Relationships between nitrogen rate (0, 120, 240 and 360 kg N/ha) and absolute concentrations of the six grouped amino acids, (a) group 1, (b) group 2, (c) group 3, (d) group 4, (e) group 5 and (f) group 6 over 2010/11 and 2011/12 two growth seasons. Equations are shown in Table 5. Error bars indicate standard error of mean.

Coefficients for intercept, linear and quadratic terms of trends over nitrogen rate for the six grouped amino acids for three genotypes using Yangyou 6 as a standard reference during the 2010/11 and 2011/12 growing seasons*

* The 5, 1 and 0·1% t values based on the appropriate error degrees of freedom (38) were 1·686, 2·429 and 3·319.
Effect of nitrogen rate and genotype on proportion of amino acids
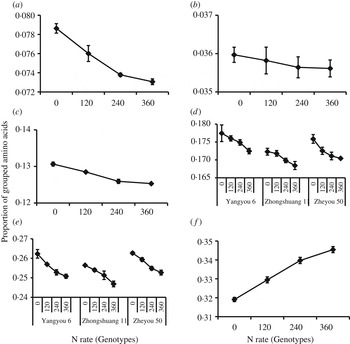
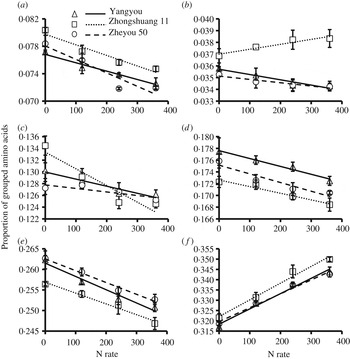
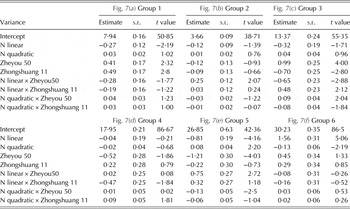
Although the absolute concentration of each amino acid demonstrated a positive response to N rate, whether the proportions of individual amino acids responded similarly needs to be addressed. Consequently, the effect of N rate and genotype on a proportion of individual amino acids was analysed (Figs 6 and 7). Proportions of grouped amino acids were influenced significantly (P < 0·05) by genotype and N application except that the proportion in Group 2 was not significantly affected by N rate (Table 1c and Fig. 6(b)). Furthermore, the proportions in Groups 1, 2 and 3 were not significantly affected by the interactions between N rate and genotype, but the proportions in Groups 4, 5 and 6 were significantly affected (P < 0·001)(Table 1c ). The proportion of total amino acid concentration was the largest in Group 6 with > 0·30 (Fig. 6(f)). Group 5 ranked second with > 0·25 of total amino acid concentration of > 0·25 (Fig. 6(e)). However, Group 2 had the lowest proportion, with total amino acid concentration of < 0·04 (Fig. 6(b)). Usually, the proportions of amino acids in Groups 1–5 exhibited a decreasing trend as N rate increased, which was in contrast to the trend in Group 6 (Figs 6(a)–(e) and Figs 7(a)–(e)). Notably, the responses of genotypes to the N rate in terms of the proportions of amino acids in Group 2 were not always the same among the genotypes (Fig. 7(b)). The directional change in the proportion of total amino acid concentration in Zhongshuang 11 in Group 2 was opposite to that in Yangyou 6 and Zheyou 50 as the N rates increased (Fig. 7(b)). These results indicate that Glu, Pro and Arg (Group 6) accumulated to a higher level in canola seeds. The results of regression analysis revealed that the proportions of all of the grouped amino acids responded to N application in a linear way because of the non-significant quadratic coefficients (Table 6). The proportions in Groups 4, 5 and 6 showed very significant (P < 0·01) linear responses to N application (Table 6). However, the proportions of Groups 1, 2 and 3 in some of the genotypes exhibited non-significant linear responses, i.e., Group 1 in Zheyou 50, Group 2 in Yangyou 6 and Zheyou 50, and Group 3 in Zhongshuang 11 and Zheyou 50 (Table 6).
Effect of four nitrogen rates (0, 120, 240 and 360 kg N/ha) and three genotypes (Yangyou 6, Zhongshuang 11 and Zheyou 50) on the proportions of the six grouped amino acids, (a) group 1 with combined genotypes, (b) group 2 with combined genotypes, (c) group 3 with combined genotypes, (d) group 4, (e) group 5 and (f) group 6 over the 2010/11 and 2011/12 growing seasons. Error bars indicate standard error of mean.

Relationships between nitrogen rate (0, 120, 240 and 360 kg N/ha) and the proportions of six amino acid groups, (a) group 1, (b) group 2, (c) group 3, (d) group 4, (e) group 5 and (f) group 6 over the 2010/11 and 2011/12 growing seasons. Equations were shown in Table 6. Error bars indicate standard error of mean.

Coefficients for intercept, linear and quadratic terms of trends over nitrogen rates for the proportion of six grouped amino acid concentration for three genotypes using Yangyou 6 as a standard reference for 2010/11 and 2011/12 growth seasons*

* The 5, 1 and 0·1% t values based on the appropriate error degrees of freedom (38) were 1·686, 2·429 and 3·319.
DISCUSSION
Proteins and amino acids are important components (in addition to lipids) of canola seeds and, hence, the meal following oil extraction. Generally, proteins and amino acids occupy c. 0·50 of the total compounds in canola meal (Bell Reference Bell1984). The effect of N fertilizer application on seed protein and total amino acid concentration in canola was positive, as documented in previous investigations and in the present study (Rathke et al. Reference Rathke, Christen and Diepenbrock2005; Karamzadeh et al. Reference Karamzadeh, Mobasser, Ramee and Ghanbari-Malidarreh2010; Grant et al. Reference Grant, Derksen, McLaren and Irvine2011; Aminpanah Reference Aminpanah2013). Furthermore, the effect of the N rate × genotype interaction on seed protein, oil and total amino acids was also significant It has been reported that the genotype-environment interaction was an important influence on canola seed oil content when using Chinese and German cultivars (Zhao et al. Reference Zhao, Becker, Zhang, Zhang and Ecke2005): however, the environmental aspect was complex and N was not the essential factor that was considered in that study. There is a lack of exact information on the interaction response between N application and genotype in canola. Although a negative relationship between seed protein and oil content has been reported in oil crops, such as soybean and canola (Ray et al. Reference Ray, Fritschi and Heatherly2006; Zhao et al. Reference Zhao, Becker, Zhang, Zhang and Ecke2006; Liang et al. Reference Liang, Yu, Wang, Lian, Wang, Wei, Gong, Liu, Fang and Zhang2010), the present study found that the relationship between N application and genotype had a significant effect on seed protein content. This indicated a significant improvement in the seed protein content in the canola genotypes. Because protein and total amino acids are normally significantly correlated, similar N rate and genotype interaction effects on total amino acids are possible.
Regression analysis revealed that the mode of decrease in the seed oil content and the increase in protein and total amino acids from the high input of N fertilizer were also different. Seed oil content in the genotypes responded linearly to the increasing N rate, which supports the view that N fertilizer has a negative effect on seed oil content. Although there is no report of the upper limit of seed protein content in canola seed, increased seed protein content with high inputs of N fertilizer can be offset by adverse effects such as late maturity, lodging and reduced yield (Dong et al. Reference Dong, Li, Eneji and Zhang2012; Zhang et al. Reference Zhang, Li, Song, Liu, Yang, Tang, Zheng, Wang and Ding2014a , Reference Zhang, Li, Yang, Li, Zhang, Liu, Wang, Tang and Ding b ).
For the six groups of amino acids, the concentrations of the fifth and sixth groups were major, contributing c. 0·60 of the total amino acids. Lohaus & Moellers (Reference Lohaus and Moellers2000) found that glutamine and glutamate were the major types of amino acids in the phloem sap and Serine ranked second. However, in the present study Ser was not second and Glu was the most abundant, which was in accordance with the work of Josefsson (Reference Josefsson1970). This discrepancy suggests that the translocation of amino acids in the leaves and the synthesized amino acids were both important for seed amino acid composition. Thus, the considerable amounts of intermediates produced during glycolysis will enter the tricarboxylic acid cycle (TCA) and reduce the amounts of substrates that are available for the synthesis of other groups of amino acids. In the present study, it was also found that the concentrations of all of the individual amino acids can be significantly increased by N fertilizer application (Table 3). However, the efficiency of the N fertilizer was different for individual amino acids as identified by regression analysis. The greater slopes for Glu, Arg and Pro were consistent with the grouped amino acids. Although the absolute concentration of Lys was less than that of Arg and Pro, the concentration was increased more quickly by N fertilizer than that of Arg and Pro. These results suggest that improvement of specific amino acids is possible by N application. In addition to the concentration of amino acids in canola seeds, the present study also examined responses in the proportion of each amino acid to the N rate. It was indicated that the proportions of amino acids in Groups 1–5 were generally reduced as N rate increased, except for Zhongshuang 11 in Group 2; however, the proportions increased in Group 6. This interesting result could be attributed to the different contributions of distinct amino acid groups to the total amino acids. In other crops, increased N rate can also increase certain components, such as Glu, and can decrease others, such as Lys (Dubetz & Gardiner Reference Dubetz and Gardiner1979; Okoh et al. Reference Okoh, Olugbemi and Abed1985). The decreased amino acid proportion was attributed to the large amount of amino acids, which was increased by N fertilizer in the sixth group. The higher Glu, Pro and Arg concentration might be closely related to the metabolic flow from the TCA cycle.
In addition to the importance of the Glu, Pro and Arg concentration in canola seed, notably, the two sulphur-containing amino acids (Met and Cys) could also be improved by N application. This phenomenon might be explained by the synergistic effect of N fertilizer. For example, Friedrich & Schrader (Reference Friedrich and Schrader1978) found nitrate reductase activity, glutamine synthetase activity and chlorophyll content to be significantly reduced in maize seedlings when there was a deficiency in sulphur (S) supply; however, nitrate N in leaf blades and stems markedly increased with S deprivation. Thus, they suggested that N and S metabolism is regulated in such a way that in the absence of S, there is an increase in amide N, i.e., an accumulation of amino acids with high amino groups (Friedrich & Schrader Reference Friedrich and Schrader1978). Other studies have revealed that canola plants require large amounts of S for growth and development, and increased N utilization can simultaneously increase S absorption from the soil (Ahmad & Abdin Reference Ahmad and Abdin2000; Karamanos et al. Reference Karamanos, Goh and Poisson2005). Although Josefsson (Reference Josefsson1970) revealed that there was no interaction between N and S fertilization regarding the seed protein content, increments of Met and Cys were significantly increased with S nutrition treatment. Thus, increased S has significant potential to synthesize S-containing amino acids, Met and Cys. The present study suggests that N did increase Met and Cys absolute concentrations but that their proportions did not increase correspondingly.
Accumulation of some amino acids, such as Glu, Pro and Arg, was increased with N application. However, protein synthesis and meal quality requires a balance in the amino acid composition (Newkirk & Classen Reference Newkirk and Classen2002; Bandegan et al. Reference Bandegan, Kiarie, Payne, Crow, Guenter and Nyachoti2010). For example, Gloaguen et al. (Reference Gloaguen, Le Floc'h, Corrent, Primot and Van Milgen2012) found that a diet with a deficiency of Val but an excess of Leu led to a quick decrease in feed intake. The functions of some amino acids have been extensively studied, such as Lys and Arg. Enhancing their content is beneficial to animal health and human health (Angkanaporn et al. Reference Angkanaporn, Ravindran, Mollah and Bryden1997; Hrupka et al. Reference Hrupka, Lin, Gietzen and Rogers1999). Clearly, a strong enhancement of Glu, Arg and Pro by N fertilizer was not beneficial for achieving a balanced amino acid composition. When other important ratios of specific amino acid composition to the total amino acid content (such as the Lys ratio) decrease, it is necessary to add these components to the diet. Thus, improvement in the amino acid composition by N fertilizer application should consider the equilibrium of the different components and their requirements in animal nutrition.
CONCLUSIONS
In the present investigation, N fertilizer significantly increased the canola seed protein content but decreased the oil content. The seed total amino acid concentration responded to N fertilizer significantly and positively, in both linear and quadratic terms, as determined by regression analysis. Furthermore, concentrations of individual amino acids were improved significantly by N fertilizer. The highest concentration and the largest rate of increase was seen in Glu, whereas Met and Cys ranked the lowest in the absolute concentration and in the rate of increase with N fertilizer application. The responses of the proportions of each amino acid to N fertilizer were different. Three components, Glu, Pro and Arg, were the major amino acids that were present and were positively associated with the N rate. Usually, the proportions of other individual amino acids decreased as the N fertilizer levels increased due to the large increases in the Glu, Pro and Arg concentrations. Two S-containing amino acids, Met and Cys, could also be significantly improved by N application as they were always deficient in major crops.
We are grateful to Dr. Shuijin Hua for his critical revisions of the manuscript and to the anonymous reviewers for greatly improving the quality of the manuscript. We also give thanks to the Yangzhou Bureau of Meteorology for providing the precipitation data. This work was funded by the Natural Science Foundation of China (Grant No. 31000685), the Priority Academic Program Development of Jiangsu Higher Education Institutions, the Doctoral Fund of the Ministry of Education of China (Grant No. 20103250120008) and the China Modern Agricultural Production System Project (nycytx—00510 and 2014BAD11B03).