Implications
Adding nitrate to the diet or increasing the level of dietary lipid has been shown to reduce methane from cattle. These strategies should not adversely affect animal health or performance. The use of nitrate in ruminant diets has been limited due to the potential adverse effects on health and productivity. Following four weeks adaptation, neither the addition of nitrate to the diet (18 g nitrate/kg diet dry matter (DM)) nor increased dietary lipid (48 g acid hydrolysed ether extract/kg diet DM) adversely affected steer health or performance. These strategies provide the potential for reducing the environmental impact of beef enterprises.
Introduction
Livestock systems, in particular ruminant production, are under increasing political pressure to reduce their greenhouse gas outputs. Breeding, enterprise and systems management and diet formulation are all possible strategies to reduce methane (CH4) from cattle (Cottle et al., Reference Cottle, Nolan and Wiedemann2011), with diet formulation representing one of the most practical and promising approaches. In addition to determining the effectiveness of dietary strategies on CH4, it is important to report their implications on health, overall performance and efficiency.
Recent interest in the controlled feeding of nitrate has been stimulated because the reduction of nitrate to ammonium in the rumen of adapted animals provides an alternative hydrogen sink to the production of CH4 (Van Zijderveld et al., Reference Van Zijderveld, Gerrits, Apajalahti, Newbold, Dijkstra, Leng and Perdok2010). The reduction of nitrate to nitrite and then to ammonium provides an energetically more favourable route for disposal of metabolic hydrogen produced during fermentation of feed carbohydrates in the rumen than the production of CH4. Although nitrate has been shown in many studies to reduce CH4 emissions from ruminants (Nolan et al., Reference Nolan, Hegarty, Hegarty, Godwin and Woodgate2010; Van Zijderveld et al., Reference Van Zijderveld, Gerrits, Apajalahti, Newbold, Dijkstra, Leng and Perdok2010 and Reference Van Zijderveld, Gerrits, Dijkstra, Newbold, Hulshof and Perdok2011; Hulshof et al., Reference Hulshof, Berndt, Gerrits, Dijkstra, van Zijderveld, Newbold and Perdok2012; Li et al., Reference Li, Davis, Nolan and Hegarty2012), the potential for its use has been hindered due to the toxicity of the intermediate product (nitrite). In the rumen, microbes rapidly reduce nitrate to nitrite and then reduce nitrite to ammonia. However, in an animal that has not been previously exposed to nitrate, the rate of reduction of nitrite to ammonia is slower than the reduction of nitrate to nitrite resulting in the accumulation of nitrite in the rumen (Van Zijderveld et al., Reference Van Zijderveld, Gerrits, Apajalahti, Newbold, Dijkstra, Leng and Perdok2010; Jeyanathan et al., Reference Jeyanathan, Martin and Morgavi2014). Absorbed nitrite binds to haemoglobin (Hb) in the blood converting it to methaemoglobin (MetHb) which is not capable of transporting oxygen to tissues. High concentrations of MetHb can cause methaemoglobinaemia, in which the functional oxygen carrying capacity of the blood is reduced. Blood MetHb is used as a marker for nitrate poisoning with a value of 30% of total Hb associated with clinical symptoms (Bruning-Fann and Kaneene, Reference Bruning-Fann and Kaneene1993). Nitrate toxicity may reduce animal performance (feed intake, growth, loss of BW), but in more severe cases may be fatal (Cockburn et al., Reference Cockburn, Brambilla, Fernández, Arcella, Bordajandi, Cottrill, van Peteghem and Dorne2013). Therefore, the use of nitrate in ruminant diets requires careful consideration.
Increasing the concentration of dietary lipid has been shown to reduce CH4 emissions from ruminants (Martin et al., Reference Martin, Morgavi and Doreau2010; Grainger and Beauchemin, Reference Grainger and Beauchemin2011; Patra, Reference Patra2013). This is achieved through various mechanisms: fatty acids are not fermented in the rumen and therefore increasing dietary lipid concentration reduces the proportion of feed which is fermentable within the rumen; lipids can also reduce CH4 production by coating fibre particles, reducing their digestibility, and by reducing the numbers and activity of the rumen methanogens and protozoa responsible for methanogenesis (Johnson and Johnson, Reference Johnson and Johnson1995; Patra, Reference Patra2013). Dietary lipid can be increased through the addition of pure fats or oils to the diet or through the use of by-products from distilleries, breweries or plant oil extraction as ingredients in the diet (Brask et al., Reference Brask, Lund, Weisbjerg, Hellwing, Poulsen, Larsen and Hvelplund2013). At concentrations >6% (DM basis), lipid can negatively affect feed intake and productivity, but lipid concentrations <6% can be used with no adverse effects (Brask et al., Reference Brask, Lund, Weisbjerg, Hellwing, Poulsen, Larsen and Hvelplund2013).
When considering mitigation strategies for beef cattle, studies have been mainly focussed on breeds that are managed more intensively, with less focus on breeds suited to extensive systems. The performance characteristics of hill and upland breeds, when managed more intensively, may be considerably different to that of intensively managed breeds, although the availability of performance data is limited. For example, baseline performance data of Luing cattle, a hill and upland breed, is unavailable in the literature, even though their popularity as suckler cows is increasing in the United Kingdom and consequently the numbers of Luing calves reaching finishing units for more intensive finishing is also rising. Calf registrations of Luing and crossbred Luing calves in the United Kingdom has increased from 6165 in 2011 to 6525 in 2014 and is likely to increase further in 2015 (Agriculture and Horticulture Development Board, UK, 2015, personal communication). The large differences in performance are likely a result of considerable genetic and physiological differences. It is important to consider the effect of mitigation strategies across different breeds, alongside their implications for health and productivity. If this differs across different breeds, the industry and beef producers need to understand this if a real change in CH4 output is to be delivered in commercial practice.
The primary objective of the present study was to investigate the effect of adding nitrate, or increasing the concentration of dietary lipid, within two contrasting diets which are typical of industry practice, on the performance and carcass quality of finishing beef steers of two breeds. Due to the risks associated with feeding nitrate, a further objective was to investigate the effect of dietary nitrate on blood MetHb concentrations.
Material and methods
This study was conducted at the Beef and Sheep Research Centre, SRUC, UK. The experiment was approved by the Animal Experiment Committee of SRUC and was conducted in accordance with the requirements of the UK Animals (Scientific Procedures) Act 1986.
Experimental design, animals and diets
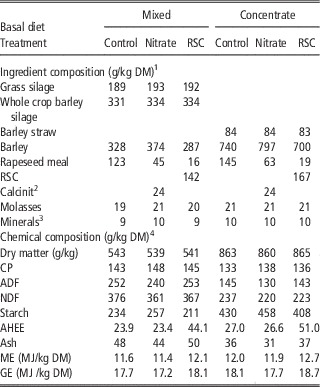
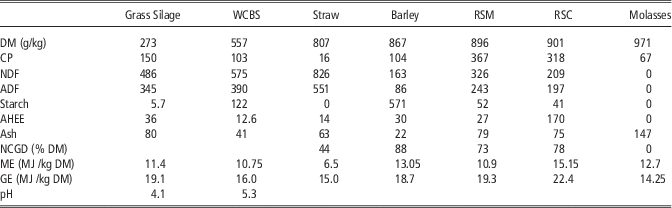
The experiment was of a two×two×three factorial design, comprising two breeds (CHX, crossbred Charolais; LU, purebred Luing), two basal diets (concentrate-straw or silage-based) and three treatments selected for their potential CH4 mitigation effects (Control, Nitrate or RSC). The breed types were selected to represent two commercially relevant breeds where CHX cattle represent a common continental sired beef breed in the UK well known for fast growth and excellent carcass conformation, while the LU breed is typical of a more extensively managed hardy hill and upland breed. The steers were fed one of two basal diets (as total mixed rations) using a diet mixing wagon, consisting of (g/kg DM) forage to concentrate ratios of either 520 : 480 (Mixed) or 84 : 916 (Concentrate). Within each basal diet the steers were offered one of three treatments: (i) Control containing rapeseed meal as the main protein source which was replaced with either (ii) Nitrate in the form of calcium nitrate (Calcinit, Yara, Oslo, Norway; 18 g nitrate/kg diet DM) or (iii) an added source of lipid in the form of pelleted RSC which is a by-product from cold-pressing rapeseed (acid hydrolysed ether extract (AHEE) increased from 25 to 48 g AHEE/kg diet DM). The ingredient and chemical composition of the experimental diets are given in Table 1. The chemical composition of individual components is given in Table 2. The DM contents of individual components were determined on duplicate samples twice weekly and bulked feed samples (two per component) were analysed. Feed samples were analysed for DM, ash, CP, ADF, NDF, AHEE, starch and neutral cellulase and gammanase digestibility (Ministry of Agriculture Fisheries and Food, 1992) and gross energy by adiabatic bomb calorimetry. For the Nitrate and RSC-containing diets, calcium nitrate and RSC were incorporated first into a premix which contained the concentrate portion of the diet alongside minerals and molasses. Each batch of premix was mixed using a diet mixing wagon to produce a consistent premix. On a daily basis each premix was then mixed with the forage portion of the diet using the same mixing wagon to generate a consistent total mixed ration. Diets were mixed for a minimum duration of 20 min.
Ingredient composition and calculated chemical composition of experimental diets

RSC=rapeseed cake; DM=dry matter; AHEE=acid hydrolysed ether extract; ME=metabolisable energy; GE=gross energy.
1 Ingredient composition is the mean of the daily diets received by the animals across the experimental period.
2 Contained (g/kg DM): nitrate, 769; Ca, 229.
3 Contained (mg/kg): Fe, 6036; Mn, 2200; Zn, 2600; Iodine, 200; Co, 90; Cu, 2500; Se 30; (µg/kg): vitamin E, 2000; vitamin B12, 1000; vitamin A, 151515; vitamin D, 2500.
4 Chemical composition is the mean of two analyses per treatment, apart from DM which is the mean of 32 analyses.
Chemical composition of feeding stuffs (g/kg DM)

WCBS=whole crop barley silage; RSM=rapeseed meal; RSC=rapeseed cake; DM=dry matter; AHEE=acid hydrolysed ether extract; NCGD=neutral cellulase and gammanase digestibility; ME=metabolisable energy; GE=gross energy.
ME values (Thomas, Reference Thomas2004), were either estimated from near infra red spectroscopy (silage and WCBS), from NCDG and AHEE (barley, RSM and RSC) or from tabulated values for feed composition (straw and molasses).
In total, 84 steers (42 of each breed) were used. Thus, 14 animals (seven of each breed) were allocated to each of the six basal diet×treatment combinations. Due to the high risk of ill-health of unadapted animals gaining access to dietary nitrate, and the risks of forage-fed animals gaining access to large quantities of concentrate (e.g. acidosis), each diet×treatment combination was allocated to one pen (six pens in total). Treatments were balanced for sire within each breed, farm of origin and BW and were balanced across basal diets and treatment groups at the start of the experiment. Fresh water was provided ad libitum using a water trough, and diets were offered ad libitum to all steers using 32 electronic feeders (HOKO, Insentec, Marknesse, the Netherlands). Electronic feeders allow expression of performance in an environment close to on-farm conditions. All steers were bedded on wood fibre and sawdust to ensure that consumption of bedding did not contribute to nutrient intake.
Steers were adapted to the experimental diets in two stages. In stage one (day −56 to day −29), the animals were adapted to the basal diets. All steers were being fed the Mixed diet at the start of the adaptation period. Steers which were allocated the Concentrate diet, were adapted to the full concentrate inclusion over 4 weeks. This was undertaken at weekly intervals where diets comprising (g/kg DM) forage to concentrate ratios of 38 : 62, 25 : 75, 13 : 87 and 8 : 92 were offered during weeks 1, 2, 3 and 4, respectively. During this period, steers were trained to use the electronic feed intake recording equipment. In stage two (day –28 to day 0), steers were adapted to the treatments over a second 4-week period. Treatments (Nitrate and RSC) were progressively incorporated into the diets at 25%, 50%, 75% and 100% of the required level, on days −28, −21, −14 and −7, respectively.
Blood methaemoglobin measurements
All steers receiving dietary nitrate had blood samples taken weekly throughout the second treatment adaptation phase to monitor blood MetHb concentrations. Blood samples were taken when MetHb was expected to be greatest, that is, 3 h after fresh feed was offered (Van Zijderveld et al., Reference Van Zijderveld, Gerrits, Apajalahti, Newbold, Dijkstra, Leng and Perdok2010), on the day after dietary nitrate was increased (days −27 (25%), −20 (50%), −13 (75%) and −6 (100%)) and then 15 days after maximum nitrate inclusion was achieved (day 8). To assess the long-term effects of feeding nitrate, blood samples were obtained at day 87 and day 101 (128 days after initial inclusion of nitrate). Blood samples were taken from the caudal vein into an evacuated tube (Vacuette; Griener Bio One Ltd., Gloucestershire, UK) containing heparin. MetHb concentration in blood was measured within 2 h of sampling by co-oximetry (Stat Profile Critical Care Xpress; Nova Biomedical UK, Cheshire, UK). For each steer, dry matter intake (DMI) (kg/day) and weekly BW were assessed throughout adaptation.
56-day performance test
After full adaptation to the experimental diets, performance and feed efficiency were characterised for all steers over a 56-day test period (day 0 to 56). Steers were maintained under controlled conditions, where group sizes within the pen remained constant. Individual DMI (kg/day) was recorded for each animal using the electronic feeding equipment and BW was measured weekly using a calibrated weigh scale. Measurements of BW were obtained before fresh feed was offered. For all steers, ultrasonic fat depth was obtained at the 12th/13th rib at the start (FD0) and end (FD1) of the 56-day test using an industry-standard Aloka 500 machine (BCF technology Ltd, Scotland, UK). Images were analysed using Matrox Inspector 8 software (Matrox Video and Imaging Technology Europe Ltd, Middlesex, UK). Hyslop et al. (Reference Hyslop, Duthie, Ross, Rooke and Roehe2012) assessed the consequences of alternative test lengths on the precision of average daily gain (ADG) and demonstrated that a 56-day measurement period, with weekly weighing is sufficient for characterising ADG of finishing beef cattle.
Pre-slaughter measurements and carcass quality
Steers remained within the same pens and on the same diets from the end of the 56-day test to slaughter. During this period CH4 measurements were obtained from 76 of these steers and reported in Troy et al. (Reference Troy, Duthie, Hyslop, Roehe, Ross, Wallace, Waterhouse and Rooke2015). On the day before slaughter, ultrasonic fat depth (FD2) at the 12th/13th rib was measured in all steers as described above. Steers were slaughtered in four batches of 17, 18, 21 and 25 steers on days 85, 106, 127 and 148, respectively. Steers were selected for slaughter based on BW and visual assessment of fatness. The steers were transported (~1 h) to a commercial abattoir and slaughtered within 2 h of arrival. Cattle were stunned using a captive bolt, exsanguinated and subject to low voltage electrical stimulation. Following hide removal, carcasses were split in half down the mid-line and dressed to UK specification (see Meat and Livestock Commercial Services Limited beef authentication manual, www. mlcsl.co.uk, for full description). EUROP conformation and fat classifications (Fisher, Reference Fisher2007), based on the UK scale, were allocated to all carcasses through visual assessment using a trained assessor.
Video image analysis (VIA) was used to estimate EUROP classifications (conformation and fat), total lean (kg) and total fat (kg) content of the whole carcass. The VIA systems in use in the EU are automatic machines that perform carcass evaluation based on images of the half carcass. The VBS 2000 system used in this study (E+V technology GmbH, Oranienburg, Germany) has been approved by the Department for Environment, Food and Rural Affairs (Defra) for use in the UK since 2010. The system operated at the end of the slaughter line after all necessary dressing and trimming had been completed. A pneumatically operated cradle presented the left half side of each carcass for imaging. The VIA camera took two images of the half carcass, a two-dimensional image and a pseudo three-dimensional image using structured light (Craigie et al., Reference Craigie, Navajas, Purchas, Maltin, Bunger, Hoskin, Ross, Morris and Roehe2012). The VBS 2000 required information on the category of the carcass (i.e. steer) and hot carcass weight (kg) and, by combining this information with data automatically captured by the VIA system (i.e. carcass dimensions, angles, areas, colour), predicted EUROP classification and total lean and fat content of the whole carcass.
Calculations and statistical analysis
MetHb data were analysed using the mixed procedure of SAS software (SAS Institute Inc., Cary, NC, USA) using a repeated measures ANOVA including the effects of basal diet, sampling day and their interactions. Data are reported as means and standard errors of the mean (SEM).
Data from three steers were unavailable as the animals were removed from the trial during the 56-day test period for health reasons unconnected to the diets and treatments imposed. Growth was modelled by linear regression of BW against test date, to obtain ADG, mid-test BW (mid-BW) and mid-test metabolic BW (mid-MBW=BW0.75). Mean DMI over the 56-day period was expressed as kg per day or as a proportion of mid-BW and mid-MBW. Feed conversion ratio (FCR) was calculated as average DMI per day (kg/day)/ADG. Residual feed intake (RFI) was calculated as deviation of actual DMI (kg/day) from DMI predicted based on linear regression of actual DMI on ADG, mid-MBW and FD1 (Basarab et al., Reference Basarab, Price, Aalhus, Okine, Snelling and Lyle2003). Cold carcass weight (CCW) was calculated as a percentage of slaughter BW (SBW) to determine killing out percentage (KO). To allow for statistical comparison, the EUROP carcass classification values were expressed on the equivalent 15-point scale (Kempster et al., Reference Kempster, Cook and Grantley-Smith1986). Statistical analyses of performance and carcass data were conducted using the mixed procedure of SAS software with the fixed effects of breed, basal diet and treatment, and the random effect of pen (and slaughter batch for carcass traits). In addition, in the analysis of FD1 and FD2 the deviation from the breed mean of FD0 was included as a covariable. The interaction effects of breed×basal diet, basal diet×treatment, breed×treatment and breed×basal diet×treatment were included in the model when these effects proved significant (P<0.05). Data are reported as means with their SEM. Differences between means were tested using a least square means comparison test (PDIFF option of SAS). Probability values were deemed significant where P<0.05 and indicated a tendency when probability values were between P=0.05 and 0.1.
Results
Blood met-haemoglobin response to dietary nitrate
During the adaptation period (Table 3), blood MetHb concentrations were similar when feed contained up to 75% of total nitrate (up to −13 days) but increased when nitrate was included at the 100% level (18 g nitrate/kg diet DM) on both basal diets. During adaptation there was no difference (P>0.05) in MetHb between the basal diets but blood MetHb concentrations of steers offered the Concentrate diet were consistently greater (day×basal diet interaction, P<0.001) than those offered the Mixed diet from day 8 onwards.
Changes in mean and maximum individual blood MetHb concentration (% total Hb) in relation to nitrate intake and long-term nitrate feeding

Number of steers=28.
Within a row, means without a common superscript differ (P<0.05).
*P<0.05, ***P<0.001.
1 Day relative to start of 56-day performance period.
2 Nitrate as percentage of maximum level of intake (100%=18 g/kg DM).
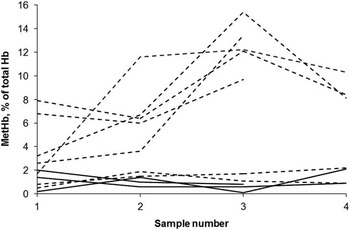
There was a consistent individual animal response across sampling days in MetHb concentrations when animals were offered the maximum dietary nitrate (100%, day −6 to 101). Of 28 steers, six always had MetHb concentrations less than the median MetHb for each sampling day whilst nine steers consistently had MetHb concentrations greater than the upper quartile. Figure 1 shows individual values for five steers with the smallest mean MetHb concentration and the five steers with the greatest mean concentrations and demonstrates consistency of steer response across time (from day −6 onwards, when 100% nitrate was offered). Maximum values for blood MetHb concentration (Table 3) were always <30% of total Hb. The greatest individual MetHb concentration value was 15.4%. There was no significant effect of breed on blood MetHb concentrations (P>0.05).
Changes in methaemoglobin (MetHb) concentrations (% total blood Hb) when fed 100% dietary nitrate (18 g nitrate/kg DM) for five steers with overall smallest and overall greatest mean MetHb concentrations. Solid lines and dashed lines represent the Mixed and Concentrate basal diets, respectively. Samples 1 to 4 refer to sampling days −6, 8, 87 and 101, respectively. Each line represents an individual animal. Sample 4 was not present for three animals as had been already been sent for slaughter before day 101.

56-day performance test
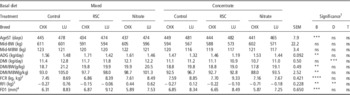
Neither age at the start (AgeST) nor Mid-BW differed between basal diets (P>0.05; Table 4). Although not significant, the greater ADG in Mixed-fed steers (1.54 v. 1.41 kg/day; P>0.05) was associated with greater daily DMI than Concentrate-fed steers (12.0 v. 11.0 kg/day; P<0.001). Basal diet did not affect DMI per kg BW (P>0.05). Concentrate-fed steers were more efficient (lower RFI) than Mixed-fed steers (−0.24 v. 0.22 kg; P<0.01) due to lower daily DMI. Basal diet did not affect FD1 (P>0.05).
Effect of breed (B), basal diet (D) and treatment (T) on growth, feed intake and feed efficiency of Charolais-sired (CHX) and purebred Luing (LU) steers fed either a mixed- or concentrate-based diet containing one of three treatments: Control, Nitrate or Rapeseed cake (RSC)

AgeST=age at start of test; Mid-BW=mid-test BW; Mid-MBW=mid-test metabolic BW; ADG=average daily gain at the end of the 56-day test; FCR=feed conversion ratio; RFI=residual feed intake; FD1=fat depth at the 12th/13th rib at the end of the 56-day test.
Number of animals=81
*P<0.05, **P<0.01, ***P<0.001.
1 Breed×diet and breed×treatment interaction effects were not significant for all variables (P>0.05).
2 Diet×treatment interaction (P<0.05): Concentrate-Nitrate different to Concentrate-RSC (P<0.05); Concentrate-Control different to Concentrate-Nitrate (P=0.07).
3 Diet×treatment interaction (P<0.05): Mixed-Nitrate different to Mixed-RSC (P<0.01).
4 Deviation from breed mean of FD0 (measured at start of 56-day performance test) fitted as covariable.
Mid-BW, ADG, DMI and FD1 (kg/day or g/kg BW) did not differ across treatments (P>0.05). An interaction between basal diet and treatment was identified for FCR and RFI (P<0.05). For Concentrate-fed steers, FCR did not differ between RSC and Control treatments (P>0.05). There was, however, a tendency for steers offered Nitrate to have improved (lower) FCR values compared to steers offered the Control (7.40 v. 8.17 kg, kg; P=0.07). Similarly Nitrate-fed steers achieved lower RFI values than steers offered the Control treatment but this was not significant (P>0.05). When offered the Mixed basal diet, neither Nitrate nor RSC treatments differed to the Control for FCR or RFI (P>0.05).
To balance for BW, CHX steers were younger than LU steers at the start of test (442 v. 476 day; P<0.001). Mid-BW did not differ between breeds (P>0.05). CHX steers achieved greater ADG than LU steers (1.56 v. 1.39 kg/day; P<0.01) with similar levels of daily DMI (11.4 v. 11.7 kg/day; P>0.05) and lower DMI per kg BW (18.98 v. 19.98 g/kg BW; P<0.01) to LU steers. Furthermore, FD1 was lower in CHX steers than LU steers (6.41 v. 8.28 mm; P<0.001). Thus, CHX steers were more efficient than LU steers with lower FCR (7.39 v. 8.57 kg, kg; P<0.001) and RFI (−0.2 v. 0.22 kg; P<0.01) values.
Pre-slaughter measurements and carcass traits
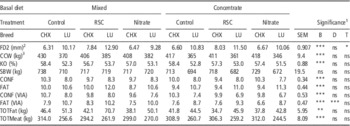
Carcass traits were not affected by basal diet (Table 5), except for fat score (determined by VIA) where Concentrate-fed steers had lower fat scores than Mixed-fed steers (8.02 v. 9.08; P<0.001). There was no difference between treatments for any carcass quality trait other than for FD2, where steers offered the RSC treatment had greater FD2 compared with the Control treatment (10.07 v. 8.48 mm; P<0.05).
Effect of breed (B), basal diet (D) and treatment (T) on carcass traits of Charolais-sired (CHX) and purebred Luing (LU) steers fed either a mixed- or concentrate-based diet containing one of three treatments: Control, Nitrate or Rapeseed cake (RSC)

FD2=pre-slaughter fat depth at the 12th/13th rib; CCW=cold carcass weight; KO=killing out %; SBW=slaughter BW; CONF=EUROP conformation (15-point scale) assigned by visual assessor; FAT=EUROP fatness (15-point scale) assigned by visual assessor; CONF (VIA)=conformation grade (15-point scale) assigned by VIA; FAT (VIA)=fatness grade (15-point scale) assigned by VIA; TOTFat=total fat content predicted by VIA; TOTMeat=total meat content predicted by VIA.
Number of animals=81
1 Breed×treatment and basal diet×treatment interaction effects were not significant for all variables (P>0.05).
2 Deviation from breed mean of FD0 (measured at start of 56-day performance test) fitted as covariable.
3 Breed×diet interaction (P<0.05): CHX-Concentrate different from LU-Concentrate and LU-Mixed (P<0.001); CHX-Mixed different from LU-Concentrate and LU-Mixed (P<0.001); LU-Mixed different from LU-Concentrate (P<0.01).
*P<0.05, **P<0.01, ***P<0.001.
Compared to LU steers, CHX steers had lower FD2 (6.99 v. 10.79 mm; P<0.001), greater SBW (723 v. 701 kg; P=0.051), greater CCW (415 v. 369 kg; P<0.001) and greater KO (57.5 v. 52.8%; P<0.001). LU steers offered the Concentrate diet had lower CCW than those offered the Mixed diet (357 v. 379 kg; P<0.05). For visually assigned EUROP classifications, CHX steers achieved greater conformation grades (9.90 v. 8.05; P<0.001) and lower fat grades (9.50 v. 11.03; P<0.001) compared with the LU steers which are in agreement with the VIA data. LU steers had greater total fat content (51.4 v. 40.4 kg; P<0.01) and lower total meat content (258.8 v. 305.7 kg; P<0.001) determined by VIA than CHX steers. There were neither any treatment nor breed×treatment interaction effects for any performance or carcass-related trait (P>0.05).
Discussion
Methaemoglobin response to dietary nitrate
Blood MetHb concentrations were monitored in Nitrate-fed steers for 128 days after introduction of nitrate to the diet: mean concentrations ranged from 2% to 7% of total Hb over this period with values in Concentrate-fed steers being consistently greater than in Mixed-fed steers. No individual MetHb measurement was >15% of total Hb which was substantially <30% total Hb, the value associated with clinical symptoms of methaemoglobinemia (Bruning-Fann and Kaneene, Reference Bruning-Fann and Kaneene1993). This agrees with most studies in which animals were adapted slowly to dietary nitrate by increasing nitrate intakes over a period of weeks (cattle:, Hulshof et al., Reference Hulshof, Berndt, Gerrits, Dijkstra, van Zijderveld, Newbold and Perdok2012; Van Zijderveld et al., Reference Van Zijderveld, Gerrits, Dijkstra, Newbold, Hulshof and Perdok2011 and sheep: Li et al., Reference Li, Davis, Nolan and Hegarty2012; Van Zijderveld et al., Reference Van Zijderveld, Gerrits, Apajalahti, Newbold, Dijkstra, Leng and Perdok2010). Slow adaptation to dietary nitrate allows the rate of reduction of nitrite to ammonia by the rumen microflora to increase and prevents accumulation of nitrite in the rumen and absorption from the rumen and thereby avoids conversion of haemoglobin to MetHb (Lee and Beauchemin, Reference Lee and Beauchemin2014). Only where nitrate was administered directly into the rumen (Takahashi et al., Reference Takahashi, Ikeda, Matsuoka and Fujita1998; Sar et al., Reference Sar, Santoso, Mwenya, Gamo, Kobayashi, Morikawa, Kimura, Mizukoshi and Takahashi2004) were greater MetHb concentrations than those found in the present study observed (34.3% and 18.37% in each of the studies, respectively), presumably because of transiently high concentrations of nitrite in the rumen generated by the method of administration. Recently, Newbold et al. (Reference Newbold, van Zijderveld, Hulshof, Fokkink, Leng, Terencio, Powers, van Adrichem, Paton and Perdok2014) removed steers from an experiment because MetHb concentrations in excess of 20% were observed during adaptation to nitrate. Although most steers removed (eight of nine) were fed higher dietary nitrate concentrations (24 and 30 g nitrate/kg diet DM) than used in the present study, one steer removed was fed 18 g nitrate/kg diet DM. There was no evidence in the current experiment for adverse effects of dietary nitrate over the 128-day monitoring period.
Measurement of blood MetHb over a 128-day period in the present study has demonstrated (i) that after adaptation to nitrate, MetHb concentrations remained elevated and (ii) that individual steers were consistent in their response to nitrate across time, that is, some steers always had elevated MetHb concentrations. Thus, although there was no association between MetHb and animal performance in the present study, in assessing the risk of methaemoglobinemia, this consistent difference in response to nitrate between individual animals, together with the observations of Newbold et al. (Reference Newbold, van Zijderveld, Hulshof, Fokkink, Leng, Terencio, Powers, van Adrichem, Paton and Perdok2014) should be noted. There was however no evidence for any association between meal size and MetHb concentrations in the present experiment and therefore the differences between individual animals in MetHb response to nitrate are more likely to be explained by differences between animals in rumen microflora, rates of absorption of nitrite from the rumen and the metabolism of absorbed nitrite.
Basal diet and treatment effects
Feeding diets containing a high proportion of cereals has been shown to reduce enteric CH4 production compared with forage-based diets (Johnson and Johnson, Reference Johnson and Johnson1995; Moss et al., Reference Moss, Givens and Garnsworthy1995; Mc Geough et al., Reference Mc Geough, O’Kiely, Hart, Moloney, Boland and Kenny2010; Rooke et al., Reference Rooke, Wallace, Duthie, McKain, de Souza, Hyslop, Ross, Waterhouse and Roehe2014). This strategy is attractive, in that accompanying improvements in animal performance and efficiency has been demonstrated (Lovett et al., Reference Lovett, Lovell, Stack, Callan, Finlay, Conolly and O’Mara2003; Mc Geough et al., Reference Mc Geough, O’Kiely, Hart, Moloney, Boland and Kenny2010). In the present study, steers offered a higher proportion of concentrate in the diet expressed better feed efficiency (RFI) than those offered a mixed forage : concentrate diet. These steers were also shown to have lower levels of CH4 production compared to steers offered higher quantities of forage (Troy et al., Reference Troy, Duthie, Hyslop, Roehe, Ross, Wallace, Waterhouse and Rooke2015).
Consistent results in the literature demonstrate, over the short-term, that dietary nitrate can be successfully administered at levels capable of reducing CH4 with no adverse effects on performance in sheep (Van Zijderveld et al., Reference Van Zijderveld, Gerrits, Apajalahti, Newbold, Dijkstra, Leng and Perdok2010; Li et al., Reference Li, Davis, Nolan and Hegarty2012; El-Zaiat et al., Reference El-Zaiat, Araujo, Soltan, Morsy, Louvandini, Pires, Patino, Correa and Abdalla2014), goats (Nguyen et al., Reference Nguyen, Khuc, Duong and Preston2010), dairy cows (Van Zijderveld et al., Reference Van Zijderveld, Gerrits, Dijkstra, Newbold, Hulshof and Perdok2011) and beef cattle (Huyen et al., Reference Huyen, Do, Preston and Leng2010). However, a comprehensive review by Bruning-Fann and Kaneene (Reference Bruning-Fann and Kaneene1993) reported a reduction in feed intake when nitrate was included in the diet at 10 g nitrate/kg DM (cattle) and 30 g nitrate/kg DM (sheep). In agreement, Hulshof et al. (Reference Hulshof, Berndt, Gerrits, Dijkstra, van Zijderveld, Newbold and Perdok2012) reported a tendency for calcium nitrate (fed at 22 g nitrate/kg DM) to reduce DMI by 6% in beef cattle fed a sugarcane-based diet. In contrast, Sangkhom et al. (Reference Sangkhom, Preston, Khang and Leng2012) reported improved growth rates and feed conversion efficiency in growing cattle when potassium nitrate (fed at 36.8 g nitrate/kg DM) was included in the diet. In agreement with most studies to date, feeding 18 g nitrate/kg diet DM had no adverse effects on DMI or ADG in the present study. Furthermore, the Nitrate treatment tended to improve FCR of steers offered the Concentrate basal diet but not the Mixed diet.
Van Zijderveld et al. (Reference Van Zijderveld, Gerrits, Dijkstra, Newbold, Hulshof and Perdok2011) reported the persistency of the effects of dietary nitrate in dairy cows fed a mixed forage and concentrate diet, in which measurements were obtained over four successive 24-day periods. No adverse effects on milk yield or energy balance were identified, but the reductions in energy losses as CH4 were not associated with any improvements in productivity. In the present study steers received the experimental diets for a minimum of 120 days and maximum of 176 days. No differences in SBW, CCW, carcass grades or yields were observed between treatments, and thus long-term feeding of nitrate did not adversely affect the level of production.
In the wider study from which this experiment is drawn, nitrate was shown to reduce CH4 (i.e. reduced energy loss) from steers offered the Mixed diet (Troy et al., Reference Troy, Duthie, Hyslop, Roehe, Ross, Wallace, Waterhouse and Rooke2015); however no response was observed in the present study on FCR or RFI. The benefits in reduced energy loss as CH4 observed by Troy et al. (Reference Troy, Duthie, Hyslop, Roehe, Ross, Wallace, Waterhouse and Rooke2015) may have been counter-balanced by sub-clinical effects of nitrate. In contrast, nitrate improved the FCR of steers offered the Concentrate diet, but with no aligned reduction in CH4 (Troy et al., Reference Troy, Duthie, Hyslop, Roehe, Ross, Wallace, Waterhouse and Rooke2015).
Although increased concentrations of dietary lipid has been shown to reduce CH4 from ruminants (Martin et al., Reference Martin, Morgavi and Doreau2010; Grainger and Beauchemin, Reference Grainger and Beauchemin2011; Patra, Reference Patra2013), at high concentrations in the diet lipid can negatively affect DMI and productivity (Brask et al., Reference Brask, Lund, Weisbjerg, Hellwing, Poulsen, Larsen and Hvelplund2013). Based on a meta-analysis, Patra (Reference Patra2013) demonstrated that dietary lipid concentrations in excess of 6% cause problems with productivity. Such diets with high lipid levels which negatively affect productivity are unsuitable for livestock producers due to their adverse consequences on the profitability of the enterprise. However, since the AHEE level in the RSC treatment was only 48 g/kg DM this dietary lipid concentration did not suppress DMI and no adverse effects were observed for any performance or carcass-related trait. The RSC treatment was shown to positively reduce CH4 production by 7.5% from steers offered the Mixed basal diet but no reduction in CH4 was observed on the Concentrate diet (Troy et al., Reference Troy, Duthie, Hyslop, Roehe, Ross, Wallace, Waterhouse and Rooke2015).
Breed effects
Data on the performance and efficiency of native hill breeds in direct comparison to the more common breeds of finishing cattle are sparse in the literature. The performance of the LU breed on the two finishing basal diets and dietary treatments considered here have not been reported to date, and thus provides novel insight into the performance of this breed when managed within indoor finishing units. When given diets typical of indoor finishing systems in the United Kingdom, considerable differences in performance characteristics between LU and CHX steers were determined. CHX steers expressed greater rates of ADG, consumed lower DMI (/day and /kg BW), thus had better feed efficiency compared with the LU steers. This inefficiency will have considerable impact on profitability. Although both breeds reached similar SBW, CHX cattle yielded greater CCW and better EUROP classifications, both of which are incorporated into current payment schemes in the United Kingdom. These differences are not unexpected given the selection history of these breeds. Here LU cattle are being compared with a breed intensively selected for fast growth, however in comparison to the average 2014 Scottish figures for ADG of cereal-based finishing enterprises (1.34 kg/day) (QMS, 2014), the Concentrate-fed LU cattle performed well (1.32 kg/day). Given the animal performance results reported here, it is anticipated that the dietary mitigation strategies considered will not adversely affect health or performance of either breed type. Consequently, the same practical advice with regard to dietary mitigation strategies can be given to commercial beef finishers looking to reduce CH4 regardless of the breed types being finished.
Conclusions
This study demonstrated that (i) the addition of nitrate to the diet or (ii) increasing the level of dietary lipid through the use of cold-pressed RSC, does not adversely affect either the performance or feed efficiency of finishing beef steers when used within either a Mixed forage/concentrate diet or a high Concentrate diet. The use of nitrate in the diet of ruminants has been limited to date due to the potential toxicity of the intermediate product (nitrite) which, at high levels, can severely impact animal health and productivity. The present study demonstrated that, following an appropriate adaptation period (4 weeks), feeding of nitrate at the level considered here (18 g nitrate/kg diet DM) together with the basal diet types studied did not provide measureable adverse effects, in terms of blood MetHb response (where the maximum level reached was 15% of total Hb), animal performance and carcass characteristics. This study demonstrated that the use of RSC to increase the level of dietary lipid from 25 to 48 g AHEE/kg diet DM did not suppress DMI or ADG. Furthermore, based on the same steers Troy et al. (Reference Troy, Duthie, Hyslop, Roehe, Ross, Wallace, Waterhouse and Rooke2015) demonstrated the effectiveness of these dietary treatments within a Mixed diet for reducing CH4 (CH4 yield was reduced by 17% and 7.5% through the use of Nitrate and RSC treatments, respectively). Therefore, it is concluded that these are appropriate strategies on Mixed diets. Although the use of these mitigation strategies within a high concentrate diet was shown in the present study to provide no adverse effects on performance, they were not effective at reducing CH4 yield (Troy et al., Reference Troy, Duthie, Hyslop, Roehe, Ross, Wallace, Waterhouse and Rooke2015) and therefore cannot be recommended for use within high concentrate diets.
Acknowledgements
The authors are grateful to all support staff at SRUC’s Beef and Sheep Research Centre for their technical assistance. SRUC receives funding from Scottish Government’s Rural and Environmental Science and Analytical Services Division. The research was funded by AHDB Beef & Lamb (a division of the Agriculture and Horticulture Development Board (AHDB)), the Scottish Government and the UK Department for Environment, Food and Rural Affairs (DEFRA) and the devolved administrations through the UK Agricultural Greenhouse Gas Inventory Research Platform (http://www.ghgplatform.org.uk).