


INTRODUCTION
Broad interest in how plant communities change along environmental gradients was launched by the dispute between Clements (Reference CLEMENTS1916, Reference CLEMENTS1936) and Gleason (Reference GLEASON1926) about whether such communities change sharply or continuously. Gleason's (Reference GLEASON1926) more continuous and individualist view has come to dominate ecological thinking, largely because of analyses of species distributions and boundaries in a variety of habitats (Austin Reference AUSTIN1985, Austin & Smith Reference AUSTIN and SMITH1989, McIntosh Reference MCINTOSH1967, Reference MCINTOSH1975; Whittaker Reference WHITTAKER1967). Despite this consensus, the structure of tropical montane plant communities along elevation gradients remains an area of active debate. A variety of older studies and reviews have argued that sharp ecotones between forest communities are common on tropical mountains, with relatively abrupt shifts in plant species composition and physiognomy (Grubb Reference GRUBB1977, Grubb & Whitmore Reference GRUBB and WHITMORE1966, Richards Reference RICHARDS1952, Reference RICHARDS1996; Whitmore Reference WHITMORE1984). More recent studies have bolstered this view, suggesting that sharp ecotones can occur because of shifts in underlying soils, sharp changes in humidity associated with persistent cloud cover, or differences in disturbance histories (Fernandez-Palacios & de Nicolas Reference FERNANDEZ-PALACIOS and DE NICOLAS1995, Hemp Reference HEMP2006, Kitayama Reference KITAYAMA1992, Woldu et al. Reference WOLDU, FEOLI and NIGATU1989). In contrast, numerous studies have found evidence for more gradual changes in plant communities along tropical elevation gradients, with no evidence of discrete ecotones (Hamilton Reference HAMILTON1975, Lieberman et al. Reference LIEBERMAN, LIEBERMAN, PERALTA and HARTSHORN1996, Lovett Reference LOVETT1996, Reference LOVETT1998; Vázquez & Givnish Reference VÁZQUEZ and GIVNISH1998). Ashton (Reference ASHTON2003) provides one intermediate view between these two perspectives, concluding that the abruptness of community transitions may depend on which types of transitions (e.g. between lower montane forest to upper montane forest) are being studied.
The development of metacommunity theory has provided new tools for addressing how tropical montane forests vary with elevation (Holyoak et al. Reference HOLYOAK, LEIBOLD and HOLT2005, Leibold et al. Reference LEIBOLD, HOLYOAK, MOUQUET, AMARASEKARE, CHASE, HOOPES, HOLT, SHURIN, LAW, TILMAN, LOREAU and GONZALEZ2004). The metacommunity perspective stresses that communities are connected, and that their diversity and composition can be influenced by interactions with neighbouring communities through dispersal or migration (Leibold et al. Reference LEIBOLD, HOLYOAK, MOUQUET, AMARASEKARE, CHASE, HOOPES, HOLT, SHURIN, LAW, TILMAN, LOREAU and GONZALEZ2004). Plant communities along an elevation gradient are clearly a metacommunity, as they can potentially exchange species through dispersal.
In this study, the metacommunity structure of tropical montane forests was examined following the methods of Hoagland & Collins (Reference HOAGLAND and COLLINS1997) and Leibold & Mikkelson (Reference LEIBOLD and MIKKELSON2002). These approaches use aspects of species distributions along environmental gradients as a way of assessing the broader metacommunity structure and discriminating between alternative, hypothetical species patterns (Hoagland & Collins Reference HOAGLAND and COLLINS1997, Leibold & Mikkelson Reference LEIBOLD and MIKKELSON2002).
Hoagland & Collins (Reference HOAGLAND and COLLINS1997) proposed a family of models based on three quantifiable features of species distributions along a gradient: (1) the clustering of species boundaries; (2) the clustering of the modes of species abundances; and (3) the nestedness of species distributions, which measures the extent to which species-poor sites are subsets of species-rich sites. In this approach, a metacommunity is examined for the presence or absence of each of these three features. Leibold & Mikkelson (Reference LEIBOLD and MIKKELSON2002) suggested a similar approach that assessed metacommunity structure using three indices. The first, coherence, is a measure of the number of gaps, or embedded absences, within the distribution of a species along a gradient. A species with many absences in its range has a less coherent distribution than one with no gaps. The second index used by Leibold & Mikkelson (Reference LEIBOLD and MIKKELSON2002) is species turnover, which is a count of the number of times species replace each other along the gradient. This index measures the extent to which species appear to be ‘avoiding’ each other along a gradient. Species turnover is also the inverse of nestedness (Leibold & Mikkelson Reference LEIBOLD and MIKKELSON2002). The third index is the clustering of species boundaries, which is also used by Hoagland & Collins (Reference HOAGLAND and COLLINS1997). Both methods provide a way of comparing the structure of metacommunities from different stes.
This study had two objectives. The first was to apply these metacommunity techniques to determine how montane forest communities change along elevation gradients and to describe in more detail how these transitions were occurring. Data for this objective came from two elevation transects of 0.1-ha plots established in the Luquillo Mountains of eastern Puerto Rico. The second objective was to see if any patterns observed in the current study were also apparent in earlier studies from the literature. Any similarities may mean that the same factors are structuring montane tropical forests across regions.
METHODS
Study area
The Luquillo Experimental Forest (LEF) (18° 19.6′N, 65° 49.4′W) is located in eastern Puerto Rico and is ideal for this study because the flora is well-known, the sites are relatively accessible, and the history of human disturbance in the area has been extensively documented (Brown et al. Reference BROWN, LUGO, SILANDER and LIEGEL1983). The LEF covers 11,330 ha and ranges in elevation from 100 to 1075 m asl (Brown et al. Reference BROWN, LUGO, SILANDER and LIEGEL1983; Figure 1). At 350 m, temperatures average 24.5 °C in September, the warmest month, and 21.0 °C in January, the coolest (Brown et al. Reference BROWN, LUGO, SILANDER and LIEGEL1983). At 1051 m temperatures are, on average, about 4.5 °C lower (Brown et al. Reference BROWN, LUGO, SILANDER and LIEGEL1983). Mean annual precipitation increases with elevation from about 2300 mm at 100 m to 4700 mm at 700 m but then declines to 3600 mm at 1051 m (Brown et al. Reference BROWN, LUGO, SILANDER and LIEGEL1983). At all elevations rainfall averages more than 100 mm every month of the year. Precipitation is also higher on the north-facing, windward side of the mountains than on the south-facing, leeward side (Weaver Reference WEAVER1991). At upper elevations, the forest is frequently enveloped by clouds, reducing mean annual solar radiation to approximately 63% of nearby coastal areas (Briscoe Reference BRISCOE1966).
Luquillo Experimental Forest, Puerto Rico. Points indicate the locations of the permanent vegetation plots in the watersheds of the Sonadora and Mameyes Rivers.

The soils in the LEF are derived from volcaniclastic sediments, except in one area where a quartz diorite intrusion is present (Sieders Reference SIEDERS1971; Figure 1). Volcaniclastic sediments weather to dense clays (Ultisols), whereas soils derived from diorite are sandier (Beinroth Reference BEINROTH1982). With increasing elevation, soils typically become saturated and have a higher carbon content but lower bulk density along with reduced concentrations of phosphorus and iron (McGroddy & Silver Reference MCGRODDY and SILVER2000, Silver et al. Reference SILVER, LUGO and KELLER1999). McGroddy & Silver (Reference MCGRODDY and SILVER2000) attributed much of the variation in soil characteristics to frequent anaerobic periods at higher elevations.
The LEF has been managed by the U.S. Forest Service since 1917. Recent human disturbance peaked in the 1930s when logging and farming occurred at lower elevations (García-Montiel & Scatena Reference GARCÍA-MONTIEL and SCATENA1994, Thompson et al. Reference THOMPSON, BROKAW, ZIMMERMAN, WAIDE, EVERHAM, LODGE, TAYLOR, GARCÍA-MONTIEL and FLUET2002). Minor harvesting for timber management and charcoal production continued at low elevations until the 1970s (García-Montiel & Scatena Reference GARCÍA-MONTIEL and SCATENA1994, Zimmerman et al. Reference ZIMMERMAN, EVERHAM, WAIDE, LODGE, TAYLOR and BROKAW1994). There were no obvious signs of human disturbance at any of the sites in this study.
Hurricanes are the most important form of natural disturbance in Puerto Rico, with high winds causing extensive direct damage to the vegetation and the accompanying rainfall leading to landslides, especially at upper elevations (Scatena & Larsen Reference SCATENA and LARSEN1991, Walker et al. Reference WALKER, BROKAW, LODGE and WAIDE1991, Zimmerman et al. Reference ZIMMERMAN, EVERHAM, WAIDE, LODGE, TAYLOR and BROKAW1994). Hurricane Hugo made landfall in north-east Puerto Rico in September 1989, and Hurricane Georges hit south-eastern Puerto Rico in September 1998, 3 y before this study. No attempt was made to specifically assess the influence of hurricanes on forest structure with elevation. However, none of the study sites showed signs of recent landslides or extensive canopy damage.
Plots
Foster et al. (Reference FOSTER, FLUET and BOOSE1999) analysed photos of the LEF taken in 1936, during the period of greatest human disturbance to the forest and classified areas by forest type and per cent cover. Based on these assessments, sites for the plots were selected from areas that were in the 80–100% cover class in 1936 and were not considered secondary forest or were otherwise obviously disturbed.
From September 2001 to July 2002, we established two transects of permanent vegetation plots in the watersheds of the Sonadora and Mameyes Rivers in the LEF. The Sonadora watershed faces north-west and has clayey soils, whereas the Mameyes runs northward and has sandier soils below 550 m and clayey soils above (Figure 1). Each 0.1-ha vegetation plot was 50 × 20 m, with the long side perpendicular to the slope. Plots were placed every 50 m in elevation. The coordinates and elevation for the plots were determined using a GPS unit (Trimble TDC 1, Trimble Co., Sunnyvale, CA, USA). All of the plots were located on the main slope of the mountain and out of ravines formed by rivers. No effort was made to avoid gaps in the canopy, intermittent streams or other variations in the forest, but no plot included a permanent stream. The highest plot on each transect was determined by the elevation at the top of each watershed, and the lowest plots were limited by disturbed areas further down the mountains.
In each plot, all free-standing woody stems at least 1.0 cm in diameter at 130 cm in height were permanently tagged and identified. The flora of the LEF is well-known, and botanists from the University of Puerto Rico confirmed identifications of rare species.
Gradient analysis
Species distributions along the transects were evaluated following procedures outlined in Hoagland & Collins (Reference HOAGLAND and COLLINS1997) and Leibold & Mikkelson (Reference LEIBOLD and MIKKELSON2002). We analysed the clustering of the upper and lower boundaries of species ranges and the clustering of modes of species abundances with the G-test (Sokal & Rohlf Reference SOKAL and ROHLF1995). The number of boundaries or modes observed in each plot was compared with an expected number derived from the number of species in each plot. We used this approach (rather than Morisita's index employed by Hoagland & Collins, Reference HOAGLAND and COLLINS1997) because plots with more species would be expected to have more boundaries and modes, all else being equal, and this allowed us to test for the presence of clusters while controlling for differences in species richness. We evaluated the clustering of upper and lower species boundaries separately, since the locations of boundaries may be affected by different factors. We also assumed that species present in the highest plots were not at their upper boundaries, and that those in the lowest plots were not at their lower boundaries, and thus they were not included in the analysis.
The nestedness of species distributions along each transect was calculated using the method of Wright & Reeves (Reference WRIGHT and REEVES1992), as recommended by Hoagland & Collins (Reference HOAGLAND and COLLINS1997). This involves the calculation of two metrics, Nc and C. The former is a measure of the number of times the presence of a species at a site accurately predicts its presence at sites with more species. If sites were perfectly nested, the species from each site is a subset of the next most diverse site. Since the size of Nc is positively related to the number of species and sites, Wright & Reeves (Reference WRIGHT and REEVES1992) devised a standardized measure C, or relative nestedness index, that ranges from 0, where nestedness is not different from random, to 1, for perfect nestedness. Negative values of C can occur when nestedness is less than expected from random. Wright & Reeves (Reference WRIGHT and REEVES1992) suggest evaluating the significance of either C or Nc with Cochran's Q statistic.
We followed Leibold & Mikkelson (Reference LEIBOLD and MIKKELSON2002) in evaluating species turnover, which can be determined from the number of species replacements in a site by species matrix. A replacement occurs when two species have distributions that are offset by one plot. This result is compared with a null model in which species ranges are rearranged at random across the sites. Significance is determined by comparing the number of replacements in the data matrix after ordination by reciprocal averaging with the expected number based on 200 iterations. If fewer replacements than expected are found, then the distribution is highly nested (Leibold & Mikkelson Reference LEIBOLD and MIKKELSON2002).
In the approach of Leibold & Mikkelson (Reference LEIBOLD and MIKKELSON2002), coherence is measured in an ordinated species-by-site matrix by counting the number of embedded absences or times that a species is absent within its range. The more holes there are in the range of a species across a series of plots, the less coherent is its distribution. To determine if this number of absences is unexpectedly large or small, a comparison is made of the actual number of embedded absences with an expected number based on 200 iterations of a null model. In each iteration of the null model, the matrix of species by sites is rearranged at random, re-ordinated, and the number of embedded absences is counted (Leibold & Mikkelson Reference LEIBOLD and MIKKELSON2002). Significance is evaluated by comparing the number of embedded absences in the ordinated data with the expected number based on the null model.
Comparison with other transects
We analysed data from three previously published studies on tropical montane vegetation gradients. In the first, Lieberman et al. (Reference LIEBERMAN, LIEBERMAN, PERALTA and HARTSHORN1996) established a transect on Volcan Barva in north-east Costa Rica that consisted of eleven 1-ha plots at irregular intervals from 100–2600 m asl. Unlike the present study, the Volcan Barva census had a minimum stem size of 10 cm dbh and included woody lianas. We used data from Appendix 1 of Lieberman et al. (Reference LIEBERMAN, LIEBERMAN, PERALTA and HARTSHORN1996). In the second study, Kappelle et al. (Reference KAPPELLE, VAN UFFELEN and CLEEF1995) set up two transects in Chirripó National Park in southern Costa Rica. These transects consisted of 0.05-ha plots every 100 m in elevation in mature Quercus forests. In the plots, the canopy cover of all trees, shrubs, herbs and bryophytes was estimated for each species. In our analysis of Kappelle et al. (Reference KAPPELLE, VAN UFFELEN and CLEEF1995) we used data from the ‘Atlantic’ transect (from their Table 4a), which ranged from 2000–3100 m in elevation. In the third study, Vázquez & Givnish (Reference VÁZQUEZ and GIVNISH1998) established 0.1-ha study sites, consisting of ten 0.01-ha circular plots from 1500–2500 m in the Sierra de Manantlán Biosphere Reserve in Jalisco, Mexico. Presence/absence data of all vascular plants were recorded in each plot, and all woody stems greater than 2.5 cm dbh were measured. A complete summary of the data by species is not provided, limiting the analyses to the clustering of species boundaries using numbers derived from their Table 1 and Figure 3.
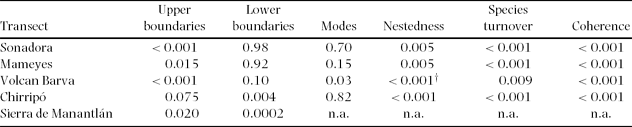
P values from the gradient analysis for the clustering of upper and lower boundaries of species ranges, modes of species abundances, the degree of nestedness, species turnover and coherence. The Sonadora and Mameyes transects were located in eastern Puerto Rico (present study); the Volcan Barva transect was in north-eastern Costa Rica (Lieberman et al. Reference LIEBERMAN, LIEBERMAN, PERALTA and HARTSHORN1996), the Chirripó transect was in central Costa Rica (Kappelle et al. Reference KAPPELLE, VAN UFFELEN and CLEEF1995); and the Sierra de Manantlán transect was in south-west Mexico (Vázquez & Givnish Reference VÁZQUEZ and GIVNISH1998). n.a. = data not available.
† Volcan Barva transect was significantly anti-nested.
RESULTS
Sonadora and Mameyes transects
Fifteen 0.1-ha plots were set up along the Sonadora transect, which ranged in elevation from 300–1000 m. A total 6562 stems of 99 species were marked. The Mameyes transect included 11 plots from 400–900 m, with 5799 stems of 77 species. (Details on stem density and basal area will be published elsewhere.) Across both transects, a total of 13 stems of three non-native species were identified. These species were excluded from the analyses. In addition, the analyses did not include 54 native species with four or fewer stems, including 30 species represented by a single individual.
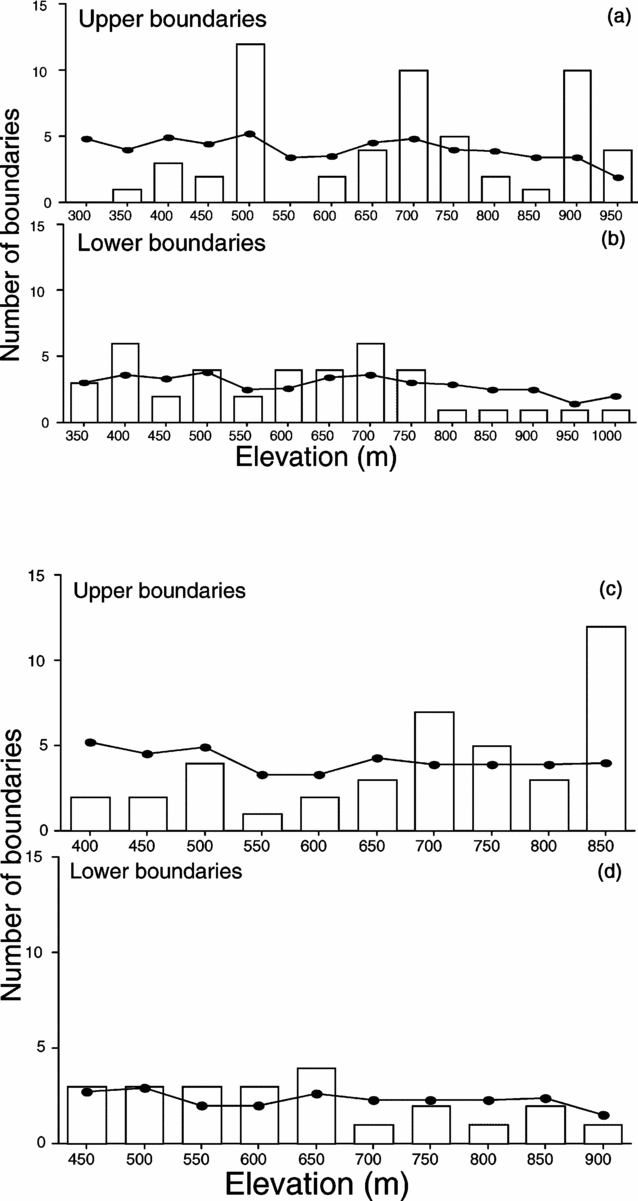
The uphill boundaries of species distributions were significantly clustered on both the Sonadora and Mameyes transects (Table 1, Figure 2). On the Sonadora, the upper boundaries formed three distinct peaks at 500, 700 and 900 m, suggesting discontinuities in the forest community immediately above those elevations. On the Mameyes, only one distinct cluster was present, at 850 m, with smaller peaks at 700 and 750 m. In contrast, the lower boundaries of species ranges were not significantly clustered on either the Sonadora or the Mameyes. Overall, there were fewer lower boundaries than upper boundaries, as many species continued further down the mountain than our lowest plots.
Number of species having upper or lower boundaries in plots along the Sonadora (a & b) and the Mameyes (c & d) transects. For both transects, upper boundaries were significantly clustered, while lower boundaries were not. Lines on the figures indicate the expected number of boundaries based on the number of species in the plot and the total number of boundaries.
Though the modes of species abundances fluctuated considerably across plots, they were not significantly clustered along either transect (Table 1). The patterns seen in the modes largely reflected differences in species number across the plots.
Species distributions were significantly nested for both transects, suggesting that the species composition of species-poor plots were subsets of species-rich plots (Table 1). In practice, species richness declined with elevation, meaning that the composition of high-elevation plots had some species from the species-rich lower-elevation plots. However, the relative nestedness index values for both transects were rather low (C = 0.20 for the Sonadora transect; C = 0.22 for the Mameyes) and may be attributed to the presence of a few widespread species being present in most of the plots.
Species turnover was also significant for both transects (Table 1). There was a tendency for the ranges of species to be offset from one another, at least when compared to a null model. Another interpretation of this result is that there was enough change in species composition in the plots that the sites with fewer species were not simply subsets of the more species-rich plots – that the sites were anti-nested (Table 1).
Species distributions along both transects were also significantly coherent (Table 1). This indicates that there were fewer embedded absences, or gaps in the species distributions, than expected from randomly generated models.
Other tropical montane transects
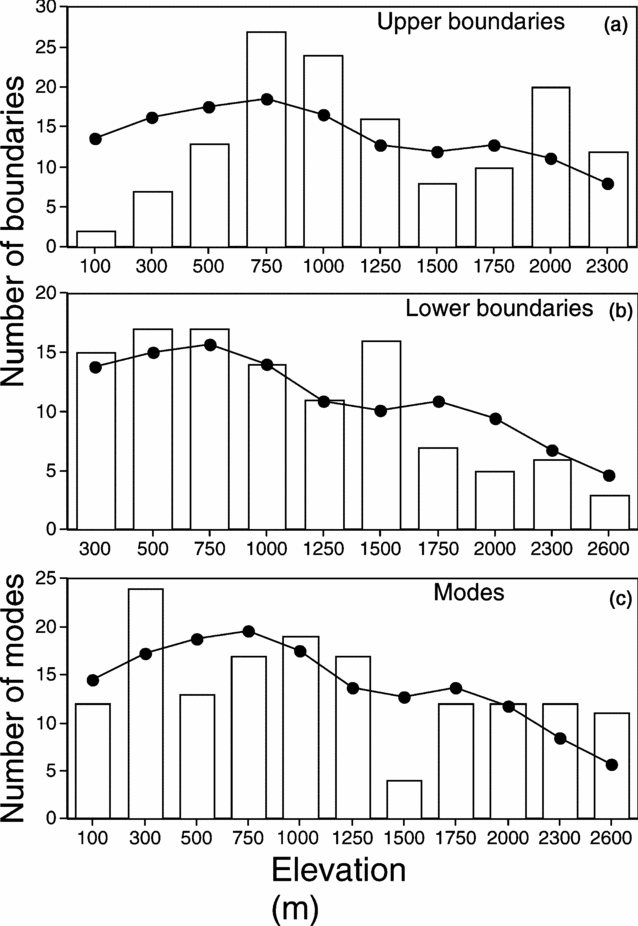
For the Volcan Barva transect (Lieberman et al. Reference LIEBERMAN, LIEBERMAN, PERALTA and HARTSHORN1996), the upper boundaries were significantly clustered, though the lower boundaries were not (Table 1, Figure 3). Clusters of upper boundaries occurred at 750 m and 1000 m and again at 2000 m. The 750-m cluster coincides with a shift in the sampling increment from 200 m to 250 m, though it seems unlikely that an additional 50 m in elevation would in itself result in a more than doubling of the number of upper boundaries. Modes of species abundances were also significantly clustered, with a peak at the 300-m plot and a distinct depression at the 1500-m plot.
Clustering of upper boundaries (a), lower boundaries (b) and modes of species abundance (c) for the elevation transect along Volcan Barva, Costa Rica. Data are from Lieberman et al. (Reference LIEBERMAN, LIEBERMAN, PERALTA and HARTSHORN1996). The upper boundaries and modes are significantly clustered, while the lower boundaries are not.
The relative nestedness index for this transect was negative (C = −0.15), indicating anti-nested distributions. This result is congruent with the measure of species turnover, which found that the actual number of replacements in species distributions was higher than expected, again indicating anti-nestedness (Table 1). Finally, the species distributions on the Volcan Barva transect were significantly coherent (Table 1).
Unlike the previous transects, plant species on the Chirripó transect (Kappelle et al. Reference KAPPELLE, VAN UFFELEN and CLEEF1995) had significantly clustered lower boundaries, but the upper boundaries were not clustered (Table 1, Figure 4). Modes were not significantly clustered. Species distributions were significantly nested, though as with the other transects the level of nestedness was low (C = 0.10). The measure of species turnover found that species replacements were significantly higher than expected by chance, again indicating anti-nestedness.
Clustering of upper boundaries (a), lower boundaries (b) and modes of species abundance (c) for the elevation transect in the Chirripó National Park, Costa Rica. The bars represent the actual numbers of species, and the lines represent the expected number. Data are from Kappelle et al. (Reference KAPPELLE, VAN UFFELEN and CLEEF1995).

Finally, the Sierra de Manantlán transect (Vázquez & Givnish Reference VÁZQUEZ and GIVNISH1998) showed significant clustering of both upper and lower boundaries of species distributions, though the clustering of the lower boundaries was more pronounced (Figure 5).
Clustering of upper (a) and lower (b) boundaries for an elevation transect in the Sierra de Manantlán, Jalisco, Mexico. The bars represent the actual numbers of species, and the lines represent the expected number. Data are from Vázquez & Givnish (Reference VÁZQUEZ and GIVNISH1998).

DISCUSSION
The analyses of five vegetation transects from four neotropical sites showed that tropical montane forests have considerable metacommunity structure, though there was some variation in this structure across sites. All five transects showed significant clustering of species boundaries, though the patterns differed. Three transects had clustering of upper boundaries but not lower, one transect exhibited the reverse pattern, and the final had clustering of both upper and lower boundaries. Such boundary clusters have been reported previously from a variety of temperate habitats. For example, Auerbach & Shmida (Reference AUERBACH and SHMIDA1993) compared the ranges of plant species on Mt. Hermon, Israel, with a null model and found that clustering was more common for upper boundaries than lower ones. Shipley & Keddy (Reference SHIPLEY and KEDDY1987), using an analysis of deviance, demonstrated that wetter and drier boundaries of species distributions were independently clustered along a marsh in Quebec, Canada. Hoagland & Collins (Reference HOAGLAND and COLLINS1997), in their analysis of wetland vegetation transects, reported significantly clustered species boundaries in about 25% of their 41 transects. Finally, using data from the literature, Leibold & Mikkelson (Reference LEIBOLD and MIKKELSON2002) analysed 29 transects and found that 11 had highly significant clumping of species boundaries, including half of the six transects along temperate zone altitudinal gradients.
The causes of upslope and downslope species boundaries are not necessarily the same (Auerbach & Shmida Reference AUERBACH and SHMIDA1993, Pielou & Routledge Reference PIELOU and ROUTLEDGE1976). Upper boundaries (or those at the more physiologically stressful end of the gradient) may be more likely to result from abiotic factors, while lower boundaries may result from competition (Auerbach & Shmida Reference AUERBACH and SHMIDA1993, Hamilton & Perrott Reference HAMILTON and PERROTT1981). If this suggestion proves correct, abiotic factors in general may be more likely to generate clusters of species boundaries as well, as a single factor or a group of correlated factors could simultaneously limit the distribution of many species. These abiotic factors could include one or repeated disturbances, which can have a significant effect in some montane forests (Arriaga Reference ARRIAGA2000, Martin et al. Reference MARTIN, SHERMAN and FAHEY2007). For example, Martin et al. (Reference MARTIN, SHERMAN and FAHEY2007) showed that fires and related abiotic factors could lead to an abrupt boundary between monodominant pine forest and diverse cloud forest on mountains in the Dominican Republic.
For vegetation along the Sonadora and Mameyes transects, fog levels could be influencing the upslope distribution of species. In the LEF, a persistent cloud base often reaches down to between 550–650 m (Baynton Reference BAYNTON1968). These elevations correspond roughly to a cluster of upper boundaries observed at 500 m on the Sonadora transect (though not on the Mameyes transect). Grubb (Reference GRUBB1971; see also Grubb & Whitmore Reference GRUBB and WHITMORE1966) hypothesized that fog can lead to transitions between forest types on tropical mountains, arguing that frequent fogs can result in higher soil water content and reductions in mineralization and nutrient supply. Studies by Silver et al. (Reference SILVER, LUGO and KELLER1999) and McGroddy & Silver (Reference MCGRODDY and SILVER2000) documented similar ecosystem effects of fog in the LEF. Thus, fog may indirectly limit the upward distribution of species adapted to more aerobic soil conditions found in lowland forests. Which factors, including fog, influence the clustering of species boundaries at the other sites, remains unclear.
All transects showed significant coherence. How common coherence is in metacommunities remains unclear, as the technique is still relatively new. Fontaneto et al. (Reference FONTANETO, MELONE and RICCI2005) found that moss-dwelling rotifer communities in Italy were significantly coherent in sites along a stream. Likewise, Kusch et al. (Reference KUSCH, GOEDERT and MEYER2005) observed consistent coherence in Lepidoptera communities across different forest patches in Luxembourg. Leibold & Mikkelson (Reference LEIBOLD and MIKKELSON2002) analysed 35 vegetation transects from the literature and determined that over half were significantly coherent, including seven of eight altitudinal gradients. These results, along with the current study, make it appear that elevation gradients are especially likely to show coherence.
The ecological processes generating coherence have not been fully examined, but Leibold & Mikkelson (Reference LEIBOLD and MIKKELSON2002) argue that coherence suggests that the structure of metacommunities may be dominated by a single axis of variation. The use of ordination before the analysis for coherence maximizes the importance of this axis of variation for each transect. Species that show incoherence after the ordination are responding to different underlying factors. For example, gap specialists in a mature forest dominated by shade-tolerant species would likely have incoherent distributions. A transect or metacommunity with high levels of incoherence could occur in a very heterogeneous landscape where different factors (such as substrate, climate and disturbance regime) are variable. In addition, species that are strongly dispersal-limited are less likely to make it to all suitable sites along the gradient, and so any metacommunity with many dispersal-limited species should show lower coherence. The high levels of coherence found in the transects in this study may indicate that most species are responding to the factors generating the primary axis of variation and that dispersal limitation was not an important factor determining metacommunity structure.
The use of reciprocal averaging as a means of ordination in the method of Leibold & Mikkelson (Reference LEIBOLD and MIKKELSON2002) may explain the apparent contradiction between the nestedness and species turnover results. The ordination rearranged the order of the plots according to their scores on the first ordination axis, so that those with the most similar species list are adjacent in the data matrix. When species turnover is calculated, this approach increases the number of turnovers. Leibold & Mikkelson (Reference LEIBOLD and MIKKELSON2002) favour ordination before the evaluation of the data because data on environmental variables may be lacking or the appropriate data may not have been collected. In effect, the species composition along each transect is used to reflect the underlying (if unknown) gradient.
The metacommunity techniques used in this study suggest that there was considerable structure along each of these transects, and that in all cases there were elevations where the forest community changed relatively rapidly. For the transects taken from the literature, this conclusion contradicts the authors’ own, suggesting that the techniques used for analysing transects can influence whether patterns are detected. For example, Lieberman et al. (Reference LIEBERMAN, LIEBERMAN, PERALTA and HARTSHORN1996) in the Volcan Barva transect used a detrended correspondence analysis and compared the axis 1 scores of 20 × 20-m subplots of each plot with altitude. The axis 1 scores increase smoothly with elevation, suggesting no distinctive ecotones along the transect. In contrast, the community changes noted in this study, such as the clustering of upslope boundaries at particular elevations, show that sometimes the change in species composition can be substantial, despite this apparent absence of ecotones. The 2000-m plot in the Volcan Barva transect had 55 species (Lieberman et al. Reference LIEBERMAN, LIEBERMAN, PERALTA and HARTSHORN1996). Twenty of these were at their upper limit along the transect, meaning that over a third of the species appear to drop out before the next plot, at 2300 m. In contrast, the 1500-m plot had 74 species (Lieberman et al. Reference LIEBERMAN, LIEBERMAN, PERALTA and HARTSHORN1996) and only eight, or about 11%, were at their upper limit. Whether the first of these changes would constitute an ecotone is unclear. However, this and the other transects examined clearly show distinctive shifts in species composition with elevation.
The ultimate utility of the techniques used here remains to be seen, since some of the types of analyses are relatively new. They do, however, provide another way to look for patterns of species composition along transects, and they allow for the ready comparison across transects and sites. The search for common patterns should help to understand more fully the mechanisms operating on tropical montane forests.
This study shows that tropical montane forests exhibit considerable metacommunity structure. Some structural features, such as coherence, were present in all the forests examined, whereas others, such as the clumping of upper and lower species boundaries, differed across the forests. The presence of metacommunity structure in all the sites suggests that one or more factors may strongly influence woody plant distributions across tropical mountains, but what these factors are and how they act remains to be determined.
ACKNOWLEDGEMENTS
We are grateful to the United States Department of Agriculture – Forest Service for permission to work in the Luquillo Experimental Forest. N. Brokaw generously helped with many aspects of the study. M. Nicholie and H. Prendeville provided expert field assistance. J. Sharpe identified the tree ferns. A. Ramírez and J. Thompson kindly provided logistical support. M. Leibold supplied software for the analysis of species turnover and coherence. This research was performed under grant DEB-0080538 from the US National Science Foundation to the Institute for Tropical Ecosystem Studies, University of Puerto Rico, and to the International Institute of Tropical Forestry, US Forest Service (U.S. Dept. of Agriculture), as part of the Long-Term Ecological Research Program in the Luquillo Experimental Forest. The Forest Service and the University of Puerto Rico provided additional support.



