The scramble for Africa stands out as a remarkable feat of European imperialism and its motives and timing have been long debated (Pakenham Reference Pakenham1992, p. xxi–xxii). In less than two decades (1884–1898), the lion's share of the vast African continent was partitioned among a handful of European powers. To be sure, the string of coastal settlements that had been established in support of the trade in slaves, gold, ivory, and other tropical products, testified to European encroachment for centuries. The Cape settlement had functioned as a provisioning station for the trade with Asia already since 1652. The conquest of Algiers in 1830 already demonstrated a French ambition to create an imperial “backyard” across the Mediterranean. French and British interference in Egyptian affairs in the early 1880s also had a clear objective: they guaranteed European control over the Suez and secured the interests of European investors in Egyptian bonds.Footnote 1 But the lures of power and profit were far less obvious in the vast sub-Saharan African interior, and the costs of permanent colonization were high.Footnote 2
This article scrutinizes the economic motivations for the scramble of West Africa by zooming in on trade developments in sub-Saharan Africa in the long nineteenth century, and by assessing these trade developments in a global comparative perspective. Our overarching argument is that trade developments from the mid-1830s to mid-1880s did more to strengthen the economic rationale for the scramble than most of the historical literature has hitherto assumed. This argument has two aspects.
The first aspect relates to the idea that African markets were too insignificant to lure major European powers into a large-scale military conquest anyway. This view has become mainstream through the influential work of Ronald Robinson and John Gallagher (Reference Robinson and Gallagher1961), who argued that internal African political changes pulled Britain into the scramble to safeguard its geo-political interests, and which were focused on securing access to Asia, not to protect or enhance trade with Africa. This view has been extensively debated among historians in the wider context of finding a plausible hierarchy of explanations for the scramble (Hargreaves Reference Hargreaves1960; Pakenham Reference Pakenham1992; Chamberlain Reference Chamberlain2009) as well as British colonial expansion in general (Platt Reference Platt1973; Fieldhouse Reference Fieldhouse1973; Hyam Reference Hyam1976; Cain and Hopkins Reference Cain and Hopkins1980).Footnote 3
We show that British-African trade comprised a tiny share of total British imperial trade, but that the share of West African exports in total French imperial trade was significant and growing. Afro-European trade patterns in the nineteenth century were thus consistent with the French initiative in 1879 to survey the possibilities of connecting the Middle Niger delta to their commercial entrepôts on the Senegalese coast. We will not claim that nineteenth century trade developments explain the scramble for West Africa for national political prestige, intra-European tensions, religious zeal and, indeed, internal African politics all played their part. What we argue is that during the nineteenth century the costs of colonial conquest were declining as a result of innovations in transportation, communication, military, and medical technology, while the revenues of legitimate commerce were rising, thus narrowing the gap between costs and benefits of colonization. The nineteenth century commodity export boom was crucial in shaping an economic context in which the partition of Africa became politically defensible. When analyzed in a global comparative perspective, the West African terms of trade boom was exceptionally steep in the five decades before the Berlin Conference (1884–1885).
The second aspect relates to the timing of the scramble. Instead of occurring in a period of declining export markets for African commodities, as Anthony Hopkins (Reference Hopkins1973, pp. 124–35) as well as David Eltis and Lawrence Jennings (Reference Eltis and Jennings1988, p. 942) have argued, we show that the relative prices of most West African tropical export commodities continued to rise up to the mid-1880s. Increasing relative prices between 1853 and 1885 accounted for one-third of the export value growth to Britain, and even 55 percent of the export value growth to France. Hopkins' argument that the scramble was provoked by internal African conflicts emerging from a notable drop in the terms of trade after the 1860s, has been mainly informed by an analysis of British-African trade in palm oil (p. 133).Footnote 4 We show that for the key commodities in French-African trade, in other words gum and groundnuts, there was no such decline. French plans to construct a railway into the West African interior were already circulating since the 1850s, and the eventual initiative to effectuate these plans was aided by a growing weight of Senegambia in French imperial trade.
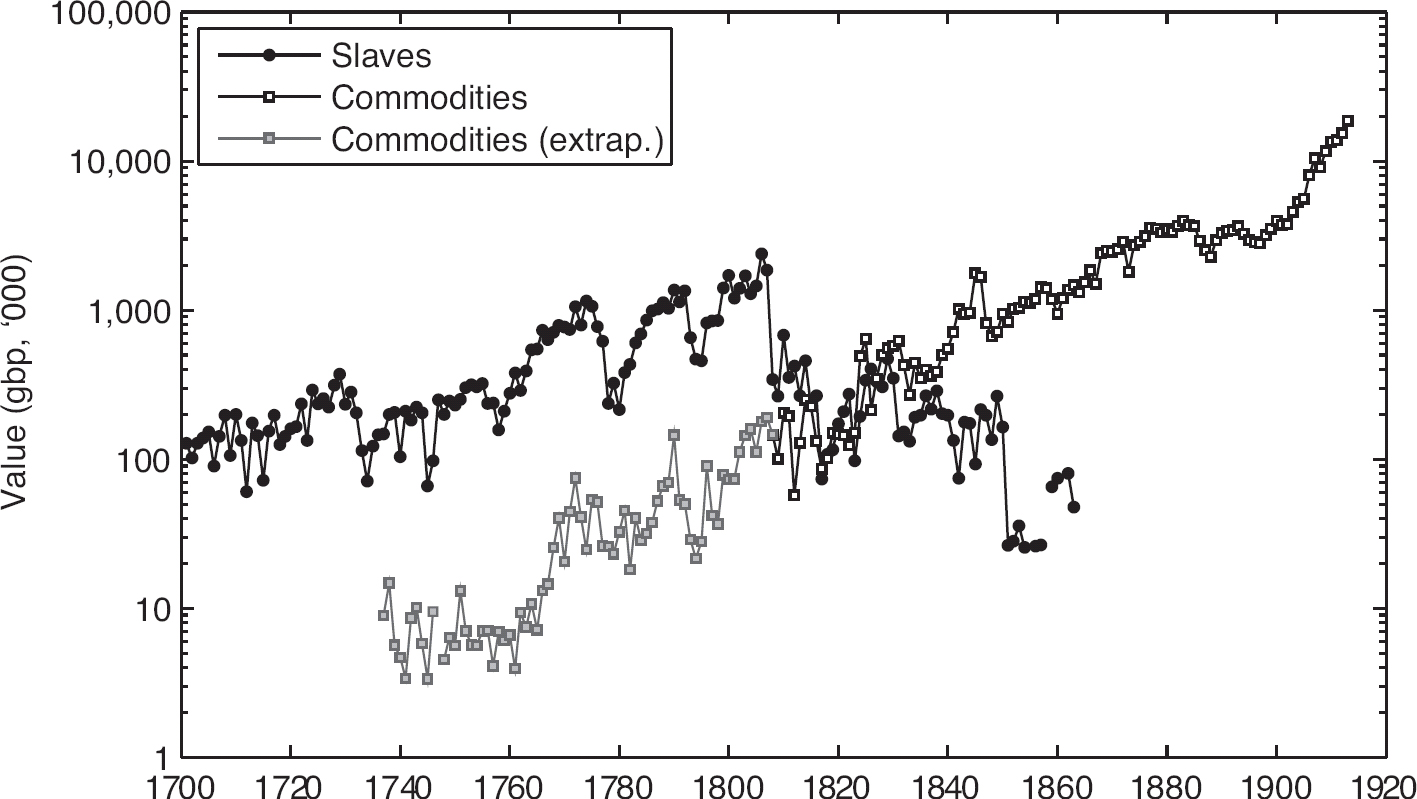
This prolonged export boom must be considered in the wider context of what is now commonly referred to as the “commercial transition” from slave exports to commodity exports (Law Reference Law1995). Figure 1 illustrates this transition for West Africa. It shows that annual nominal revenues from slave exports into the Atlantic economy—excluding slaves traded within Africa—rose to a maximum in the era 1760–1808, when the share of commodity trade was below 10 percent of total West African exports. However, commodity exports overtook slave exports in the 1830s, and around 1850 these reached a temporary peak comparable to the one in slave exports half a century earlier. By the 1880s the nominal value of commodity exports was clearly higher, and would never revert to eighteenth century revenue levels again.
VALUE OF SLAVES AND COMMODITIES FROM WEST AFRICA, 1700–1913

There is a clear temporal sequence in the “commercial transitions” across sub-Saharan Africa: it first occurred in West Africa, then in West-Central Africa, and finally in East Africa. The gradual abolition of the African slave trades and the transition to commodity exports halted the continuous drain on already-scarce labor and spurred land-extensive tropical agriculture engaging smallholder family farms, communal farms, and large estates.Footnote 5 Although these major shifts in African trade are all connected in a globalizing world economy, a comprehensive and comparative survey of Africa's external commodity trade over the long nineteenth century does not exist yet. Inconsistent and incomplete primary sources have long hampered the construction of century-long time series on commodity trade.
Figure 1 is constructed from a new dataset of African commodity trade which we introduce in this article. This dataset contains export and import prices, trade volumes, export composition, and net barter terms of trade (NBTT hereafter) from the British slave trade abolition (1807–1808) to the eve of WWII (1939). Our dataset is a major improvement over existing datasets in terms of its temporal and spatial coverage, the number of commodities included, and the disaggregated level of annual unit export price observations at the African coast. Our dataset focusses on the sea-bound trade of Africa, and primarily, though not exclusively, its trade with Europe. The biggest limitation of our dataset is that it excludes intra-African overland trade.
The onset of colonial rule deepened and diversified African specialization in tropical commodity exports. Colonial states took control over sea-bound trade by imposing tariffs and forced cultivation schemes of export crops, while levying trade and direct taxes to finance the project of colonial state formation (Frankema Reference Frankema2011; Gardner Reference Gardner2012). During the Great Depression and especially WWII, colonial governments started to regulate African commodity trade through price controls and export monopolies maintained by marketing boards (Bauer Reference Bauer1956; Meredith Reference Meredith1986). Colonial rule also facilitated the construction of railways and related inflows of foreign capital, and led to profound changes in the governance of land and labor markets. Colonial regimes set out to abolish slavery, but replaced it by alternative forms of labor coercion on a significant scale (van Waijenburg Reference van Waijenburg2018). The effects of opening up the African interior were hard to miss: between 1897 and 1913 the total value of sub-Saharan African commodity exports rose by more than 150 percent, from about £71 million to about £184 million (Forbes-Munro Reference Forbes-Munro1976, p. 86). European colonization and African responses to new commercial opportunities thus accelerated the trend of nineteenth-century commodity export growth and, at the same time, reduced Africa's opportunities to escape the trap of primary commodity specialization during the prolonged terms of trade decline from 1885 to 1939.
THE COMMERCIAL TRANSITION
The nineteenth century expansion of world trade was driven by three fundamental forces: a transport revolution, a liberal trade policy move in industrial Europe, and an acceleration in world GDP growth associated with the industrial revolution.Footnote 6 New transportation and communication technologies such as railroads, steamships, the telegraph, and the invention of the refrigerator, helped integrate world commodity markets, lowered price gaps between exporters and importers, and fostered trade between the industrial “core” and the commodity-exporting “periphery.” Falling trade costs from all sources accounted for more than half of the trade boom between 1870 and 1914, and probably accounted for even more than that before 1870 when transport costs declined even more rapidly (Jacks, O'Rouke, and Williamson Reference Williamson2011, p. 529).Footnote 7
The move by the European industrial core towards a more liberal commercial policy, a commitment to the gold standard, and probably imperialism itself all made additional contributions to the nineteenth-century world trade boom (Estevadeordal, Frantz, and Taylor Reference Estevadeordal, Frantz and Taylor2003; Meissner Reference Meissner2005; Ferguson Reference Ferguson2004; Mitchener and Weidenmier Reference Mitchener and Weidenmier2008). Rapid manufacturing productivity growth in the industrial core lowered supply costs and output prices, adding to the demand for inexpensive factory-made manufactures, and by doing so generated a soaring derived demand for raw materials, and industrial intermediates, like fuels, fibers, dyes, rubber, oils, fine woods, and metals. In the industrializing core, manufacturing growth outpaced GDP growth, and was reinforced by a high-income elasticity of demand for consumption goods such as meat, dairy products, dried fruit, sugar, tobacco, tea, cocoa, and coffee. All of these forces produced a powerful, century-long terms of trade boom in the “peripheral” commodity exporters, as the prices of their imported manufactures fell and those of their commodity exports rose.Footnote 8 Yet, even though trade made it possible for the periphery to share some of the fruits of the industrial revolution taking place in the core, globalization also fostered de-industrialization in the periphery so that income per capita growth rates diverged.Footnote 9
The transport and communication revolutions not only lowered trade costs, they also reduced the costs of military conquest and colonial control. New innovations in weapon technology (e.g., gun boat, maxim gun) enhanced European military superiority and major advances in medical knowledge (quinine) reduced the high mortality and morbidity rates of overseas expeditions, and made treatment of tropical diseases much more effective. Of course, this drop in the costs of conquest made the scramble for Africa feasible, but not necessarily desirable (Curtin Reference Curtin1989).
Most of sub-Saharan Africa became part of the nineteenth-century world trade boom by shifting from slave exports to the export of ivory, groundnuts, copra, palm oil, palm kernels, beeswax, gum, dyewoods, sugar, rubber, cotton, minerals, and precious stones. The British considered the promotion of “legitimate trade” as a cornerstone of their “civilization mission” and the related suppression of internal and external African slave trades.Footnote 10 Hopkins (Reference Hopkins1973) has argued that the abolition of the external slave trade provoked a “crisis of adaptation” because some slave trading areas had more suitable environmental conditions to shift towards tropical commodity exports than others.Footnote 11 Moreover, the production of agricultural cash-crops for export markets involved a different business model than the production of slaves. Whereas slave raiding demanded a military hierarchy to secure violence monopolies and distribute slave trade revenues, the production of agricultural commodities could be conducted as efficiently by large numbers of small farmers, as by large-scale producers employing slave labor, the former favoring a model of atomistic competition over state monopoly. According to Hopkins (Reference Hopkins1973, p. 124) the implications of the commercial transition for the re-organization of markets marked the start of the “modern economic history” of West Africa, that is, the economic structures that emerged during the commercial transition were to exist up until the close of the colonial era (Reference Hopkins1973, p. 294).
Later studies have emphasized that the commercial transition was more evolutionary than revolutionary, since adaptation in most cases did not produce a crisis.Footnote 12 David Northrup (Reference Northrup1976) has argued that palm oil exports in the Bight of Biafra rose together with slave exports in the early nineteenth century before replacing the latter.Footnote 13 The joint expansion was facilitated by the market networks (port facilities, merchant relations, credit instruments) that had evolved under the slave trade.Footnote 14 Martin Lynn (Reference Lynn and Law1995, p. 59) has extended this argument noting that market entry in the palm oil trade remained controlled by existing rulers and merchant groups. Paul Lovejoy (Reference Lovejoy2005, pp. 162–76) has argued that the abolition induced a reallocation of slaves for Atlantic markets towards local and trans-Saharan markets and showed how plantation agriculture (e.g., cotton, indigo, grains) used large amounts of slave labor in the Sokoto Caliphate (part of present-day Northern Nigeria). Gareth Austin (Reference Austin and Law1995, pp. 95–100; 2005, pp. 46–47), discussing the Asante monopolies on kola nut and gold production, has argued that the emergence of new African and Atlantic markets for respectively kola nuts exported to Hausaland (Northern Nigeria) and gold smoothed the transition in the Gold Coast area (Ghana). Susan Martin (Reference Martin2006, pp. 189–90) and Robin Law (Reference Austin and Law1995, p. 196) have pointed out that part of the evolutionary changes also occurred in the domain of household and gender relations.
The commercial transition in East Africa occurred later. Despite British treaties to curb the slave trade with the Sultan of Zanzibar in the 1820s and 1830s, slave exports into the wider Indian Ocean area expanded up to the last quarter of the nineteenth century, when British military and diplomatic pressure eventually enforced a formal prohibition of the slave trade by sea in 1873 (Sheriff Reference Sheriff1988, p. 133). As a result, the hinterland of Mozambique was entrenched in the Atlantic slave trade up to the 1850s, but it also supplied slaves to Madagascar, the Comoros, the Mascarenes, and further destinations in the Indian Ocean (Campbell Reference Campbell2004, Reference Campbell2008). Compared to the estimates of the Atlantic slave trade, the figures for the export of slaves into the Persian Gulf and South Asia remain mere guesstimates, but there appears to be a consensus that this trade reached its peak between 1850 and 1873, and that about half of the guesstimated 1.6 million slaves being taken out of East and Central Africa during the nineteenth century were retained on the East African coast (Austen Reference Austen1988, p. 41; Lovejoy Reference Lovejoy2011, p. 156).
The Eastbound slave trades were complemented by the export of ivory from the interior, as well as cloves produced with slave labor at the coast. Oil seeds (e.g., sesame) and copal were also exported, albeit in very small quantities (Clarence-Smith Reference Clarence-Smith1989; Sheriff Reference Sheriff1987; Cooper Reference Cooper1974). Yet, the size of the commodity trade remained much lower in East than in West Africa throughout the nineteenth century. In the 1890s, imports from British East Africa were valued at a little over three million pounds, whereas imports from British West Africa totaled nearly 25 million pounds.Footnote 15 These figures reflect the fact that the “cash-crop revolution” in East Africa, which included tobacco, cotton, sesame, flax, coffee, and tea, did not really start until after 1900, when railways removed the transportation bottlenecks for perishable bulk commodities (Tosh Reference Tosh1980; Jedwab and Moradi Reference Jedwab and Moradi2016). Given the much stronger orientation of European trade on the African Atlantic, it is not surprising that European colonization of the deeper African interior started in West Africa, which was wealthier and more densely populated (Frankema and van Waijenburg Reference Frankema and Waijenburg2012).
A NEW DATABASE OF AFRICAN TRADE
In the 1970s and 1980s, a series of pioneering studies documented the transition from slave to commodity exports (Forbes-Munro Reference Forbes-Munro1976; Hanson Reference Hanson1980; Liesegang, Pasch, and Jones Reference Liesegang, Pasch and Jones1986; Eltis and Jennings Reference Eltis and Jennings1988; Law Reference Law and Falola1993). However, these studies focused on parts of the nineteenth century or on trade in a few commodities, with none based on a comprehensive dataset of African trade for the entire nineteenth century. More recent work on African terms of trade has either focused on a single commodity, or considered post-1870 trade developments, including terms-of-trade analyses but for different analytical purposes (Deaton Reference Deaton1999; Allen Reference Allen2011; Prados de la Escosura Reference Prados de la Escosura2012).Footnote 16 Within the limitations of the available historical sources, our dataset has a larger spatial and temporal coverage and includes more product detail. We gathered our data from primary trade accounts and merged these with several existing series to produce annual time-series of export volumes, export values, commodity export prices, import prices, and NBTT series. Our data cover more than 50 products including foodstuffs, cash-crops, forest products, metal ores, and minerals. The series were built up from spatially disaggregated sources and were weighted up to aggregate trade and price series. This allows us to analyze aggregate African trade developments in a global perspective and it also allows us to explore trends at the regional or product level.Footnote 17
For 1808–1829 most of our observations are drawn from British trade with West and South Africa listed in the handwritten British Customs Records. We drew French trade with West Africa from the French import statistics. For the African islands, our pre-1830 series focus on sugar, which covered more than 80 percent of the islands' export value, and for the East African coast our data up to 1890 are based on ivory exports derived from the work of Abdul Sheriff (Reference Sheriff, Liesegang, Pasch and Jones1986). For the post-1830 era our dataset covers exports and imports of nineteen areas in sub-Saharan Africa for which we obtained price information at the African coast. Post-1830 British data is drawn from the Colonial Blue Books, the Statistical Abstract for the Several Colonial and Other Possession of the United Kingdom and the Statistical Abstract for the United Kingdom. Post-1830 French data comes primarily from the Tableau General du Commerce de la France avec ses Colonies et les Puissances etrangeres. We identify these regions with the names given to the “colonies” that emerged during the late nineteenth century.
In West Africa, we distinguish the Gold Coast (present-day Ghana), Gambia, Nigeria, Sierra Leone, the French West African Coast (covering Mauritania, Guinea, Ivory Coast, Togo, and Benin), and Senegal. In East Africa, we distinguish Northern Rhodesia (Zambia), Nyasaland (Malawi), Kenya and the Uganda Protectorate, Somaliland (Somalia), Tanganyika (Tanzania), and Zanzibar. The African islands include Madagascar, Mauritius, and Reunion. For South Africa, we have trade data for the Cape Colony, Natal (merged into the Union of South Africa in 1910), and Southern Rhodesia (Zimbabwe). For North Africa, we included data from Egypt drawn from the work of Laura Panza and Jeffrey Williamson (Reference Panza and Williamson2015). We also gathered data for Portuguese Africa and the Congo Free State (later Belgian Congo), but we focus here on the areas that came under British and French control, which constituted more than 90 percent of total continental commodity trade throughout the nineteenth century.
We constructed export price indices using annual prices quoted at African ports for 1830–1939 and extrapolated these indices backwards to 1808 using American wholesale prices, converted into British pounds using official exchange rates (Bezanson, Gray, and Hussey Reference Bezanson, Gray and Hussey1937; Officer Reference Officer2015).Footnote 18 Where several commodity prices were available from different areas, we weighted each by its volume share in total African exports. French prices were converted to British pounds using quoted exchange rates (Mitchell Reference Mitchell1988, pp. 700–703). Where African price data were missing for the 1830–1939 period, we interpolated the commodity price indices based on the British wholesale prices trends (Sauerbeck Reference Sauerbeck1886–1951).
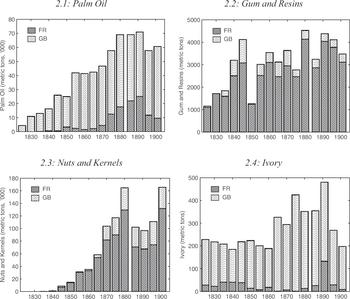
Figure 2 presents the growth in exports of the four most important commodities in nineteenth century sub-Saharan Africa from 1850 to 1910, excluding South Africa. Palm oil was the key commodity in the first half of the nineteenth century. Palm oil was used as a machine lubricant (including the railways), as an ingredient in soap production, and as an edible oil in food processing industries. After 1850 gum and especially groundnuts became more important and were the two principal export items from the Senegambia area (present-day Senegal and the Gambia). Groundnuts were particularly valued as a source of protein-rich vegetable oil, finding its way mainly into European food industries. Gum was used for all sorts of industrial purposes, but was especially valued for its adhesive qualities and demanded by textile, food, and chemical industries. After 1880, a number of other export commodities gained ground such as rubber, cocoa, and cotton.
KEY COMMODITY EXPORTS FROM WEST AND EAST AFRICA, 1825–1900

Sub-Saharan Africa was a small player in world trade, even though its share of world trade increased in the century between 1850 and 1950. This does not imply, however, that all African export commodities were insignificant. In the decades before the scramble, West Africa was the world's leading supplier of palm-oil, palm kernels, gum, and groundnuts. The Gold Coast became the market leader in cocoa beans in 1911 and maintained this status to the late 1970s (Austin Reference Austin2005, p. 2). East African ivory dominated world markets in the nineteenth century and Central African exports of wild rubber were significant before Southeast Asian plantations took over in the 1910s (Clarence-Smith Reference Clarence-Smith, Frankema and Buelens2013, p. 193). Especially palm-oil, gum, and groundnuts from West Africa and rubber from the Congo basin were highly valued industrial inputs. European merchants who had invested in these trades were eager to control and expand the trade.Footnote 19 From the 1840s to the 1880s, the composition of British and French imports also shifted. British merchant companies concentrated increasingly on the palm-oil trade with the Gold Coast and Southern Nigeria, while French companies invested increasingly in the gum and groundnut trades in the Senegambia area from about 1850 onwards.
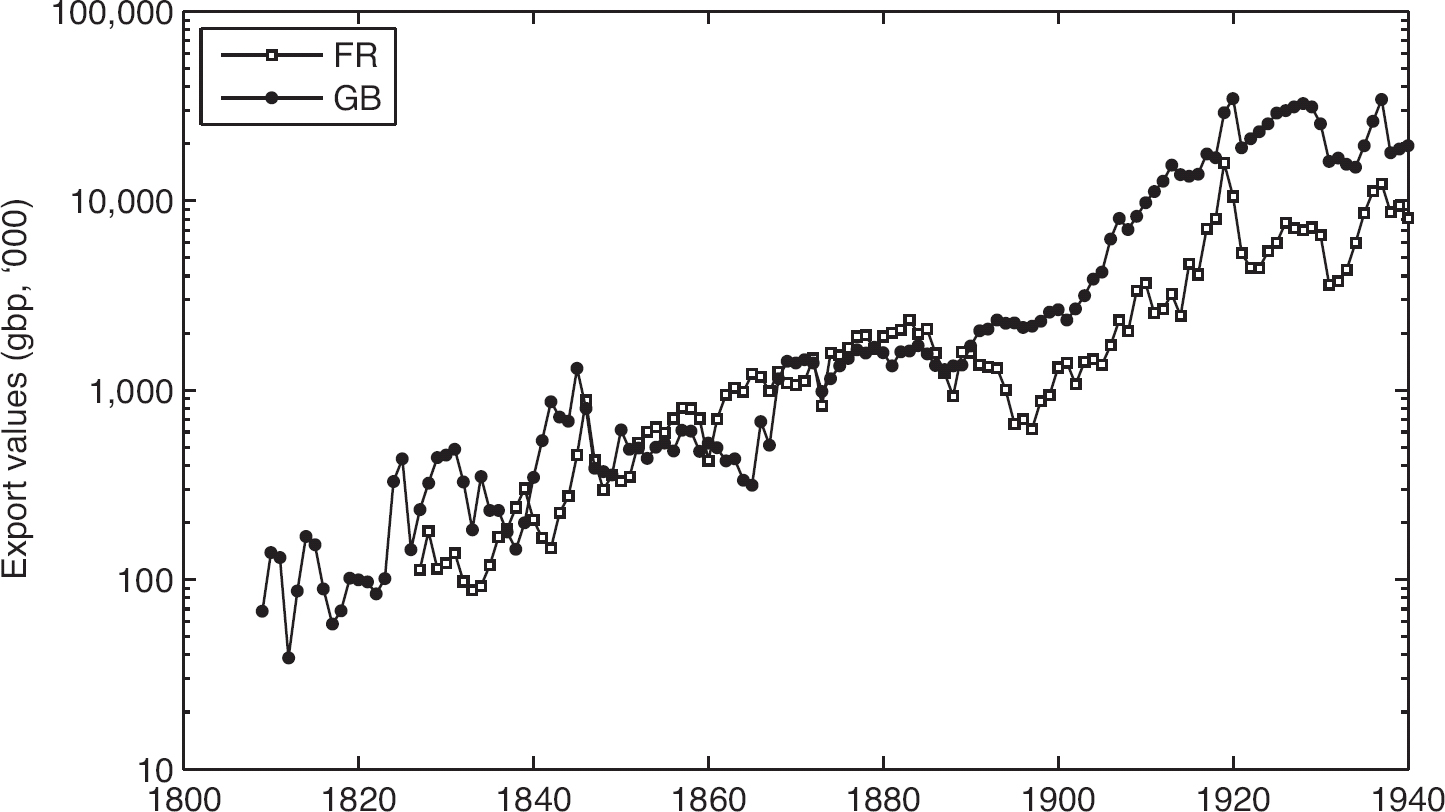
Figure 3 presents the trend in total French and British imports from West Africa. While both increased, their timing and magnitude differed. In the 1830s and 1840s the average annual value of British imports from West Africa was distinctively larger. However, around 1850 the total value of French imports from West Africa overtook the total value of British imports. Between 1850 and 1880 the growth was more or less comparable, but these figures hide the important fact that around 1880 the per capita exports from Senegal were much higher than from Nigeria, even exceeding a ratio of 10:1, since the former area was far less densely populated than the latter.Footnote 20 Finally, Figure 3 shows that during the scramble exports from French West Africa fell much more than did exports from British West Africa. This drop was mainly caused by declining volumes, rather than by declining prices. It shows that the military campaigns of the French had a much more disruptive effect on trade, which is consistent with the generally accepted view that the French had to fight longer and harder to “pacify” Africans (Boahen and M'Baye Gueye Reference Boahen, Gueye and Adu Boahen1985).
TOTAL EXPORTS FROM BRITISH AND FRENCH WEST AFRICA, 1808–1939

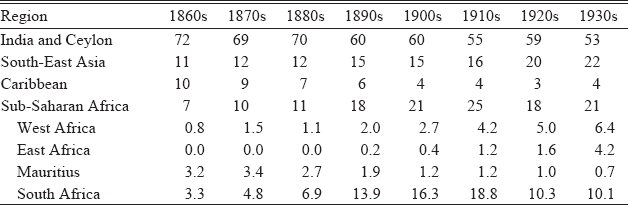
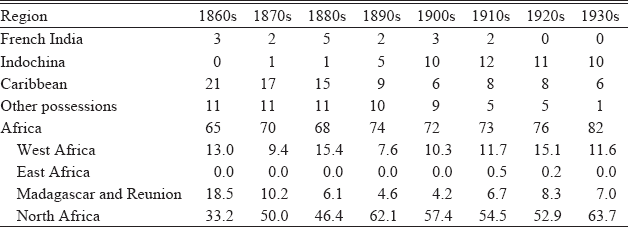
In Tables 1A and 1B we present the share of African colonies in total exports to Britain and France along with trade from other colonies from 1860–1939. While continuing to be dominated by India, Ceylon, and Southeast Asia, the African share of exports to Britain grew from seven to 25 percent over the period. Table 1A shows that African commodity trade to Britain was dominated by South Africa and Mauritius up to the 1880s, but that the West and East African shares increased from 1890 and 1910, respectively. In Table 1B we show that African exports to France dominated imperial trade in a similar way as Indian exports dominated British imperial trade. Africa was central to French colonial imports. North Africa, and Algeria in particular, made up the bulk of this trade ranging between 33 and 64 percent. Still, the share of West African exports to France was substantial as well, hovering around 10 to 15 percent in the decades before the scramble. Following the decline of the French Caribbean trade during the late nineteenth century, the share of West African exports to France was only matched by exports from Indochina. We excluded exports from the British dominions such as Australia and Canada, but if these were added, the difference in the relative weight of African exports in British and French imperial trade would appear even larger. Indeed, French trade on the Senegambia had a very different standing in the context of empire than British trade on the Gold Coast or the Niger delta.
SHARE OF EXPORTS OF BRITISH COLONIAL POSSESSIONS, 1860–1939 (PERCENT)

Note: May not sum to total due to rounding.
Source: Statistical Abstracts (various issues).
SHARE OF EXPORTS OF FRENCH COLONIAL POSSESSIONS, 1860–1939 (PERCENT)

Notes: “Other possessions” include St-Pierre-et-Miquelon, New Caledonia, and other French possessions in Oceania. “Madagascar and Reunion” also include Mayotte, Nossi-Be, and Ste-Marie-de-Madagascar. “Caribbean” also includes French Guiana. May not sum to total due to rounding.
Sources: Tableau General du Commerce (1860–1867); Annuaire Statistique de la France (1878–1939).
THE COMMODITY PRICE BOOM OF 1835–1885
We now bring the “commercial transition” in sharper focus by exploring the timing as well as the comparative magnitude of sub-Saharan Africa's nineteenth century commodity price boom. We calculate the NBTT as the ratio of the weighted average of all major commodity export prices to commodity import prices, and use this information to calculate annual average growth rates of the purchasing power of African exports.
To obtain an aggregate export price index for each area/colony, the country's commodity prices were weighted using its export mix. These export weights were changed at approximately 20-year intervals to capture long-run shifts in export composition.Footnote 21 The commodity specific quantity information for 1830–1939 is based on the same sources as the export price data described earlier. Country-specific export price indices were aggregated to obtain regional series, matching the five regions described in the previous section. The aggregate indices were constructed using area/colony nominal export shares. These weights were also changed at 20-year intervals to capture the shift in each area's contribution to the value of total African exports. Regional specific terms of trade were derived by dividing the export price indices by a common import price index (Mitchell Reference Mitchell1988, pp. 526–28), to capture change in the prices for the primary British manufactures shipped abroad. The use of a common African import price index implies that we do not take differences in the import mix of individual African colonies into account. We conducted a sensitivity analyses based on the quantity and prices of imported goods from the United Kingdom into Africa (observed at the African coast) to check for possible biases caused by compositional effects. In addition, we compared a price index of British commodities to an index of French commodities being traded with the rest of the world. The results are shown in the Online Appendix and indicate that the British index by Brian Mitchell (Reference Mitchell1988) appears to be a good proxy for the price development of imported goods into Africa.
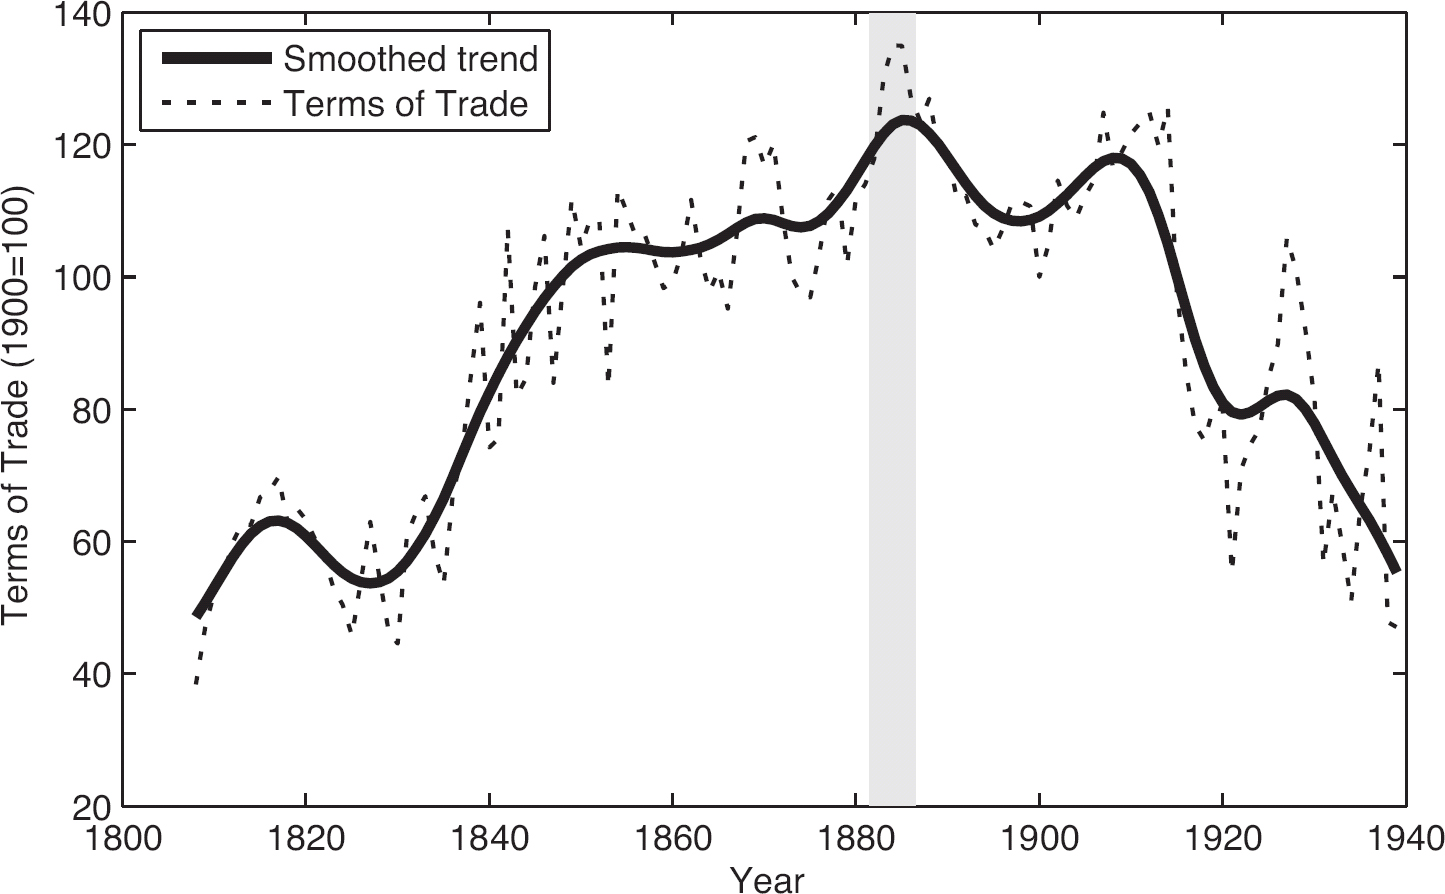
Figure 4 shows the evolution of the NBTT index for British and French West Africa combined. The NBTT rose modestly up to the mid-1830s, but increased rapidly from then to the mid-1880s. The secular commodity price and terms of trade boom is consistent with other tropical commodity exporting countries in Latin America and Southeast Asia: from 1835 to 1885 their terms of trade doubled, or increased at an annual rate of 1.9 percent, which was larger than per capita income growth in the poor periphery, and even greater than per capita income growth in the United Kingdom (1.2 percent per annum, 1820–1870), as estimated by Angus Maddison (Reference Maddison1995, p. 23). However, as also shown in Figure 4, the fall from the peak in the mid-1880s to 1939 eroded all the gains which producers and traders in West Africa had experienced from the early 1800s onwards. This terms-of-trade decline has received far more attention than the huge boom that preceded it (Prebisch Reference Prebisch1950; Singer Reference Singer1950; Lewis Reference Lewis1978).
NET BARTER TERMS OF TRADE WEST AFRICA, 1808–1939 (1900=100)

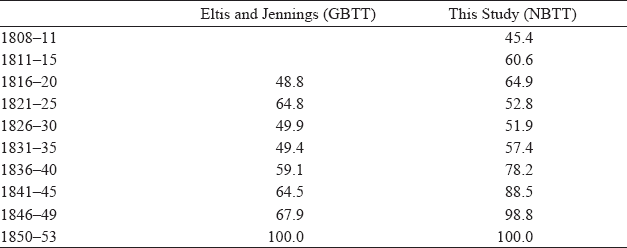
These new NBTT estimates for English colonial trade differ distinctively from the gross barter terms of trade (GBTT) series offered by Eltis and Jennings (Reference Eltis and Jennings1988, p. 943), as shown in Table 2.Footnote 22 Although both indices confirm that the African terms of trade improved over the course of the early nineteenth century, the rate of growth in the two series show different patterns. We observe a take-off in the 1830s peaking in the mid-1880s (as shown in Figure 4). The Eltis and Jennings series suggested that the African terms of trade more than doubled, translating into an annual rate of growth of 2.1 percent between the second half of the 1810s and the early 1850s. Our estimates indicate the terms of trade to have grown by a little under 1.3 percent per annum between 1816 and 1853, nearly 40 percent less than their estimate.
AFRICAN TERMS OF TRADE COMPARED, 1791–1853 (1850–1853=100)

Note: Gross and Net Barter Terms of Trade for West-Africa with England.
Sources: Eltis and Jennings (Reference Eltis and Jennings1988, p. 943); see text.
Although Eltis and Jennings (Reference Eltis and Jennings1988, p. 942) were unable to link their early nineteenth century estimates to the post-1853 period, they contended that the terms of trade rise “probably continued until the last third of the nineteenth century, when a sharp reversal occurred.” Here they echo Hopkins' (Reference Hopkins1973, p. 133) claim, based on his analysis of nominal palm-oil prices, that “the barter terms of trade moved decisively against primary producers” in the third quarter of the nineteenth century. Our estimates show that the aggregate terms of trade peaked later, in the middle of the fourth quarter of the nineteenth century, because the terms of trade of other West African export commodities such as gum and groundnuts continued to rise up to the mid-1880s.
There are three reasons why the NBTT series are to be preferred over GBTT series to capture long-term changes in relative prices (Obstfeld and Rogoff Reference Obstfeld and Rogoff1996). First, the GBTT series measure relative changes in the volume of exports over the volume of imports. This is a good measure of purchasing power only if the current and capital accounts are balanced, as a trade deficit funded by international loans or unrequited transfers would cause the GBTT to be more favorable than the NBTT. However, these assumptions were clearly violated in nineteenth-century Africa when volatile trade gaps were cleared by sizable flows of gold and capital.Footnote 23 The NBTT measure does not assume that the trade balance is zero. Second, for aggregated trends the GBTT requires a set of prices for a given base year to convert the nominal value of all goods and services traded into real values. Eltis and Jennings relied on the official values reported in the British customs ledgers, which were based on late seventeenth-century prices. These official values are not representative for the trade flows observed in the nineteenth century, which contained several new export products that had seen sizable increases in their traded volume accompanied by falling prices.
Third, aggregating together quantities of all goods imported and exported does not allow one to detect the impact of a change in volume of a single commodity on the terms of trade. NBTT estimates allow us to focus strictly on commodities, to single out the effect of individual goods on the overall terms-of-trade trend, and to reweight the index at 20-year intervals to more adequately reflect the changing export mix over time. Finally, since Eltis and Jennings did not extend their GBTT index into the post-1850 era, they missed a vital part of the commercial transition in West Africa and, indeed, the full extent of the African terms of trade boom of 1835–1885.
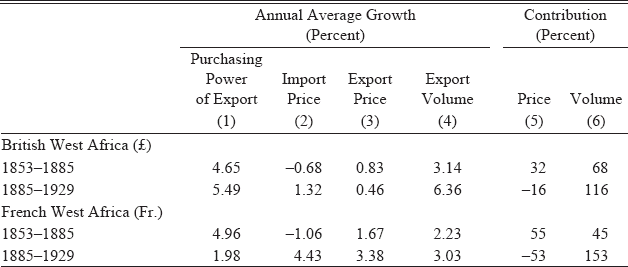
The use of the NBTT measure allows us to disentangle the effects of changes in import prices and in export prices as well as the growth in the volume of exports on the purchasing power of African exports. Table 3 illustrates this for West Africa. In the period up to 1885, during the height of the terms-of-trade boom, export price growth enhanced the purchasing power of exports. Between 1853 and 1885, export volumes rose at an annual rate of 2.23 and 3.14 percent for the French and British possessions, respectively, while the purchasing power of exports (in other words the real value of imports received in exchange for African exports) rose at one-and-a-half or double those rates: 4.96 and 4.65 percent respectively. Contrary to the views of Hopkins and Eltis and Jennings, the real revenues from West-African exports did not contract during the third quarter of the nineteenth century, but rose at an impressive rate. The change in the price for commodity exports (relative to the price of imports) accounted for more than half of the increase in the purchasing power of exports for French West Africa and nearly a third for British West Africa.
DECOMPOSITION OF EXPORT GROWTH IN BRITISH AND FRENCH WEST AFRICA, 1853–1929

Notes: Growth rate in natural logs. The purchasing power of export in column (1) is the sum of columns (3) and (4) minus (2). The price contribution is the difference between columns (3) and (2) divided by (1). The volume contribution is the ratio of (4) and (1). May not sum to total due to rounding.
Sources: British “Import Price” from Mitchell (Reference Mitchell1988); French “Import Price” from Mitchell (Reference Mitchell2007); British “Export Values” from Statistical Abstracts (various issues); French “Export Values” from Tableau General du Commerce (1860–1867); Annuaire Statistique de la France (1878–1939); British and French export price see text.
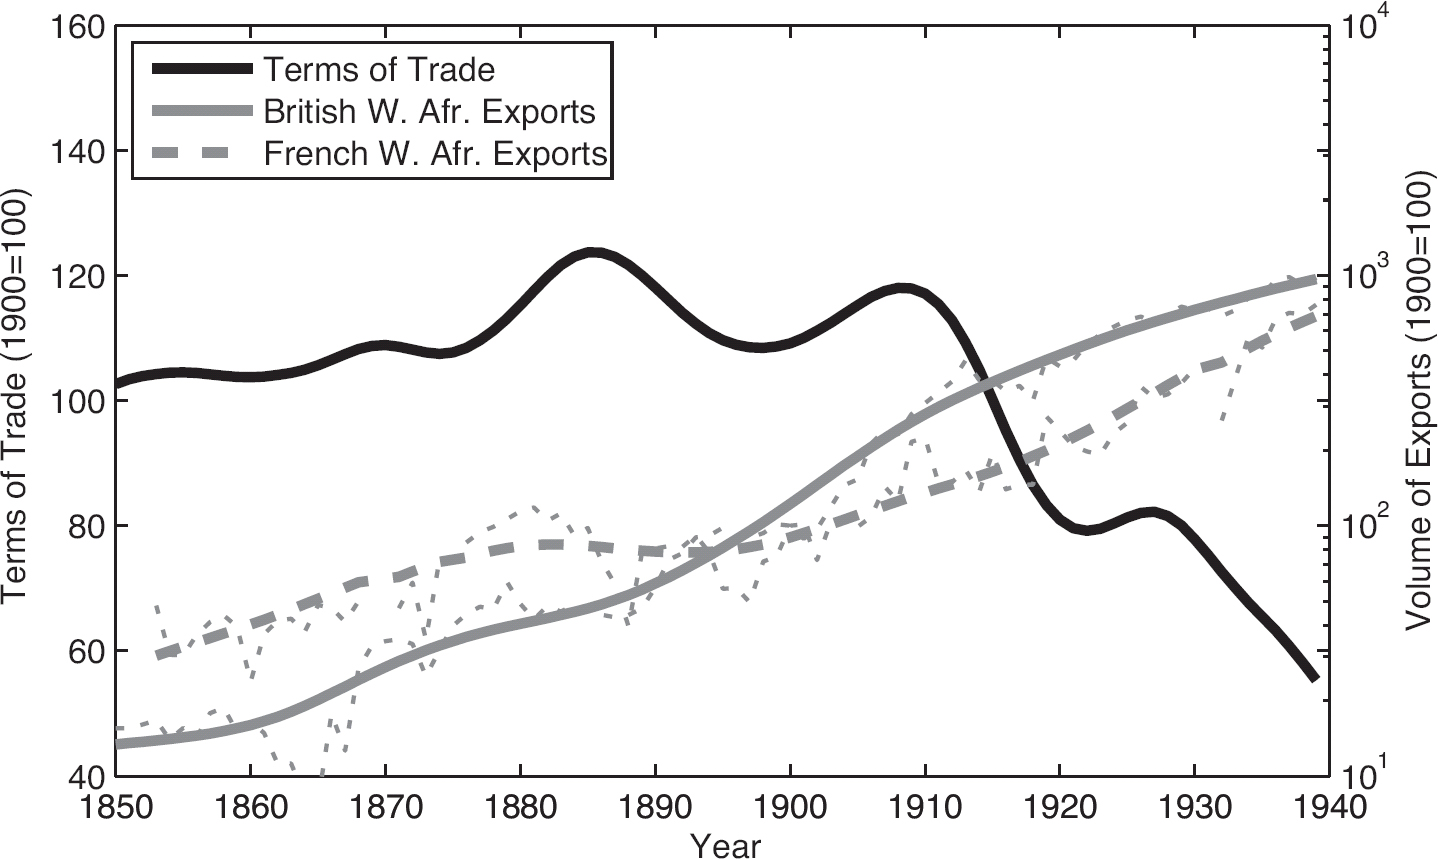
After 1885, the terms of trade went into sharp decline, reflecting the fact that export prices rose more slowly than the prices for imported goods. The terms-of-trade decline notwithstanding, the purchasing power of exports still rose between 1885 and 1929. This was driven exclusively by a pronounced increase in the export volume for both British and French West Africa. Later, we discuss why the export boom continued during the colonial era, despite the sharp decline in the African terms of trade.
AFRICA'S COMMODITY PRICE BOOM IN GLOBAL PERSPECTIVE
What did West Africa's commodity price boom look like in a global comparative perspective? First, we compare the West African NBBT trends with four other African sub-regions, which are all characterized by rather different export packages: East Africa, the African islands, the Cape Colony (later South Africa), and Egypt. Then, we compare the West African NBTT trends with the European Periphery (Italy, Portugal, Russia, Spain), the Middle East (Egypt, Ottoman Turkey, Levant), Latin America (Argentina, Brazil, Chile, Cuba, Mexico, Venezuela), South Asia (Ceylon, India), and Southeast Asia (Indonesia, Malaya, the Philippines, Siam).Footnote 24
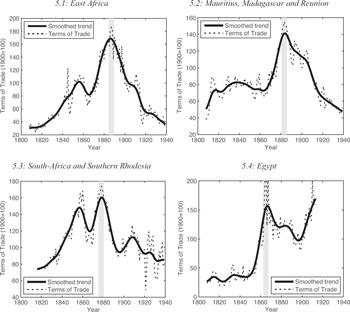
Figure 5 shows that the NBTT in other parts of Africa also rose impressively during the nineteenth century, but there are some major differences. Firstly, relative prices of South African commodities such as wool, wine, and hides (diamonds and gold are excluded) did not increase as much as the relative prices of tropical commodities. The boom in East Africa was driven exclusively by ivory prices. In Egypt, the terms of trade were driven by cotton prices which peaked in the 1860s when world supplies dwindled because of the American civil war. Finally, while the rise of the NBTT up to the 1860s was slower in the African islands—where sugar dominated—its peak in the early 1880s was similar to West Africa.
REGIONAL NET BARTER TERMS OF TRADE AFRICA, 1784–1939 (1900=100)

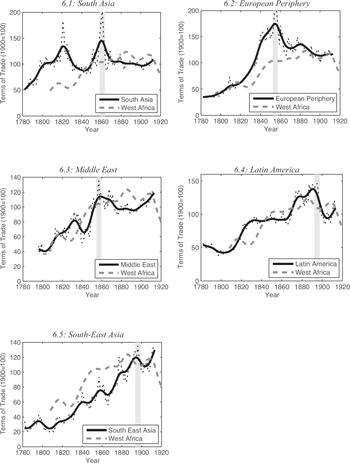
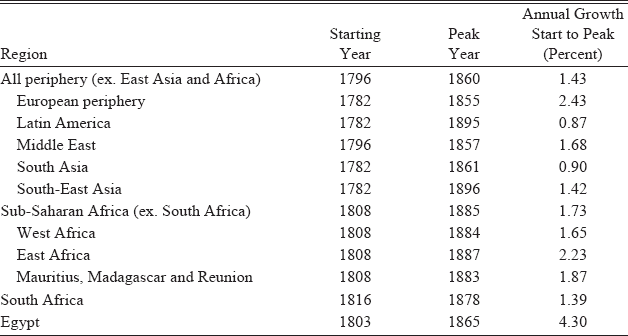
The comparison of West Africa and Africa more generally with other commodity exporters is described in Figure 6. We show the relationships for South Asia, the European periphery, the Middle East, Latin America, and Southeast Asia. South Asia—dominated by India—had a shorter and a weaker nineteenth century terms-of-trade boom than West Africa with the South Asian terms of trade peaking in 1861, a full quarter of a century before the West African peak. Annual average growth of South Asia's NBTT from its trough to boom was just half of what we observe for sub-Saharan Africa (see Table 4). Over the full nineteenth century up to 1885–1890 South Asia recorded no NBTT growth at all, whereas we find an annual average growth of 1.73 for sub-Saharan Africa. Indeed, all the growth in India's terms of trade took place up to the 1820s; after that decade, India exhibited great volatility, but no secular growth in its terms of trade.Footnote 25 The European periphery and the Middle East both had a steeper boom-to-peak than West Africa, but, like South Asia, they were shorter, peaking in 1855 and 1857. The terms of trade for Latin America and Southeast Asia were more like West Africa, which is explained by the larger similarities in the export packages of these three regions.
TERMS OF TRADE WEST AFRICA AND THE REST OF THE POOR COMMODITY-EXPORTING PERIPHERY, 1784–1913

TERMS OF TRADE IN THE PERIPHERY, AFRICAN GROWTH RATES IN PERSPECTIVE (PERCENT)

Note: Growth rate in natural logs.
Sources: “Other periphery” from Williamson (Reference Williamson2011). “Africa” see text.
In Table 4 we convert this visual accounting into annual growth rates. From the late eighteenth century to 1860, the commodity-exporting “periphery” experienced one of the biggest terms of trade booms in world history. The unweighted annual average growth rate of the five regions mentioned earlier—excluding Africa and East Asia—was 1.43 percent per annum. The figure for West Africa was even higher, 1.65 percent per annum. West Africa also enjoyed its boom a couple of decades longer than the average poor commodity exporter. Summing up, Hopkins and Eltis and Jennings were surely correct about the rising terms of trade in West Africa, but our new NBTT estimates reveal that the boom was stronger and more prolonged than they have envisaged.
AN ECONOMIC RATIONALE FOR THE WEST AFRICAN SCRAMBLE?
This new evidence documenting the evolution of nineteenth century Afro-European trade allows us to re-assess the economic rationale for the West African scramble. The relevant historical counterfactual has two elements: would the case for building a railway into the West African interior have been politically defensible if the West African share in French imperial trade would have been as small as it was in British imperial trade? And second, would their ambitions to invade have gathered sufficient political support without the commodity price boom that started around the mid-1830s and continued up to the mid-1880s, a price boom that contributed more than half of the growth in French imports from West Africa? While these counterfactuals are impossible to test in a formal way, we will argue here that the economic rationale for the scramble did not only appear much stronger in the 1880s than in the 1830s, but also that West Africa had a different place in French than in British visions of empire.
During the mid-nineteenth century, the British government took the view that free trade should be promoted without interference in indigenous affairs. Especially with regard to Africa, the Treasury did everything to block increasing expenses on colonial settlements (Hargreaves Reference Hargreaves1963). In an earlier study, John Gallagher and Ronald Robinson (Reference Gallagher and Robinson1953, p. 4) observed that formal policies and historical practices diverged, noting that British warships in Canton (Guangzhou) and the establishment of formal control over major parts of India (the Raj) did not demonstrate a “reluctance” to the expansion of empire, and were motivated by securing British mercantile and capitalist interests. With respect to Africa, they stated that “the West Africa Committee of 1865 made a strong and much quoted case for giving up all but one of the West African settlements, but even as they sat these settlements were being extended.”Footnote 26 Gallagher and Robinson argued that the British only opted for the expansion of “formal empire” when their options of informal control (via voluntary or enforced free trade treaties) were undermined by unreliable local trading partners or by European contenders. In later work they went a step further, arguing that the economic rationale for the African scramble was to be found in Asia (Robinson and Gallagher Reference Robinson and Gallagher1961).
Hopkins noted, however, that the British and French did set out to secure those places where they had built up the strongest commercial relations: the French in the Senegambia area, the British around the Volta and Niger basins. He reasoned that European demand for industrial inputs had driven up the price of West African export commodities, but that the price of palm-oil, and many agricultural commodities, had started to fall after the 1860s as a result of the “great depression” of 1873–1895, so that the timing of the price boom did not align with the timing of the scramble. He contended that falling African commodity prices provoked intra-African conflicts over shrinking export revenues, induced extra tolls and tariffs in compensation, and that the undermining of free trade by Africans motivated European intervention (Hopkins Reference Hopkins1972, p. 586).
The Hopkins thesis has been criticized by Ade Ajayi and Ralph Austen (Reference Ajayi and Austen1972, pp. 304–306) who pointed out that the Yoruba wars in Nigeria that Hopkins had referred to were not primarily motivated by considerations of declining external trade revenues, since it accounted for only a small portion of the economic surpluses that were generated in the domestic economy. Moreover, Ajayi and Austen contended that the palm-oil trade in Southern Nigeria was not the main prize of the scramble. Even though the British secured territorial control over Lagos in 1861, they argued that Europeans were primarily concerned with capturing the external and internal trade flows of the major Savannah empires in the middle Niger delta.
Whereas this was certainly true for the French (see later), the British concentrated their efforts on the annexation of Lagos. Hopkins (Reference Hopkins1980) elaborated his earlier argument by noting that the impetus given to the palm-oil trade by regular steamship connections also required changes in property right regimes, especially with respect to marketable ownership rights over land. The increasing reliance on mercantile credit in societies with non-convertible currencies (in other words cowries) stimulated demand for securities by the European trading community. Such changes in property rights regimes required the presence of a reliable government capable of creating institutions for land transfers and protecting land rights. Although the call of the merchant community for the annexation of Lagos cannot explain the West African scramble as such, the relationship between land rights and territorial control became of imminent importance in later plans for the construction of railways.
The chronology is important. According to Colin Newbury and Alexander Kanya-Forstner (Reference Newbury and Kanya-Forstner1969, p. 255), French intentions to extend their territorial control over the Western Sudan were already a serious political consideration in the 1850s, and were inspired by the successful conquest of Algeria in the 1830s. The original idea, put forward by Senegal's governor Louis Faidherbe, was to create a trans-Saharan union connecting the Middle Niger delta and the major inland cities such as Bamako, Gao, and Timbuktu, into a triangular network with Algeria to the North, and the Senegambia to the West. Given the growing importance of both areas in French imperial trade, a railway connection with the Savannah empires was perceived as a logical extension of the French African Empire. In the mid-1860s these plans were put on hold, as France was distracted by overseas wars in Mexico and Indochina (Newbury and Kanya-Forstner Reference Newbury and Kanya-Forstner1969, p. 256). However, the humiliating defeat in the Franco-Prussian war in 1870–1871, as well as the continuing expansion of the British overseas empire, kept fueling a political desire to reinvigorate national grandeur (Cain and Hopkins Reference Cain and Hopkins1993, pp. 329–31).
Meanwhile, Bordeaux merchants trading in Senegambia, enthralled railway engineers and colonial governors kept lobbying for imperial expansion in West Africa. While the costs of invading West Africa appeared insurmountable in the 1850s and 1860s, the French government did approve new funds for strengthening colonial control over the Senegambia area. The reconstruction of the run-down fort at Podor and the construction of a new fort at Médine in the 1850s, were motivated by the need to crush Moorish control over the expanding gum trade (Newbury and Kanya-Forstner Reference Newbury and Kanya-Forstner1969, pp. 254, 257). The rapid growth of the groundnut trade in the 1860s commanded the erection of new forts at Boffa, Boké, and Benty (Hargreaves Reference Hargreaves1963, pp. 129–36). At the same time, colonial investments at the Slave and Ivory coasts (present-day Benin and Côte d'Ivoire), and in particular the French stronghold in Porto-Novo, were scaled back. The prospects of expanding trade with the Senegambia, and contracting trade further South, thus played a key role in the re-allocation of France's imperial budgets.
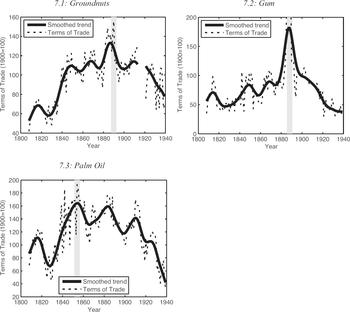
The fascinating reconstruction of the political chronology by Newbury and Kanya-Forstner (Reference Newbury and Kanya-Forstner1969, p. 257) reveals that the definitive decision by the French government to invade the West African interior was prepared in 1876–1879, that is before the British occupation of Egypt in 1882. The economic context in which this decision was made was one of depressed trade in Europe, but growing trade with West Africa (see Figure 2). Although there was a price collapse for gum and groundnuts in 1877, with severe fiscal repercussions, this depression was short lived. Figure 7 shows that whereas the relative price of palm oil fell, that for gum and groundnuts continued to rise up to the mid-1880s. These trade developments fueled ex-ante optimism on the economic prospects of penetrating the Senegalese hinterland, even though the envisaged wealth of the Savanah empires, and especially its gold deposits, were exaggerated to mythical proportions (Newbury and Kanya-Forstner Reference Newbury and Kanya-Forstner1969, p. 261; Brunschwig Reference Brunschwig1960, pp. 23–28).
COMMODITY SPECIFIC NET BARTER TERMS OF TRADE, WEST AFRICA 1808–1939 (1900=100)

TRADE AFTER THE SCRAMBLE
While a more in-depth analysis of trade during and after the scramble warrants a separate study, we conclude by making three general observations. First, although African commodity exports increased throughout the nineteenth century, the price boom was the defining feature of the 1835–1885 period, with export volumes rising as a supply response. What followed was different. The export boom continued, but it coincided with a prolonged fall in commodity prices. That is, commodity exports now grew for reasons other than a supply response to favorable world prices. As shown in Table 3, the post-scramble acceleration of export growth was entirely caused by volume growth. This growth in export quantities was facilitated by railroads. European territorial control paved the way for railway investments unlocking the export potential of the African interior. Most of these railways were constructed and completed in the four decades following 1890. Although this export boom involved some diversification into a wider range of tropical commodities and minerals, the overall composition of African exports remained overwhelmingly based on primary commodities. It should also be noted that while sea-bound exports from sub-Saharan Africa to Europe increased exponentially after the scramble, the imposition of colonial borders often disrupted existing intra-African trade relations.Footnote 27
This deepening of specialization in primary commodities during an era of almost continuously worsening terms of trade raises another question. Why did Africa not escape this commodity export trap after world markets soured? We will not try to offer a comprehensive answer to this question here, except to note that an explanation must come from two sources: first, the African endowment of abundant land with scarce capital, labor and skills, an endowment that heavily favored land-extensive agriculture, and mining; and second, colonial policies designed to support specialization in primary commodities (Austin, Frankema, and Jerven Reference Austin, Frankema, Jerven, O'Rourke and Williamson2017). Any attempt to sort out these two forces will have to deal with the evidence in Figure 8, showing that export growth was slower before the 1880s, when prices boomed, and faster after the 1890s, when prices slumped, not only to the detriment of African producers, but also to European investors and plantation-owners. It is also worth noting that the price slump was larger in French Africa than in British Africa, partly because of the declining value of the French Franc after abandoning the gold standard.
TERMS OF TRADE AND VOLUME OF EXPORTS FROM WEST AFRICA, 1850–1939 (1900=100)

Furthermore, the move towards trade liberalization that occurred in Europe during the mid-nineteenth century was implemented in colonial Africa right at the time that it was starting to reverse in Europe. Colonial governments implemented modest tariff policies, mainly motivated by the need to raise government revenues, not by the desire to protect local producers. Colonial governments promoted the free flow of goods into and out of their territories, and relied on large-scale programs of forced labor to build the necessary infrastructure (Frankema and van Waijenburg Reference Frankema and Jerven2014). Colonial governments imposed ad valorem import duties around 5 to 10 percent and left exports largely untaxed.
Liberal trade policies came under pressure in the 1930s, when soaring budget deficits forced colonial governments to rethink their models of colonial economic development. Marketing boards were established to strengthen the control of colonial governments on the main export sectors via price controls and monopsonies. The marketing boards were initially intended to stabilize volatile commodity prices and African farm incomes, but the revenues derived from the increasing margins between marketing board purchase prices and world market prices were kept in metropolitan funds and were not channeled back directly into the development of local agriculture (Meredith Reference Meredith1986; Havinden and Meredith Reference Havinden and Meredith1995). In the settler colonies, where government interventions in markets for labor and land had been more pervasive and biased against African smallholders, colonial policy reforms removed some of the restrictions in the hope to revive commodity exports (Frankema, Green, and Hillbon Reference Frankema, Green and Hillbom2016).
Finally, thanks to the commodity export boom Africa's share of world trade kept rising to about 5 percent in 1950. This share was maintained during the late colonial era up to the early 1970s. The rise itself is not surprising. Africa was the last major world region to be unlocked by railways. Moreover, if the external slave trade had crowded out the development of commodity exports, the slave trades must also have retarded the integration of Africa into world commodity markets. Yet, globalization-induced specialization in primary products also meant greater price volatility, and this compounded the divergence in growth rates during the twentieth century. African export prices collapsed again during the 1970s and only started recovering around 1995–2000. How long Africa's commodity boom will last this time is difficult to say, but one thing seems clear: the recent rise in African terms of trade is far more modest than the 1835–1885 boom.
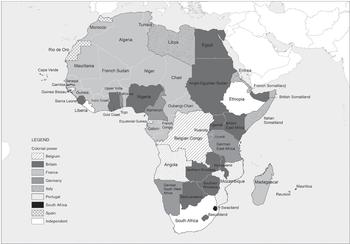
Appendix 1: Map
COLONIAL BORDERS IN SUB-SAHARAN AFRICA, CIRCA 1914