Introduction
Silkworms (Bombyx mori L.), one of the most famous economic insect that belongs to the order Lepidoptera, have been bred in China for over 5000 years. However, massive economic losses caused by infectious diseases often occur in the sericulture industry. For this reason, several disinfectants, such as sulfur, lime, bleaching powders, formaldehyde, and even antibiotics, are widely used. However, these disinfection methods possess serious potential risks on the growth and development of silkworms (Gao et al., Reference Gao, Cui, Zhang, Ren, Wu and Yu2014; Liu, Reference Liu2015; Li et al., Reference Li, Zhou, Zhang, Chen, Yang and Feng2019; Ze, Reference Ze2019), and even harm to the farmers. Therefore, new disinfectants with fewer side-effects in sericulture have become an important unmet need (Xiong et al., Reference Xiong, Chen, Chen, Cheng, Tan, Tang, Chai and Du2018).
Intestinal microorganisms play an important role in the growth and development of animals. The animal intestine contains complex and diverse microbes that more than 1000 species have been reported. Among these microbes, Firmicutes and Bacteroidetes are usually reported as the dominant bacteria in the intestinal tract (Mu et al., Reference Mu, Yang and Zhu2016). Massive intestinal microbes together with the host digestive system form a complex interaction network, enabling them to colonize and adapt to the special environment in the intestinal tract (Mu et al., Reference Mu, Yang and Zhu2016). The intestinal microbes show complex physiological functions to the host. For example, several genera, in particular, Bifidobacteria and Lactobacillus, produce essential secondary metabolites including short-chain fatty acids during intestinal fermentation (Gao et al., Reference Gao, Mu, Yu and Zhu2016), which benefits host growth. Intestinal microbes also participate in host amino acid metabolism (Yang et al., Reference Yang, Dai and Zhu2014; Dai et al., Reference Dai, Wu, Hang, Zhu and Wu2015), e.g., aromatic amino acid metabolism (Ma et al., Reference Ma, He and Zhu2016), which is closely related to neural function (Farzi et al., Reference Farzi, Fröhlich and Holzer2018). Various microbes interact with each other and symbiotic with the host in their intestinal tract to build a relatively stable microecological community. Changes in the abundance of a certain kind of symbiotic bacterium may affect the whole intestinal microbial community, which may cause the death of the host in some extreme cases. For example, the explosion of some harmless microbes, such as Enterobacter sp. and Klebsiella aerogenes (syn. Enterobacter aerogenes) isolated from the gut of Agrotis segetum, caused 30 and 10% mortality respectively when the larvae were fed on lettuce leaves dipped in each bacterial suspension (Thakur et al., Reference Thakur, Dhammi, Saini and Kaur2015).
The community structure of intestinal microbes is determined by various factors, including diet (Colman et al., Reference Colman, Toolson and Takacs-Vesbach2012), developmental stage (Yun et al., Reference Yun, Roh, Whon, Jung, Kim, Park, Yoon, Nam, Kim, Choi, Kim, Shin, Kim, Lee and Bae2014), genetic factors (Kalliokoski et al., Reference Kalliokoski, Jacobsen, Darusman, Henriksen, Weimann, Poulsen, Hau and Abelson2013), and exogenous additives (Yegani and Korver, Reference Yegani and Korver2008; Park et al., Reference Park, Lee, Kim, Christensen and Ricke2017). In the natural environment, the most significant influence factor that affects insect intestinal microbes is the foods. For example, Spodoptera litura, a Lepidoptera omnivorous insect, feeds on nearly 300 kinds of plants including cotton and vegetables, which makes its intestinal microbiota very variable (Thakur et al., Reference Thakur, Dhammi, Saini and Kaur2015). Even the silkworms, an oligophagous insect naturally feeds on mulberry leaves, were also reported that intestinal microbiota was significantly changed while fed with lettuce leaves (Xue et al., Reference Xue, Fu, Tong and Liu2014). In an artificial environment, the exogenous additives such as organic compounds, inorganic salts, disinfectants and antibiotics, show significant impacts on intestinal microbiota (Yegani and Korver, Reference Yegani and Korver2008; Park et al., Reference Park, Lee, Kim, Christensen and Ricke2017). The influence of antibiotics on host natural intestinal microbiota has been well studied. Antibiotics usually target specific types of microbes (e.g., vancomycin and Gram-positive organisms), however, their effects on the microbiome go beyond just those clinically targeted microbes. Removing certain species of bacteria opens niches for other microbes to expand which, in turn, can result in microbiome disruptions or microbial dysbiosis. For example, Gram-positive microbe-targeted antibiotic vancomycin leads to the loss of some Gram-negative taxa (Robinson and Young, Reference Robinson and Young2010). In human, antibiotic-induced dysbiosis contributes in the shorter-term to antibiotic-associated diarrhea and is epidemiologically linked to a variety of longer-term health problems including obesity, asthma, allergy, and inflammatory bowel disease (Willing et al., Reference Willing, Russell and Finlay2011; Tamburini et al., Reference Tamburini, Shen, Wu and Clemente2016). Thus, while disinfectants or antibiotics are intended to target specific pathogenic microbes, their effects can be much more extensive, long-lasting, and unpredictable (Willing et al., Reference Willing, Russell and Finlay2011), not to mention the serious drug resistance disaster.
In the last decade, nanoparticles have opened up new therapeutic avenues for attacking infectious diseases. The relatively new class of nano-pharmaceuticals displays unique properties that arise due to their ultra-small size, large surface area, high reactivity, and modifiable surfaces (Lembo and Cavalli, Reference Lembo and Cavalli2010). Nowadays, nano-disinfectants are believed as environment-friendly, harmless alternatives of traditional disinfectants. For example, it has been proved that certain doses of TiO2 nanoparticles (less than 200 µg mL−1) did not show apparent toxicity to mammalian cells (Jeng and Swanson, Reference Jeng and Swanson2006) and animals (Mikkelsen et al., Reference Mikkelsen, Sheykhzade, Jensen, Saber, Jacobsen, Vogel, Wallin, Loft and Møller2011). In silkworms, nanoparticles of aluminosilicate and amorphous silica have been reported with antiviral effects against B. mori nucleopolyhedrovirus infection (Rahman et al., Reference Rahman, Biswas, Ulrichs, Büttner, Bramhachary, Goswami and Datta2009a; Biswas et al., Reference Biswas, Rahman, Datta, Goswami and Bramhachary2010). In addition, TiO2 nanoparticles even improved the food conversion efficiency in the silkworm 5th instar larvae (Zhang et al., Reference Zhang, Ni, Li, Xu, Wang, Hong, Shen and Li2014). It is generally accepted that there is a close relationship between silkworm intestinal microbiota and the host growth and development (Stanley et al., Reference Stanley, Geier, Denman, Haring, Crowley, Hughes and Moore2013; Clavijo and Flórez, Reference Clavijo and Flórez2018). As a new kind of bactericide, nanosilver might be possibly used in sericulture, however, it is unclear whether nanosilver influences silkworm intestinal microbial community and consequently affects growth and development. In this study, we used high throughput sequencing technology to examine the intestinal microbes of the silkworms feeding with different concentrations of nanosilver. We found that nanosilver treatment significantly changed the intestinal bacterial community of silkworms and a certain concentration of nanosilver did not show unacceptable negative effects.
Materials and methods
Materials
The silkworms, B. mori L. (strain Qiufeng) were provided by the Chongqing Sericulture Science and Technology Research Institute (N29°, E106°; China). Mulberry leaves were provided by the Pilot Mulberry Group, College of Biotechnology, Southwest University (China). Nanosilver was provided by Professor Huamao Du of the College of Biotechnology, Southwest University.
Polymerase chain reaction (PCR) amplification reagents, deoxyribonucleic acid (DNA) extraction kits, and PCR fragment recovery kits were purchased from Beyotime Biotechnology (Jiangsu, China).
Sample preparation
The silkworm larvae from 1st to 3rd instar were fed with mulberry leaves at room temperature (25°C). In the 4th instar, silkworm larvae were separated by genders (Male, M, and female, F) and were then randomly divided into three groups, which including control groups (M0 and F0), 20 mg L−1 nanosilver treated groups (M20 and F20), and 100 mg L−1 nanosilver treated groups (M100 and F100). Each treatment group had three replicates, and each replicates contained 50 silkworms. The control group was fed with mulberry leaves treated with dd water, and the treatment group was fed with mulberry leaves treated with nanosilver. At day 7 in the 5th instar, each silkworm larva was starved for 24 h, soaked in 75% alcohol for 15 s, rinsed with sterile water three times, and the intestinal fluid was collected in a sterile centrifuge tube, and then centrifuged at 12,000 rpm for 15 min. The separated supernatant was stored at 4°C. For further experiments, the intestinal fluids of five silkworms were mixed as one sample. In each replicate group, three samples were collected.
Assessment of silkworm growth and development (body weight, cocooning rate, and survival rate)
The silkworm larvae in each treatment group were weighed at first and last day in 4th and 5th instar (day 1 and day 3 in 4th instar, day 1 and day 7 in 5th instar, respectively). After silkworm spinning, the cocoons were counted, and the pupae inside were recorded. The final cocooning and survival rate were calculated and subjected to statistical analysis by using Sigmaplot software (version 12.0).
 $${\rm Cocooning}\;{\rm rate}\;(\% ) = {\rm Cocoons}/{\rm numbers}\;{\rm of}\;{\rm silkworm}\;{\rm larvae} \times 100\% $$
 $${\rm Survival}\;{\rm rate}\;(\% ) = {\rm Alive}\;{\rm pupae}/{\rm numbers}\;{\rm of}\;{\rm silkworm}\;{\rm larvae} \times 100\% $$
Extraction of total DNA from the bacteria in silkworm intestinal fluid
For DNA preparation and further analysis, one sample from each replicate group was randomly selected. DNA was extracted from 30 µL samples of intestinal fluid using an OMEGA Microbial Genome Extraction kit (OMEGA, Norcross, GA, USA) according to the manufacturer's protocol. DNA integrity was tested by using agarose gel electrophoresis with a 1.8% gel, followed by an assessment of DNA concentration and purity using a NanoDrop spectrophotometer (Thermo Scientific, Waltham, MA, USA).
PCR amplification of the V3–V4 region of 16S rRNA
PCR amplification was carried out using diluted genomic DNA (2 ng µL−1) as the template and the following primers for the V3–V4 region of 16S rDNA: 338F, 5′-ACTCCTACGGGAGGCAGCA-3′ and 806R, 5′-GGACTACHVGGGTWTCTAAT-3′ (Zen et al., Reference Zen, Gao, Mo, Wang, Liu, Liao and Xie2018). The 50 µL PCR amplification reaction contained 5 µL 10 × PCR buffer, 0.5 µL dNTPs (10 mmol L−1), 10 ng genomic DNA, 1 µL Bar-PCR primer F (50 µmol L−1), 1 µL Bar-Primer R (50 µmol L−1), 0.5 mL Taq (5 U µL−1), and water to the target volume. The amplification parameters were as follows: pre-denaturation at 98°C for 5 min; denaturation at 98°C for 30 s, annealing at 50°C for 30 s, and extension at 72°C for 60 s for a total of 25 cycles; and a final extension at 72°C for 5 min. Amplified products were stored at 4°C. PCR products were sent to PersonalBio Inc. (Shanghai, China) for sequencing, and produced 250-bp paired-end (PE) reads on the Illumina HiSeq 2500 platform (Illumina, San Diego, CA, USA).
Data analysis
The double-end sequence data were optimized based on PE overlap, superimposed using FLASH and filtered using QIIME, and chimeras were removed using UCHIME (Schloss et al., Reference Schloss, Westcott, Ryabin, Hall, Hartmann, Hollister, Lesniewski, Oakley, Parks, Robinson, Sahl, Stres, Thallinger, Van Horn and Weber2009; Jregory et al., Reference Jregory, Justin, Jesse, Kyle, Frederic, Elizabeth, Noah, Antonio, Julia, Jeffrey, Gavin, Scott, Dan, Jeremy, Ruth, Catherine, Daniel, Brian, Meg, Jens, Joel, Peter, William, Jeremy, Tanya, Jesse and Rob2010). Cluster analysis and Greengenes operational taxonomic unit (OTU) species annotation were performed on optimized sequences with a sequence similarity greater than 97%. The differences in diversity among groups were analyzed by Sigmaplot software (version 12.0) with a one-way ANOVA (Holm–Sidak method) test. Dilution curves were plotted using QIIME Mothur and four common biodiversity indices, including Chao, abundance-based coverage estimators (ACE), Shannon, and Simpson (Edgar et al., Reference Edgar, Haas, Clemente, Quince and Knight2011; Pitta et al., Reference Pitta, Parmar, Patel, Indugu, Kumar, Prajapathi, Patel, Reddy and Joshi2014). Classification and abundance assessment in the genus level were analyzed using principal component analysis (PCA). The community structure was also analyzed at other levels to assess the microbiota in intestinal fluid. The abundance difference was regressed to the phylogenetic tree by using Megan.
Statistics
The statistical analysis such as plotting standard deviation in replicates and one-way ANOVA was performed by employing the Holm–Sidak test using Sigmaplot software (version 12.0).
Results and analysis
Intestinal bacteria genomic extraction and DNA fragment amplification
Intact total DNA fragments were extracted from the intestinal bacteria of silkworms. Target DNA fragments of ~500 bp were obtained via specific PCR amplification of the V3–V4 region of 16S rDNA (fig. 1). The results indicated that the quality of the intestinal bacterial DNA samples was suitable for further analysis.
DNA fragments amplified from the silkworm intestinal bacterial samples assessed by DNA agarose gel electrophoresis. The V3–V4 region of 16S rDNA fragments of three repeated groups in each treatment was obtained. Lanes M0, M20, and M100 represent the male silkworms treated with 0, 20, and 100 mg L−1 nanosilver, respectively. F0, F20, and F100 represent the female silkworms treated with 0, 20, and 100 mg L−1 nanosilver, respectively. Lane CK represents the control group without DNA samples; lane M represents the DNA marker.

Summary of sequencing results
A total of 480,246 PE sequences were obtained from the silkworm intestinal fluid samples, and 311,040 optimized sequences were obtained after superimposition and filtration. For each sample, over 518,400,000 optimized sequences were obtained (table 1). OTU clustering was carried out using a cut-off of 97% similarity. A total of 2353 different OTUs were identified in all samples. The number of valid sequences and the number of OTUs in each sample are shown in table 1. The length of each optimized sequences fell within the range of 418–428 bp, and most sequences had a length of 418 bp. This is roughly consistent with the length of the V3–V4 region of 16S rDNA, which is ~500 bp. Sequence data were deposited in the NCBI database under the Bioproject accession number of SUB5785564.
Summary of sequence data from the silkworm intestinal bacterial samples

Validation of sampling depth in silkworm intestinal fluid samples
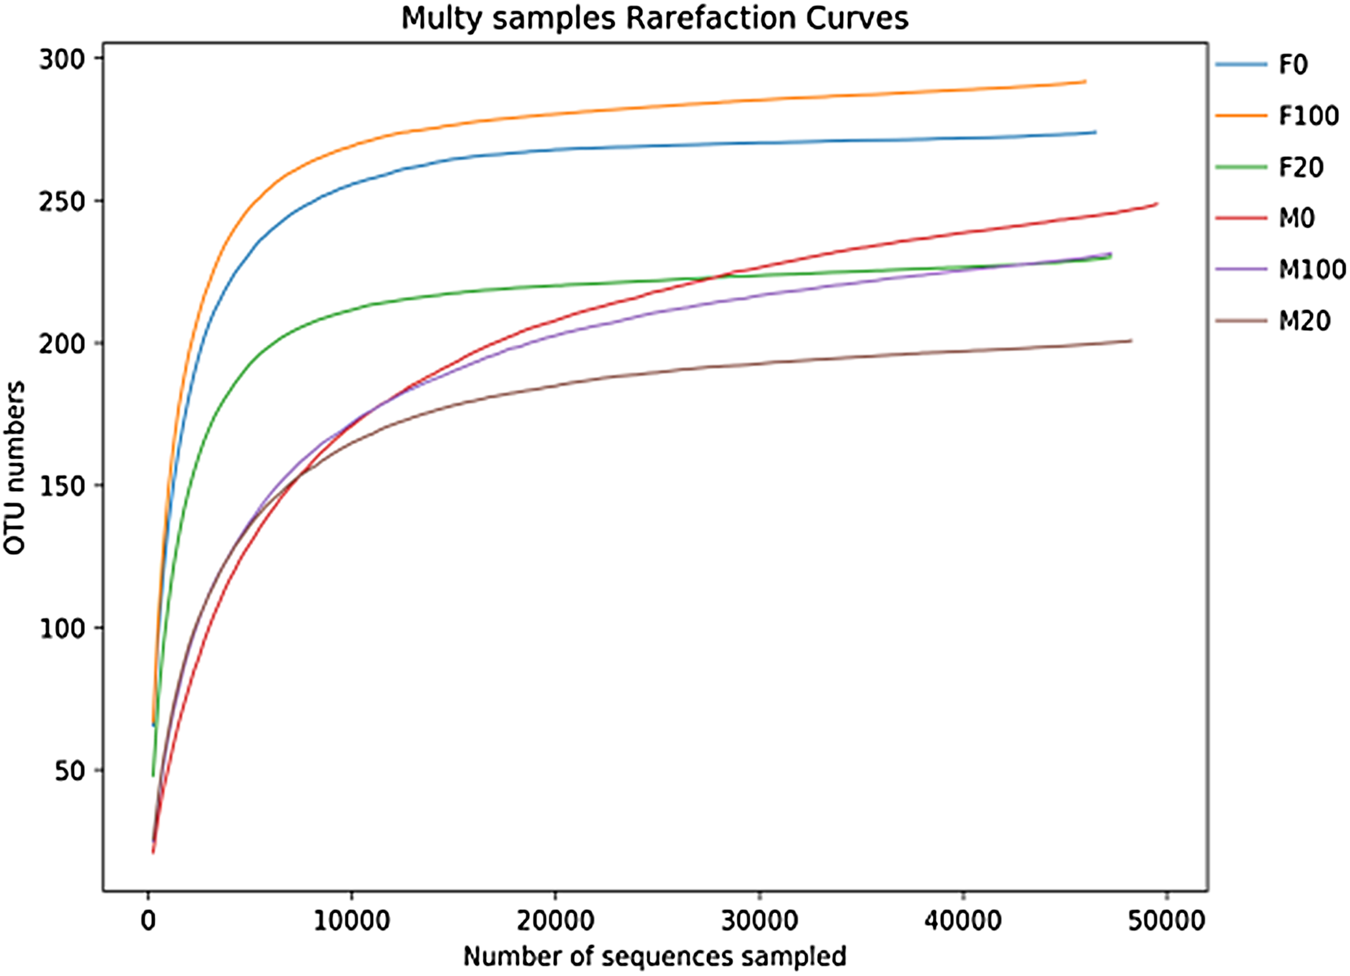
Rarefaction curves were used to reveal sampling depth and verify whether all bacterial groups in the sample were covered (Zhang et al., Reference Zhang, Zhu, Tian, Dai and Chen2016). In this study, as the number of samples sequenced increased, the rarefaction curves of all the six samples gradually flattened, demonstrating that the sequencing results were reliable. Based on this result, we were able to comprehensively assess the intestinal bacterial community structure with high confidence (fig. 2).
Rarefaction curves of the silkworm intestinal bacterial samples. M0, M20, and M100 represent the male silkworms treated with 0, 20, and 100 mg L−1 nanosilver, respectively. F0, F20, and F100 represent the female silkworms treated with 0, 20, and 100 mg L−1 nanosilver, respectively.

Alpha diversity analysis
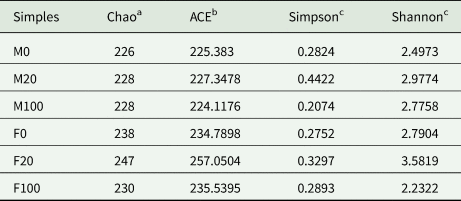
The Chao index reflects the abundance of bacterial communities, and higher Chao values indicate greater bacterial community richness. In contrast, the Shannon index reflects the diversity of bacterial communities, and a high-Shannon index value indicates higher diversity within a community. Table 2 shows that both Chao and Shannon indices of the 20 mg L−1 nanosilver treatment groups were higher than that of the control group, indicating that both the abundance and diversity of the intestinal bacterial flora were increased despite gender difference. However, both Chao and Shannon indices were decreased in the female silkworms treated with 100 mg L−1 nanosilver, indicating that high concentration of nanosilver may significantly affect the abundance and diversity of intestinal bacteria of females.
Richness and diversity indices of the silkworm intestinal bacteria treated with nanosilver

a Chao is a non-parametric method to estimate the total species richness of a single sample (Gray, Reference Gray2000).
b ACE, which reflects the species richness of a sample community (Chao and Lee, Reference Chao and Lee1992).
c Shannon and Simpson indices are used to measure heterogeneity diversity which encompasses not only the total number of species but also the proportional distribution of the individuals among the species (Gray, Reference Gray2000).
Principal component analysis (PCA)
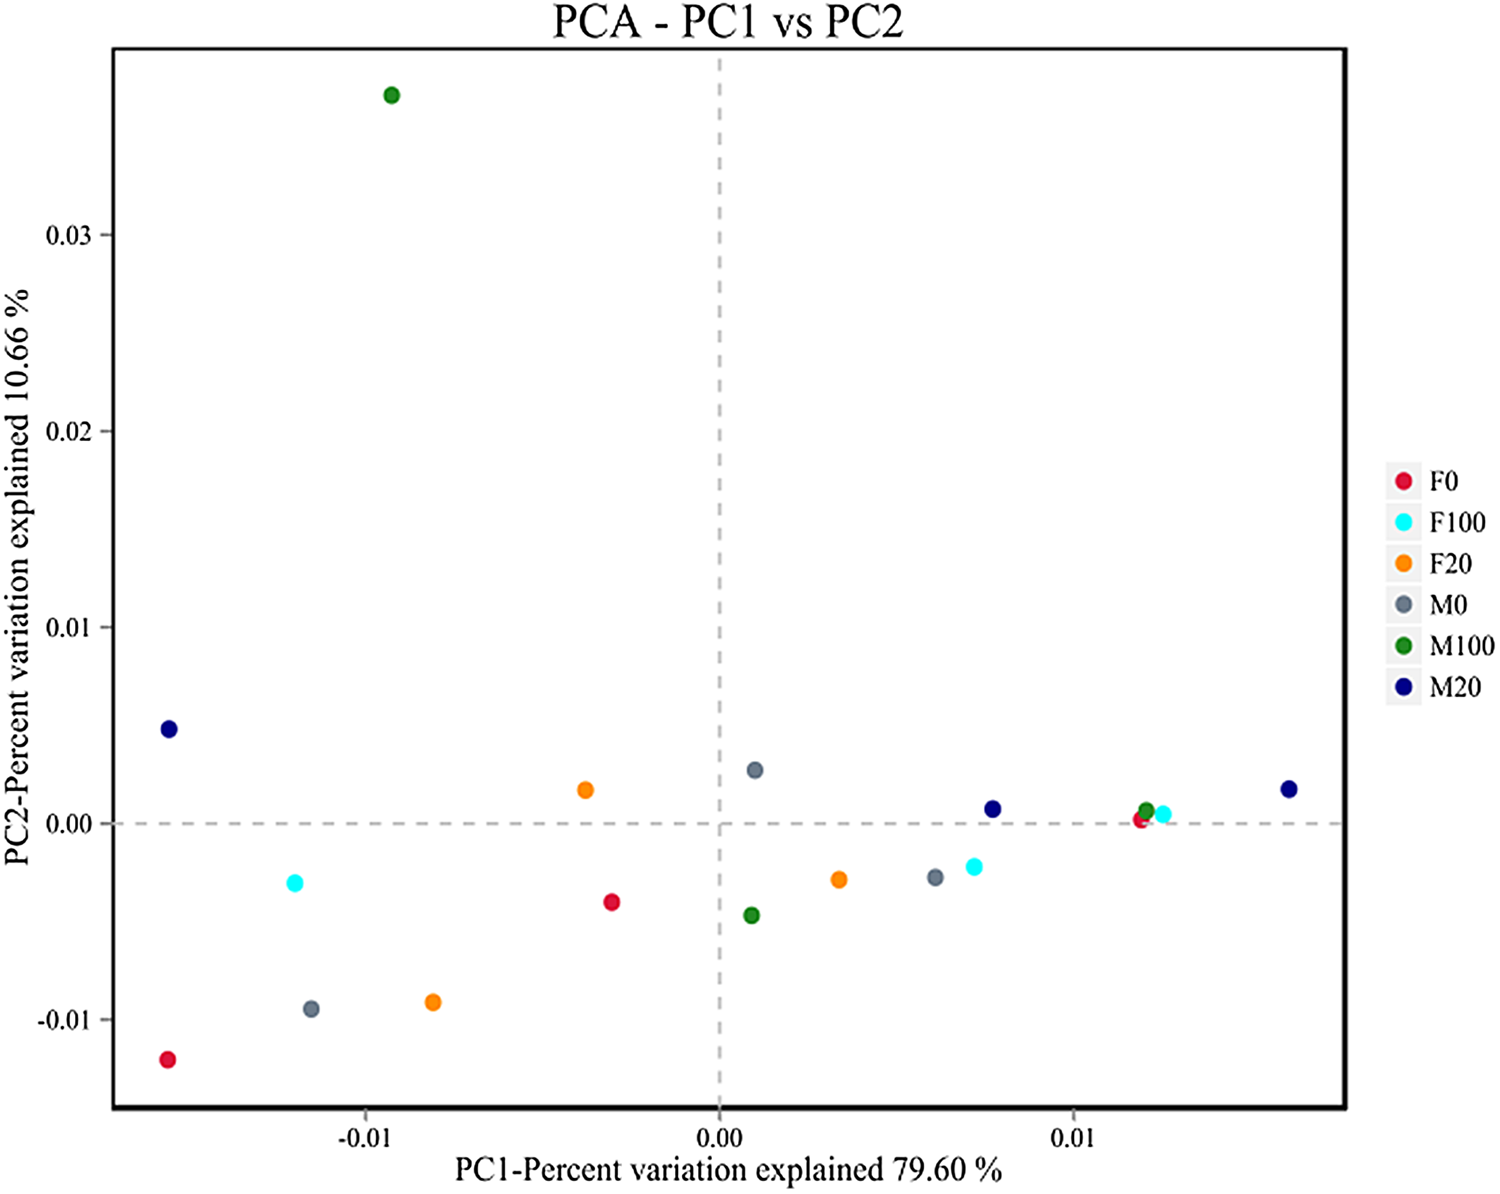
PCA showed that the two principal components (PCs) contributed to 90.26% of the variability, with PC1 and PC2 contributing 79.60 and 10.66%, respectively. Fig. 3 shows that sample M0 was located in the positive and negative regions of PC1 and PC2; sample M20 was located in the positive regions of PC2; and sample M100 was located in the positive and negative regions of PC1 and PC2 but far away from M0, indicating that the PCs differed significantly among these two groups. Sample F0 was located in the positive and negative regions of PC1 and PC2; sample F20 was located in the positive and negative regions of PC1 and PC2; and sample F100 was located in the positive and negative regions of PC1 and PC2 but differed from each other and widely spread, indicating that the PCs of the two groups varied significantly.
PCA plot of the silkworm intestinal bacteria samples at the genus level. M0, M20, and M100 represent the male silkworms treated with 0, 20, and 100 mg L−1 nanosilver, respectively. F0, F20, and F100 represent the female silkworms treated with 0, 20, and 100 mg L−1 nanosilver, respectively.

Variation of silkworm intestinal bacterial community at the phylum level
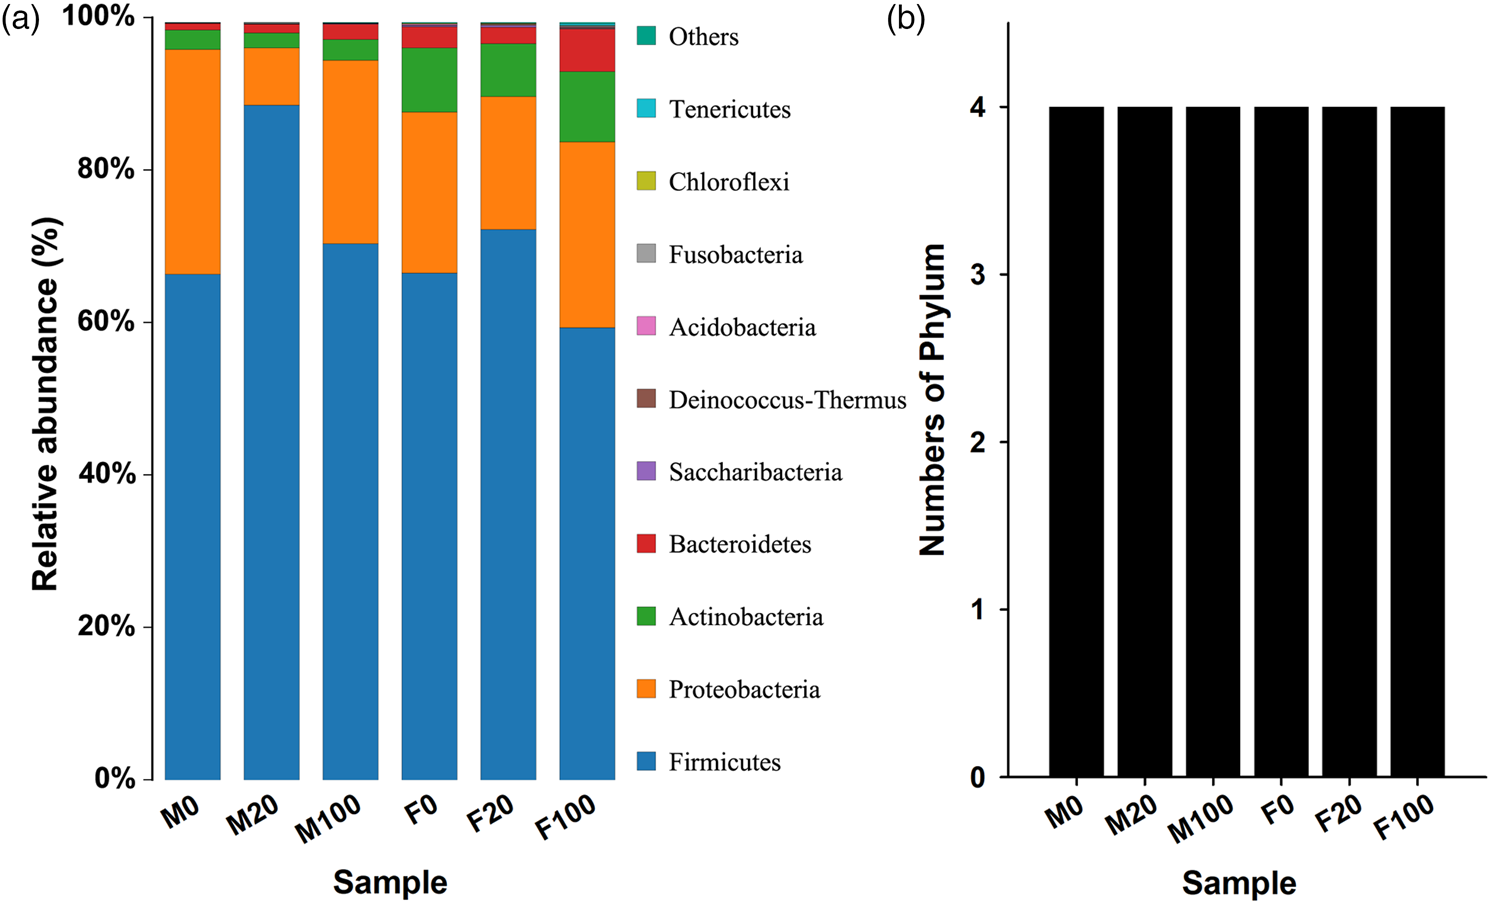
At the phylum level, 17 bacterial phyla were detected in the six groups of silkworm intestinal fluid samples. Among these bacterial phyla, the 10 most abundant phyla contributed for over 99% of the bacterial community, which were Firmicutes, Proteobacteria, Actinobacteria, Bacteroidetes, Saccharibacteria, Deinococcus–Thermus, Acidobacteria, Fusobacteria, Chloroflexi, and Tenericutes. The dominant bacteria (relative abundance higher than 0.1%) belonged to the phyla Firmicutes, Proteobacteria, Cyanobacteria, Actinomycetes, and Bacteroides. This trend was consistent in all the six tested groups either treated with or without nanosilver. These five bacterial phyla accounted for 99.84, 99.74, 99.75, 99.71, 99.35, and 99.12% of the total bacteria in the M0, M20, M100, F0, F20, and F100 groups, respectively. Comparative analysis among the groups revealed that the relative abundance of Firmicutes was increased in silkworms treated with 20 mg L−1 nanosilver than in silkworms in the control group. Specifically, the abundance of Firmicutes was increased by 33.5% in male and 8.6% in female silkworms, respectively. Compared with the control groups, the relative abundance of Firmicutes in 100 mg L−1 nanosilver treatment groups was decreased by 6.0 and 10.8% in male and female silkworms, respectively (fig. 4).
Variation of the bacterial phyla in silkworm intestinal fluid samples. (a) The top ten phyla of silkworm intestinal bacteria treated with or without nanosilver. (b) Numbers of phylum in each group (relative abundance higher than 0.1%). M0, M20, and M100 represent the male silkworms treated with 0, 20, and 100 mg L−1 nanosilver, respectively. F0, F20, and F100 represent the female silkworms treated with 0, 20, and 100 mg L−1 nanosilver, respectively.

Variation of silkworm intestinal bacterial community at the class level
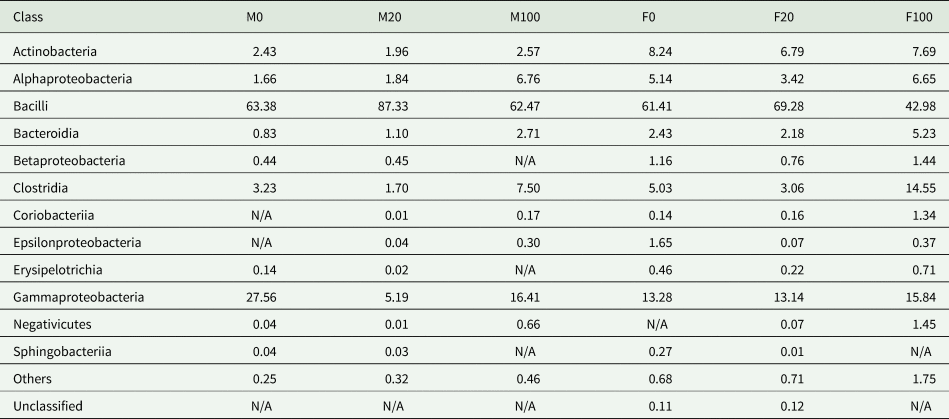
At the class level, 36 bacterial classes were detected in the six groups of silkworm intestinal fluid samples. Of which, Bacilli, Gammaproteobacteria, Clostridia, Actinobacteria, Alphaproteobacteria, Bacteroidia, Betaproteobacteria, Epsilonproteobacteria, and Negativicutes were the abundant classes (relative abundance higher than 0.1%). Fig. 5 shows that, compared with the control group, the relative abundance of Bacilli increased by 37.8 and 12.8% in the intestinal fluid of male and female silkworms while treated with 20 mg L−1 nanosilver, respectively. However, the relative abundance of Bacilli decreased by 1.4 and 30.0% in male and female silkworms treated with 100 mg L−1 nanosilver, respectively. The distribution of other dominant classes in the silkworm intestinal fluid also changed. Compared with the control group, the relative abundance of Clostridia was decreased by 47.4 and 39.2% in male and female silkworms treated with 20 mg L−1 nanosilver, respectively. In contrast, the relative abundance of Clostridia was increased by 132.2 and 189.3% in male and female silkworms treated with 100 mg L−1 nanosilver, respectively. Additionally, compared with the control group, the relative abundance of Alphaproteobacteria increased by 29.4 and 307.1% in female and male silkworms treated with 100 mg L−1 nanosilver, respectively.
Variation of the bacterial classes in silkworm intestinal fluid samples. (a) The top ten classes of silkworm intestinal bacteria treated with or without nanosilver. (b) Numbers of classes in each group (relative abundance higher than 0.1%). M0, M20, and M100 represent the male silkworms treated with 0, 20, and 100 mg L−1 nanosilver, respectively. F0, F20, and F100 represent the female silkworms treated with 0, 20, and 100 mg L−1 nanosilver, respectively. Error bars indicate Structural Equation Modeling (SEM) of three independent experiments. Statistical differences: *P < 0.05.

Variation of silkworm intestinal bacterial community at the genus level
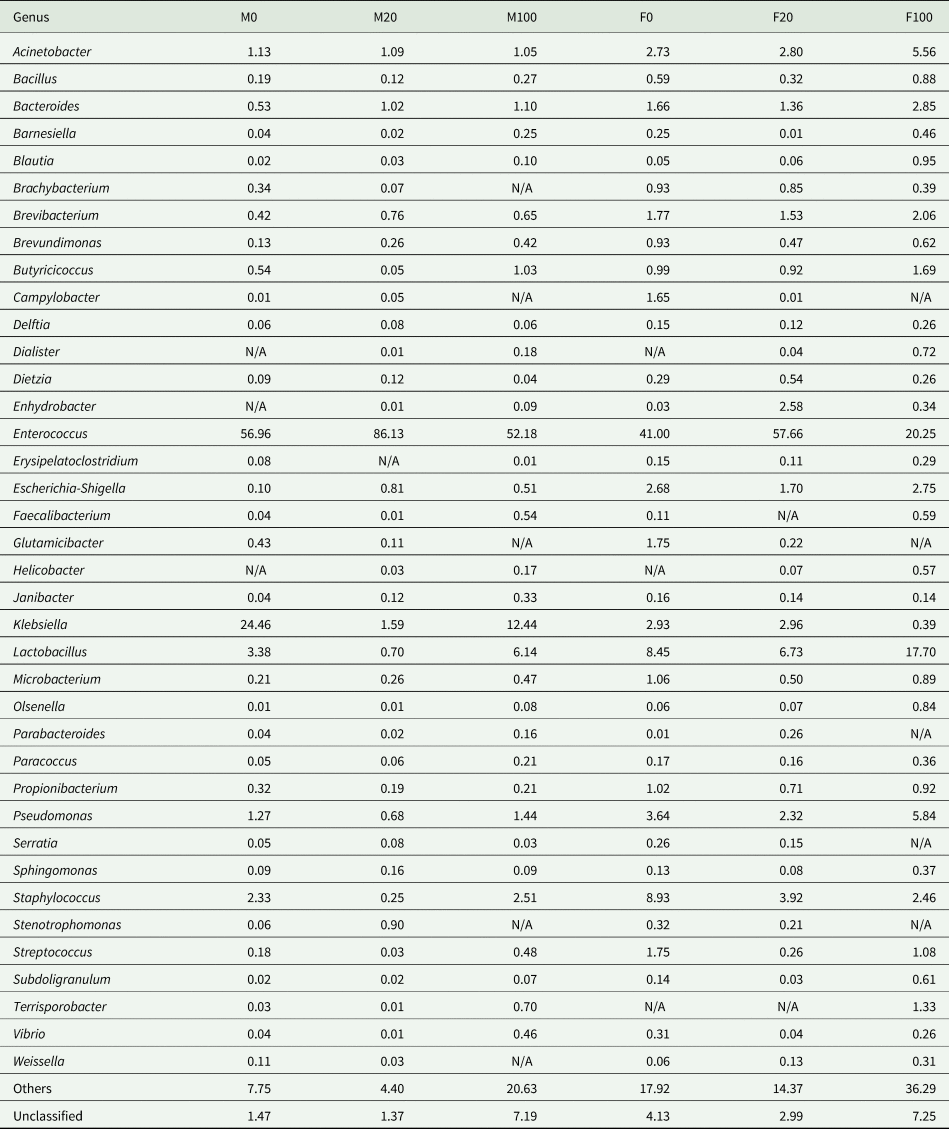
A total of 269 genera were identified in the intestinal fluid samples of all six groups. Furthermore, 148, 132, 125, 144, 141, and 138 genera were identified in the M0, M20, M100, F0, F20, and F100 groups, respectively. Fig. 6 shows the distribution of genera in samples from nanosilver-treated silkworms compared with the control group. Results showed that Enterococcus accounted for a high proportion of the bacteria in all the six groups, however, the relative abundance in the intestinal fluid was altered by nanosilver treatment. In silkworms treated with 20 mg L−1 nanosilver, the abundance of Enterococcus increased by 51.2% in males and 40.6% in females. In silkworms treated with 100 mg L−1 nanosilver, the abundance of Enterococcus decreased by 8.4% in males and 50.6% in females. For Klebsiella, 20 mg L−1 nanosilver reduced the abundance by 93.5% in males and increased by 1.0% in females, and 100 mg L−1 nanosilver decreased the abundance by 49.1% in males and 86.7% in females. Compared with the control group, the abundance of Staphylococcus was decreased by 89.3 and 56.1% in males and females treated with 20 mg L−1 nanosilver, respectively. The ratio was changed as increasing by 7.7% in males and decreasing by 72.5% in females while treated with 100 mg L−1 nanosilver. We also noticed that a part of intestinal bacteria could not be classified, and the proportion was increased in the 100 mg L−1 nanosilver treatment groups.
Variation of the bacterial genera in silkworm intestinal fluid samples. (a) The top ten genera of silkworm intestinal bacteria treated with or without nanosilver. (b) Numbers of genera in each group (relative abundance higher than 0.1%). M0, M20, and M100 represent the male silkworms treated with 0, 20, and 100 mg L−1 nanosilver, respectively. F0, F20, and F100 represent the female silkworms treated with 0, 20, and 100 mg L−1 nanosilver, respectively. Error bars indicate SEM of three independent experiments. Statistical differences: *P < 0.05.

Phylogenetic analysis of silkworm intestinal bacteria at the genus level
Phylogenetic analysis indicated that the clustering of silkworm intestinal bacteria was complicated in each group. In fig. 7, the identifiable bacteria from all the samples were clustered into four phyla include Actinobacteria, Bacteroidetes, Firmicutes, and Proteobacteria, and then divided into different classes and genera. The results also indicated that male and female groups showed very different characteristics, e.g., Actinobacteria showed more abundance in female groups. In the Proteobacteria phylum, the silkworm intestinal bacteria were subdivided into four classes, among which Alphaproteobacteria and Gammaproteobacteria showed more diversity than the rest two classes. Campylobacter was found in both the control and 20 mg L−1 nanosilver-treatment groups, but the female control group showed the highest abundance. Proteobacteria also showed more abundance in female groups, except the genus Klebsiella and Stenotrophomonas. The same trend was also observed in Bacteroidetes and Firmicutes, except for the genus Enterococcus, which was the most predominant bacterium in both genders. We have noticed that, on the one hand, nanosilver decreased the population of several bacteria, and in an extreme case, the bacterium was nearly eliminated, e.g., Brevibacillus. On the other hand, nanosilver also increased the population of several other bacteria in the host intestine, such as Blautia, Terrisporobacter, Faecalibacterium, and in extreme case, the bacterium could only be found in nanosilver treatment groups, e.g., Dialister.
Phylogenetic analysis of the silkworm intestinal bacteria at the genus level. M0, M20, and M100 represent the male silkworms treated with 0, 20, and 100 mg L−1 nanosilver, respectively. F0, F20, and F100 represent the female silkworms treated with 0, 20, and 100 mg L−1 nanosilver, respectively. The phylogenetic tree was constructed by using Megan. The pie chart at the branch represents the proportion of the bacterium in each experiment group, and the larger size represents the higher abundance.

Changes in silkworm growth and development
To assess whether the variation of silkworm intestinal bacteria consequently affects host growth and development, we have analyzed the silkworm body weight, cocooning, and survival rates. Fig. 8 shows the variation of silkworm body weight. In male groups, 20 mg L−1 nanosilver treatment significantly increased the body weight of silkworms, but 100 mg L−1 concentration of nanosilver did not show any positive or negative effects according to statistical analysis. In female groups, 20 mg L−1 nanosilver treatment showed a positive effect on silkworm body weight on day 7 in 5th instar. In contrast, 100 mg L−1 concentration of nanosilver significantly decreased the body weight of silkworms at the earlier experimental stages, but not at the final stage.
Variation of silkworm larvae body weight. (a) Average body weight of male silkworm larvae. (b) Average body weight of female silkworm larvae. M0, M20, and M100 represent the male silkworms treated with 0, 20, and 100 mg L−1 nanosilver, respectively. F0, F20, and F100 represent the female silkworms treated with 0, 20, and 100 mg L−1 nanosilver, respectively. During the silkworm growth period, the day 12 and day 15 was the 1st and 3rd day of 4th instar larva, respectively; the day 17 and day 24 was the 1st and 7th day of 5th instar larva, respectively. Error bars indicate SEM of three independent experiments. Statistical differences: *P < 0.05.

The cocooning and survival rates were also analyzed. Generally, the cocooning rate of nanosilver treatment groups was lower than that of the control groups, which showed a negative correlation with the nanosilver concentration. In the control group, The cocooning rates of female and male larvae were up to 96 and 98%, respectively. While treated with 20 mg L−1 nanosilver, the cocooning rate decreased by about 10%, and this ratio continually decreased by over 20% with 100 mg L−1 nanosilver treatment (fig. 9). Survival rates were also influenced by nanosilver treatments, however, it depended on the concentration. We found that only high concentration of nanosilver (100 mg L−1) decreased the survival rate of silkworm larvae, but 20 mg L−1 nanosilver treatment groups did not show statistic difference compared to the control group (fig. 9b).
Cocooning rate (a) and survival rate (b) of silkworm larvae treated with different concentrations of nanosilver. M0, M20, and M100 represent the male silkworms treated with 0, 20, and 100 mg L−1 nanosilver, respectively. F0, F20, and F100 represent the female silkworms treated with 0, 20, and 100 mg L−1 nanosilver, respectively. Error bars indicate SEM of three independent experiments. Statistical differences: *P < 0.05.

Discussion
In this study, we used Illumina MiSeq high-throughput sequencing technology to assess the bacterial community structure and diversity in the intestinal fluid of silkworms which treated with different concentrations of nanosilver. A total number of 17 bacterial phyla, 36 classes, and 269 genera were detected. We found that both diversity and abundance were increased in the intestinal fluid of silkworms treated with 20 mg L−1 nanosilver compared with the control group; however, bacterial diversity and abundance were decreased in silkworms treated with 100 mg L−1 nanosilver (tables 2–5 and figs 4–7). Analysis of the bacterial community structure revealed that compared with the control group, the relative abundance of Firmicutes was increased in silkworms treated with 20 mg L−1 nanosilver but decreased in the 100 mg L−1 nanosilver treatment group. A reverse trend was observed in Proteobacteria. The distributions of some predominant genera were altered by nanosilver treatment. In particular, the abundance of Enterococcus was significantly increased in the intestinal fluid of silkworms treated with 20 mg L−1 nanosilver but significantly decreased in silkworms treated with 100 mg L−1 nanosilver compared with the control group. The results indicated that nanosilver bactericide significantly changed the composition and structure of the microbial community in the gut of the silkworms.
The major bacterial phyla (>0.1%) from silkworm intestine (%)

The major bacterial classes (>0.1%) from silkworm intestine (%)

N/A represents the bacterial genus could not be detected in the experiment group.
The major bacterial genera (>0.1%) from silkworm intestine (%)

N/A represents the bacterial genus could not be detected in the experiment group.
The microbiome of insects is determined by many factors, of which gender is an important one. Previous studies have shown that there are certain differences in gut microbial communities between male and female insects (Wang et al., Reference Wang, Yao, Zheng and Zhang2014a). The numbers of gut bacteria in both male and female Bactrocera minax were similar, but the relative abundance of the dominant genus, Klebsiella, was higher in the gut of females (41.41%) than that in the males (30.52%). The relative abundance of Citrobacter was lower in the females (25.80%) than that in the males (29.41%) (Wang et al., Reference Wang, Yao, Zheng and Zhang2014a). The relative abundances of 33 bacterial families were higher in the gut of males than that in females. The differences of gut bacterial microbiota between females and males of B. mori were also reported (Sun et al., Reference Sun, Lu, Zhang, Kumar, Liu, Gong, Zhu, Zhu, Liang, Kuang, Chen, Hu, Cao, Xue and Gong2016). Although the abundances of Actinobacteria and Proteobacteria in the intestines of both male and female B. mori were very similar, the abundances of Firmicutes were higher in the males than those in females during development stages. In addition, a number of 64 and 52 unique genera were identified in the gut of female and male silkworms, respectively. The gender-related gut microbial difference might relate to different food utilization efficiencies and immunities (Sun et al., Reference Sun, Lu, Zhang, Kumar, Liu, Gong, Zhu, Zhu, Liang, Kuang, Chen, Hu, Cao, Xue and Gong2016). Our study in agreement with previous studies that there is a significant difference in intestinal bacteria community between male and female silkworm larvae, e.g. Enterococcus was higher in males than that in females. This gender-related intestinal bacterial difference was even enlarged while subjected to nanosilver treatment. For example, although both male and female silkworms maintained the same trend in the variation of intestinal Enterococcus under nanosilver treatment, the specific values remained significantly different, and the difference value in each treatment group was even enlarged (table 5). We have also noticed that in the class level or genus level, the bacterial diversity was varied in males while treated with nanosilver. A possible explanation is that (1) the difference between male and female while responding to nanosilver treatment; and (2) nanosilver treatments have shaped the silkworm intestinal microbiota composition. Considering the significant difference in bacterial sensitivity to nanosilver, the abundance of some dominant intestinal bacteria was decreased, e.g., Staphylococcus (fig. 6 and table 5), or some bacteria were even eliminated, e.g., Brevibacillus, and therefore, open the niches for other non-sensitive bacteria. In this situation, non-natural intestinal bacteria, which were ingested with mulberry leaves may occupy such specific niches, e.g., Dialister (figs 6, 7 and table 5), which would result in diversity changes.
The changes in intestinal microbiota may affect the growth and development of silkworm on some level. It has long been noticed that, in silkworms, the female generally grew faster than male, especially in 5th instar. In our study, the average body weight of silkworm larvae was almost the same at the beginning of 4th instar in control groups, but sooner at the day 1 of 5th instar, the females reached 1.3 g larva−1 and males were only 1.2 g larva−1. Similar to previous studies, our data also suggested a significant difference in intestinal microbiota between female and male silkworms. It is interesting whether intestinal bacteria contributed to the gender-related growth difference. Consequently, we noticed that the variation of intestinal microbiota may significantly affect silkworm growth. In 20 mg L−1 nanosilver treatment groups, the average body weight was higher than the control or 100 mg L−1 nanosilver treatment groups (fig. 8). A possible explanation is the abundance variation of specific bacterial genera. For example, while treated with 20 mg L−1 nanosilver, the abundance of Klebsiella decreased by 93.5% in males. A similar trend was also observed in Staphylococcus (table 5) in both male and female groups. The Klebsiella and Staphylococcus species include numbers of animal pathogens which might secret several virulence factors (Grimont et al., Reference Grimont, Grimont, Brenner, Krieg and Staley2005; Brisse et al., Reference Brisse, Grimont, Grimont, Dworkin, Falkow, Rosenberg, Schleifer and Stackebrandt2006, Reference Brisse, Fevre, Passet, Issenhuth-Jeanjean, Tournebize, Diancourt and Grimont2009; Yeh et al., Reference Yeh, Lin, Yin, Fung, Hung, Siu and Chang2010; Bannoehr and Guardabassi, Reference Bannoehr and Guardabassi2012). Therefore, the lower population of pathogenic bacterial species may beneficial for host health. In contrast, Enterococcus was significantly increased. As the well-known gut symbionts, Enterococcus species may contribute to intestinal development (Cao et al., Reference Cao, Zeng, Chen, Zhou, Zhang, Xiao and Yang2013), regulation of intestinal innate immunity and homeostasis (Huang et al., Reference Huang, Li, Huang, Cui, Yu and Rajput2012), and inhibition of enteropathogenic bacteria (Scharek et al., Reference Scharek, Guth, Reiter, Weyrauch, Taras, Schwerk, Schierack, Schmidt, Wieler and Tedin2005; Insuk et al., Reference Insuk, Keun-Tae, Gayeung, Jong-Ho and Young-Hee2018). However, the mechanisms of such bacterial genus promoted/interfered host growth or development still remained largely unknown.
Previous reports have proved that nanosilver is an environment-friendly disinfectant. Although nanosilver may also show some toxic effects to silkworms in a very high concentration, the negative effects are generally controllable. We have noticed a difference in the cocooning rate between different treatment groups (fig. 9a). Previous studies indicated that intestinal microbiota may affect host development by providing necessary proteins or molecules (Xiao et al., Reference Xiao, Joseph, Gregory and Nicolas2018). Giving the truth that in 20 mg L−1 nanosilver treatment groups, the survival rates were statistically consistent with the control groups in both male and female silkworms (fig. 9b), we considered that the difference in growth and development may be caused by varied intestinal microbiota. The high concentration of nanoparticles was reported with toxic effects on cells and animals (Xue et al., Reference Xue, Zhu, Tian, Lang and Li2008; Packia et al., Reference Packia Jacob, Finub and Narayanan2012). In this study, 100 mg L−1 nanosilver treatment significantly decreased the survival rate, which indicated that high concentration of nanosilver showed toxic effects on silkworms. In conclusion, we found that the intestinal bacterial community of silkworm larvae was significantly changed after nanosilver treatment. In addition, our research also provided a new insight that the changes of the gut microbiota, especially the abundance of some specific bacterial genus, would affect the growth and development of silkworm larvae. Despite slight side-effects, nanosilver in an appropriate concentration showed a potential application value in the sericulture industry.
Acknowledgements
This work was supported by the National modern agricultural industrial technology system construction project (CARS-18); the Technology transformation service project of cocoon and silk industry of ministry of commerce (TXJ-010-2017212) and the Fundamental Research Funds for the Central Universities (No. SWU116065).
Conflict of interest
The authors declared that they have no conflicts of interest to this work.