Introduction
Bird populations on islands generally have a higher probability of extinction compared to mainland populations due to their small size and isolation, and their increased vulnerability to natural and anthropogenic impacts (MacArthur and Wilson Reference MacArthur and Wilson1969, Whittaker Reference Whittaker1998). Relatively small avian populations on islands are vulnerable to introduced mammalian predators, newly colonising predators or brood parasites, non-native parasites and diseases, habitat destruction due to agricultural clearing and development, and loss of genetic variability due to inbreeding (Whittaker Reference Whittaker1998: 228-256, Trevino et al. Reference Trevino, Skibiel, Karels and Dobson2007, Price et al. Reference Price, Lee and Hayes2011). Populations on tropical islands are also subjected to severe hurricanes or other natural disturbances that can lead to extensive habitat destruction and high mortality in vulnerable populations (Waide Reference Waide1991a, Moreno et al. Reference Moreno, Carrascal, Delgado, Suárez and Seoane2018, Lloyd et al. Reference Lloyd, Rimmer and Salguero-Faría2019). During severe storms, hurricane-force winds can defoliate vegetation in large areas, resulting in a complete loss of all leaves, fruit, and flowers (Wauer and Wunderle Reference Wauer and Wunderle1992, Wiley and Wunderle Reference Wiley and Wunderle1993). Diminished food resources after a hurricane may have the greatest impact on bird mortality (Askins and Ewert Reference Askins and Ewert1991, Wunderle et al. Reference Wunderle, Lodge and Waide1992, Murphy et al. Reference Murphy, Cornell and Murphy1998, Rathcke Reference Rathcke2000).
The West Indian Woodpecker Melanerpes superciliaris resides in the Caribbean, a region in which hurricanes regularly occur. As many as eight subspecies have been described (Peters Reference Peters1948, Garrido Reference Garrido1966, Reference Garrido1973), but currently just five are recognized (Winkler et al. Reference Winkler, Christie and Nurney1995, Gorman Reference Gorman2014, Winkler and Christie Reference Winkler, Christie, Hoyo, Elliott, Sargatal, Christie and Juana2019). Although this species is not considered threatened because it is especially common in Cuba (BirdLife International 2012), the taxa restricted to the Bahamas Archipelago have small island populations that appear to be vulnerable. Melanerpes s. blakei occurs on Abaco and is fairly common, though some concern exists (Bracey Reference Bracey2005). The historical population on Grand Bahama, originally described as M. s. bahamensis, is believed to be extirpated (Raffaele et al. Reference Raffaele, Wiley, Garrido, Keith and Raffaele1998, White Reference White1998), with sightings in the last two decades on the eastern end of the island attributed to M. s. blakei colonising from nearby Abaco (Bracey Reference Bracey2005). The third taxon in The Bahamas, M. s. nyeanus, is confined to the small island of San Salvador (153 km2; formerly Watlings Island). Short (Reference Short1982) synonymized bahamensis and nyeanus, which most authorities have since accepted uncritically (Winkler et al. Reference Winkler, Christie and Nurney1995, Gorman Reference Gorman2014, Winkler and Christie Reference Winkler, Christie, Hoyo, Elliott, Sargatal, Christie and Juana2019). However, the population that is potentially extirpated on Grand Bahama (bahamensis) had plumage characteristics more similar to blakei than to nyeanus on San Salvador (Hayes Reference Hayes2006). The San Salvador population therefore is likely at least its own separate subspecies, and regardless of the status of the Grand Bahama population, the San Salvador population should be considered a distinct conservation unit (Green Reference Green2005) and managed accordingly.
The West Indian Woodpecker has survived on San Salvador despite the small size and isolation of the island, widespread clearing of natural vegetation, the introduction of predatory mammals, and the frequent occurrence of major hurricanes (Hall and Dougherty Reference Hall, Dougherty, Smith and Smith2003, Hayes et al. Reference Hayes, Cyril, Crutchfield, Wasilewski, Rothfus and Carter2016). On Grand Cayman, West Indian Woodpeckers are primarily found in relatively tall woodland habitats, particularly limestone, mangrove, and logwood forests (Cruz and Johnston Reference Cruz and Johnston1984). Similar tall broadleaf forest, otherwise known as tall “coppice,” that once covered much of San Salvador in The Bahamas was cleared to create agricultural plantations during the 18th and early 19th centuries (Kass Reference Kass1991, Shaklee Reference Shaklee1994, Eshbaugh and Wilson Reference Eshbaugh, Wilson, Elliot, Edwards and Godfrey1996). Agriculture gradually declined after emancipation of slaves in 1834 (Shaklee Reference Shaklee1994), and much of the island is now covered with regenerating, second-growth coppice of varying heights. San Salvador also hosts a number of invasive feral mammal species, including rats Rattus rattus, cats Felis catus, dogs Canis familiaris, cows Bos taurus, and recently domestic pigs Sus scrofa domesticus; Hall and Dougherty Reference Hall, Dougherty, Smith and Smith2003, Hayes et al. Reference Hayes, Cyril, Crutchfield, Wasilewski, Rothfus and Carter2016), all of which could affect the woodpecker population through nest depredation or habitat alteration (Townsend et al. Reference Townsend, Rimmer, Brocca, McFarland and Townsend2009, Graves Reference Graves2014). Lastly, hurricanes and tropical storms regularly pass over San Salvador Island, with at least 60–70 storms occurring in the last 150 years (Sipahioglu Reference Sipahioglu2008, Park Reference Park2012, HurricaneCity 2019). Notably, there is growing evidence for an increase in the intensity of tropical storms in the North Atlantic in recent decades (Bhatia et al. Reference Bhatia, Vecchi, Knutson, Murakami, Kossin, Dixon and Whitlock2019, Knutson et al. Reference Knutson, Camargo, Chan, Emanuel, Ho, Kossin, Mohapatra, Satoh, Sugi, Walsh and Wu2019), consistent with climate models that predict greater hurricane intensity as a result of global warming (Ercolani et al., Reference Ercolani, Muller, Collins, Savarese and Squiccimara2015, Bhatia et al. Reference Bhatia, Vecchi, Knutson, Murakami, Kossin, Dixon and Whitlock2019).
San Salvador West Indian Woodpeckers seemed frequently on the edge of extinction over the past 120 years, but have proved to be surprisingly resilient. Nye (Reference Nye1899) collected the first specimen on San Salvador in 1886 but concluded that the population might be extinct when he was unable to locate other individuals. However, a few years later, Riley (Reference Riley1903) noted woodpeckers were still common enough to cause damage to cultivated oranges Citrus x sinensis. Woodpeckers continued to be reported on San Salvador, but in 1970, the ornithologist James Bond wrote that “they had become increasingly scarce for no apparent reason” (Vogt Reference Vogt, Buechner and Buechner1970). Nonetheless, Miller (Reference Miller1978) and Miller et al. (Reference Miller, Miller and Findholt2018) estimated 100–160 pairs based on island-wide surveys and spot-mapping of territorial pairs between 1973 and 1978. In 1981 and 1982, however, Olson et al. (Reference Olson, Gregory and Hilgartner1990:10) were only able to locate two or three woodpeckers and mentioned “the species may be nearing extinction.” Woodpecker sightings continued in the 1990s (Murphy et al. Reference Murphy, Cornell and Murphy1998, White Reference White1998) and Sordahl (Reference Sordahl, Elliot, Edwards and Godfrey1996) listed it as a rare resident on a checklist of the birds of San Salvador, but Akresh and King (Reference Akresh and King2015) changed this classification to uncommon resident. Based on the reports in the last century, it remains unclear whether changes in population estimates are due to actual fluctuations in population size or to the intensity and extent of search efforts. The dense coppice scrub and rough limestone terrain make inland surveys formidable and time-consuming, so most previous observers were likely restricted to a limited number of accessible trails and roads.
We studied West Indian Woodpeckers on San Salvador over a period of two decades to assess their population status and abundance, habitat use, distribution on the island, and effects of natural disturbances. We searched for woodpeckers throughout the island between 1993 and 2018 using a variety of methods including point counts, playback surveys, and mist netting. We also conducted repeated surveys over time in the core area of the population. These data provide crucially important information on the habitat needs and current status of this vulnerable subspecies, and more broadly, help show how threatened island bird populations are influenced by natural disturbances over relatively long timespans. Because hurricanes are predicted to become more intense due to global climate change (Bhatia et al. Reference Bhatia, Vecchi, Knutson, Murakami, Kossin, Dixon and Whitlock2019), it is important that conservationists have a detailed understanding of how severe hurricanes can impact vulnerable bird populations (López-Marrero et al. Reference López-Marrero, Heartsill-Scalley, Rivera-López, Escalera-García and Echevarría-Ramos2019).
Methods
Study area
San Salvador is approximately 19 km long and 7–11 km wide, and about a third of its 15,281 ha (153 km2) is covered with saline lakes (Shaklee Reference Shaklee1994). The main habitats on the island are: 1) coastal coppice (a shrub-dominated community growing on sandy soil where the vegetation is generally 0.5–3 m tall), 2) short coppice (<3–4m tall, inland thicket on loamy soil), 3) tall coppice (4–8 m tall inland woodland on loamy soil), 4) palmetto flats (freshwater or brackish wetlands dominated by tall sabal palms Sabal palmetto and buttonwood Conocarpus erectus), 5) red mangrove Rhizophora mangle thickets, 6) disturbed/non-native vegetation, and 7) coastal rocky areas with very short vegetation (Smith Reference Smith1993, Jones et al. Reference Jones, Akresh and King2013). Notably, tall coppice has a different vegetation structure compared to shorter inland coppice and coastal coppice, with tall coppice having less vegetation between 0 and 3 m (Currie et al. Reference Currie, Wunderle, Ewert, Davis and McKenzie2005, Wunderle et al. Reference Wunderle, Currie, Helmer, Ewert, White, Ruzycki, Parresol and Kwit2010).
Climate on the island is characterised by wet and dry seasons, with the dry season usually occurring between November and April, and the wet season between May and October (Gamble and Jordan Reference Gamble, Jordan, Laurence and Gamble2006, Sealey Reference Sealey2006). Hurricanes pass through the Caribbean primarily from June to November (Park Reference Park2012). There is some evidence that the northern part of the island receives more rainfall than the central and southern parts of the island (Gamble and Jordan Reference Gamble, Jordan, Laurence and Gamble2006). Correspondingly, more fruit has been recorded in the northern part of the island compared to the southern part of the island during a dry winter (2013; Wunderle pers. comm.), perhaps as a response to precipitation, or alternatively, due to different topography, edaphic conditions, and moisture retention capacities in the northern part of the island (Wang et al. Reference Wang, Hall, Cornell and Hall2002, Wunderle et al. Reference Wunderle, Lebow, White, Currie and Ewert2014, Mylroie et al. Reference Mylroie, Ho, Infante, Kambesis and Leist2015).
The frequency of hurricanes impacting San Salvador has increased markedly during the past few decades. After a four-decade lapse following Hurricane Betsy’s 177 kph winds in 1956 (Dunn et al. Reference Dunn, Davis and Moore1956), five storms with winds >130 kph struck the island between 1996 and 2016. These included: Hurricane Bertha in July and Hurricane Lili in October 1996, with 169 and 177 kph winds, respectively; Hurricane Floyd in September 1999 with 160 kph winds; Hurricane Frances in September 2004 with 190 kph winds; and Hurricane Joaquin in October 2015 with 200 kph winds (www.hurricanecity.com). Hurricane-force winds of 119+ kph may have reached San Salvador from distant (73 km away) Hurricane Irene in August 2011, but we considered only storms with winds >130 kph, at which point severe defoliation of broadleaf vegetation usually occurs (Francis and Gillespie Reference Francis and Gillespie1993). We excluded Hurricane Floyd from analyses because we had no data on woodpecker abundance for the three years following this storm.
All major hurricanes caused extensive vegetation damage and leaf loss as a result of the hurricane-force winds, salt spray, and storm surge (Rathcke Reference Rathcke2000, Reference Rathcke2001, Parnell et al. Reference Parnell, Brommer, Dixon, Brown and Gamble2004, GRC pers. comm.). Unusually large numbers of dead birds were observed on the ground the few weeks directly after Hurricane Joaquin (GRC pers. comm.), but species and precise numbers were not documented.
Island-wide distribution surveys
We conducted both observational and directed surveys of West Indian Woodpeckers periodically during intervals between 1993 and 2018. Different researchers worked independently during different time periods, so we did not use a single survey method. However, we compensated for methodological differences in our analyses (see below).
Initial observational surveys coincided with searches for the San Salvador Rock Iguana Cyclura rileyi rileyi by WKH during 1–2 weeks each year in 1993–1995 and 1999–2003. These surveys were often in May or June, but also were done once each in March, October, and November. During searches for iguanas on trails, roads, and cays in inland lakes throughout the island, WKH noted any observations of woodpeckers, but did not make directed attempts to search for woodpeckers before 2004. These initial surveys were not incorporated into our population analyses.
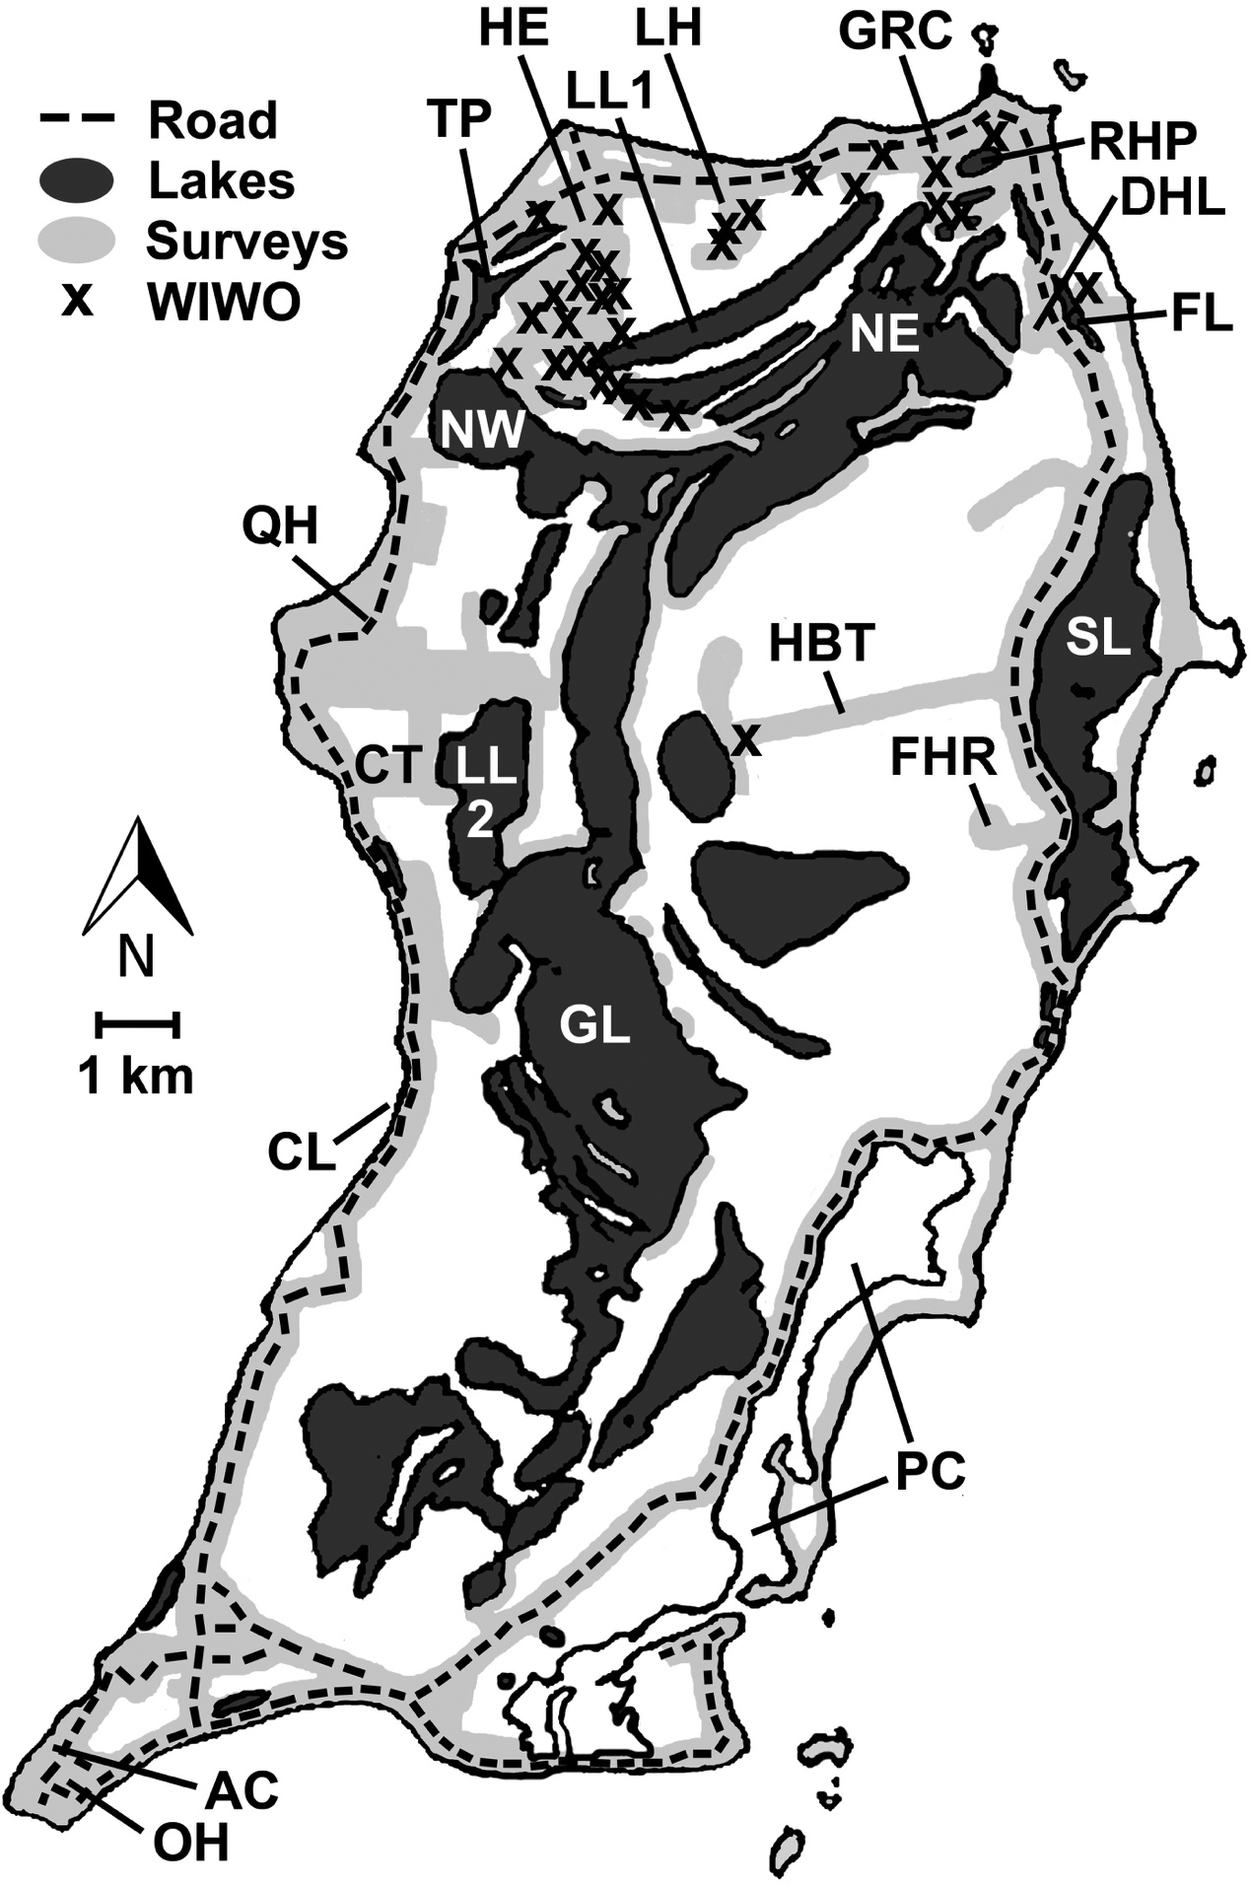
Further observational surveys by RAA, consisting of 10-minute unlimited radius, passive point counts for all bird species at points ≥200 m apart, took place late May and early June in 1996 and 1998. Point counts were conducted at numerous sites on the island. In 1996, RAA surveyed seven points in the Harbour Estates area, six points along the Reckley Hill Pond trail just south of the GRC, seven points along Queen’s Highway just west of the GRC, 17 points along the Hard Bargain Trail, and six points by the Columbus Landing (Figure 1). In 1998, all the above points were surveyed, as well as one additional point in the Harbour Estates area, another point along the Hard Bargain Trail, and one fewer point on Queen’s Highway.
West Indian Woodpecker Melanerpes superciliaris nyeanus detections and areas surveyed throughout San Salvador Island from 1993 to 2018. Map depicts areas surveyed assuming a 200 m detection distance of vocalizing birds (light grey), inland water bodies (dark grey), key landmarks and roads, and woodpecker locations (x marks). Some individuals are not depicted on this map (especially in the Harbour Estates area), given their close proximity to other detected birds. Key landmarks include AC = Altar Cave; CL = Columbus Landing; CT = Cockburn Town; DHL = Dixon Hill Lighthouse; FL = Fresh Lake; FHR = Fortune Hill Ruins; GL = Great Lake; GRC = Gerace Research Centre; HBT = Hard Bargain Trail; HE = Harbour Estates; LH = Line Hole; LL1 = Little Lake (north); LL2 = Little Lake (south); NE = Northeast Arm of Great Lake; NW = Northwest Arm of Great Lake; OH = Owl’s Hole; PC = Pigeon Creek; QH = Queen’s Highway; RHP = Reckley Hill Pond; SL = Storrs Lake; TP = Triangle Pond.

During four winters between 2012 and 2015, MEA and DIK conducted a large-scale avian study that included constant-effort mist-netting for thousands of net-hours and passive surveys for hundreds of hours, primarily at seven plots in the western and northern part of the island. For further information on these passive surveys, see Jones et al. (Reference Jones, Akresh and King2013), Akresh and King (Reference Akresh and King2015), and Akresh et al. (Reference Akresh, King and Marra2019).
In 2004, we began conducting directed surveys using playback calls along most of the roads and trails on the island, and along shores of inland lakes. These included 1–2 weeks in June or July of 2004–2006 by WKH, FEH, and PEB; 1 week in each of May 2012 and June 2013 by WKH and PEB; January through March of 2013 and 2014 by MEA; 1 week in March 2016 by WKH; 1 week in April 2016 by RAA; and 1 week in March 2018 by WKH and MEA.
During directed playback surveys, we broadcast the territorial kwir calls of either the Red-bellied Woodpecker M. carolinensis (from several sources) or the West Indian Woodpecker (from several sources), and/or chatter calls of the latter. We used several different playback systems audible to us at ≥200 m. Birds responded readily to all calls broadcast, including those of M. carolinensis as well as calls from West Indian Woodpecker subspecies on Abaco and Cuba. Responses from birds typically included their own kwir or other calls and/or aggressively flying into the playback area. We broadcast calls for up to 10 minutes while walking slowly along trails, or at stops every 100–150 m. After broadcasting a set of calls, we paused to listen and look for a response.
Along roads, we conducted playback surveys every 100–250 m in all places where potentially suitable habitat (trees >3-4 m height) existed along the main highway around the perimeter of the island (Queen’s Highway), and along smaller roads in the Cockburn Town area and the south end of the island. We did not conduct playback in clearly unsuitable habitat along these roads (e.g., open beach, lakes, sand dunes, short coastal coppice, mangroves <2 m in height, human residential areas), but drove those stretches dozens of times and marked these areas as surveyed in Figure 1. Without playback, we also walked beaches along much of the eastern side of the island (habitats largely unsuitable), surveyed by boat the east side of Pigeon Creek (repeatedly, habitat possibly suitable), and searched all offshore cays (repeatedly, habitats largely unsuitable).
In the dense vegetation of the Harbour Estates area in 2013, we recorded maximum detection distances of three individual woodpeckers giving kwir calls at 154, 157, and 236 m (the first two may have ceased calling before we reached the maximum detection distance). In 2018, we recorded a maximum detection distance of ~200 m in a similarly dense area, and we also heard an individual calling across an open area >300 m away. Based on these observations, as well as detection distances calculated for other woodpecker species in the literature (Manuwal and Carey Reference Manuwal and Carey1991, Hutto Reference Hutto2016, Matseur et al. Reference Matseur, Thompson, Dickerson, Rumble and Millspaugh2018), we conservatively assumed that we could detect birds calling within 200 m.
We documented all areas surveyed in Figure 1. Locations of observed West Indian Woodpeckers were recorded on paper maps before 2004, and thereafter using GPS. We surveyed as much of the island as feasible, including nearly all accessible roads and trails, and areas reached only by boat. Many interior parts of the island were not visited, however, because of the almost impenetrable thorny coppice that covers most of the landscape.
Local population density and distribution surveys
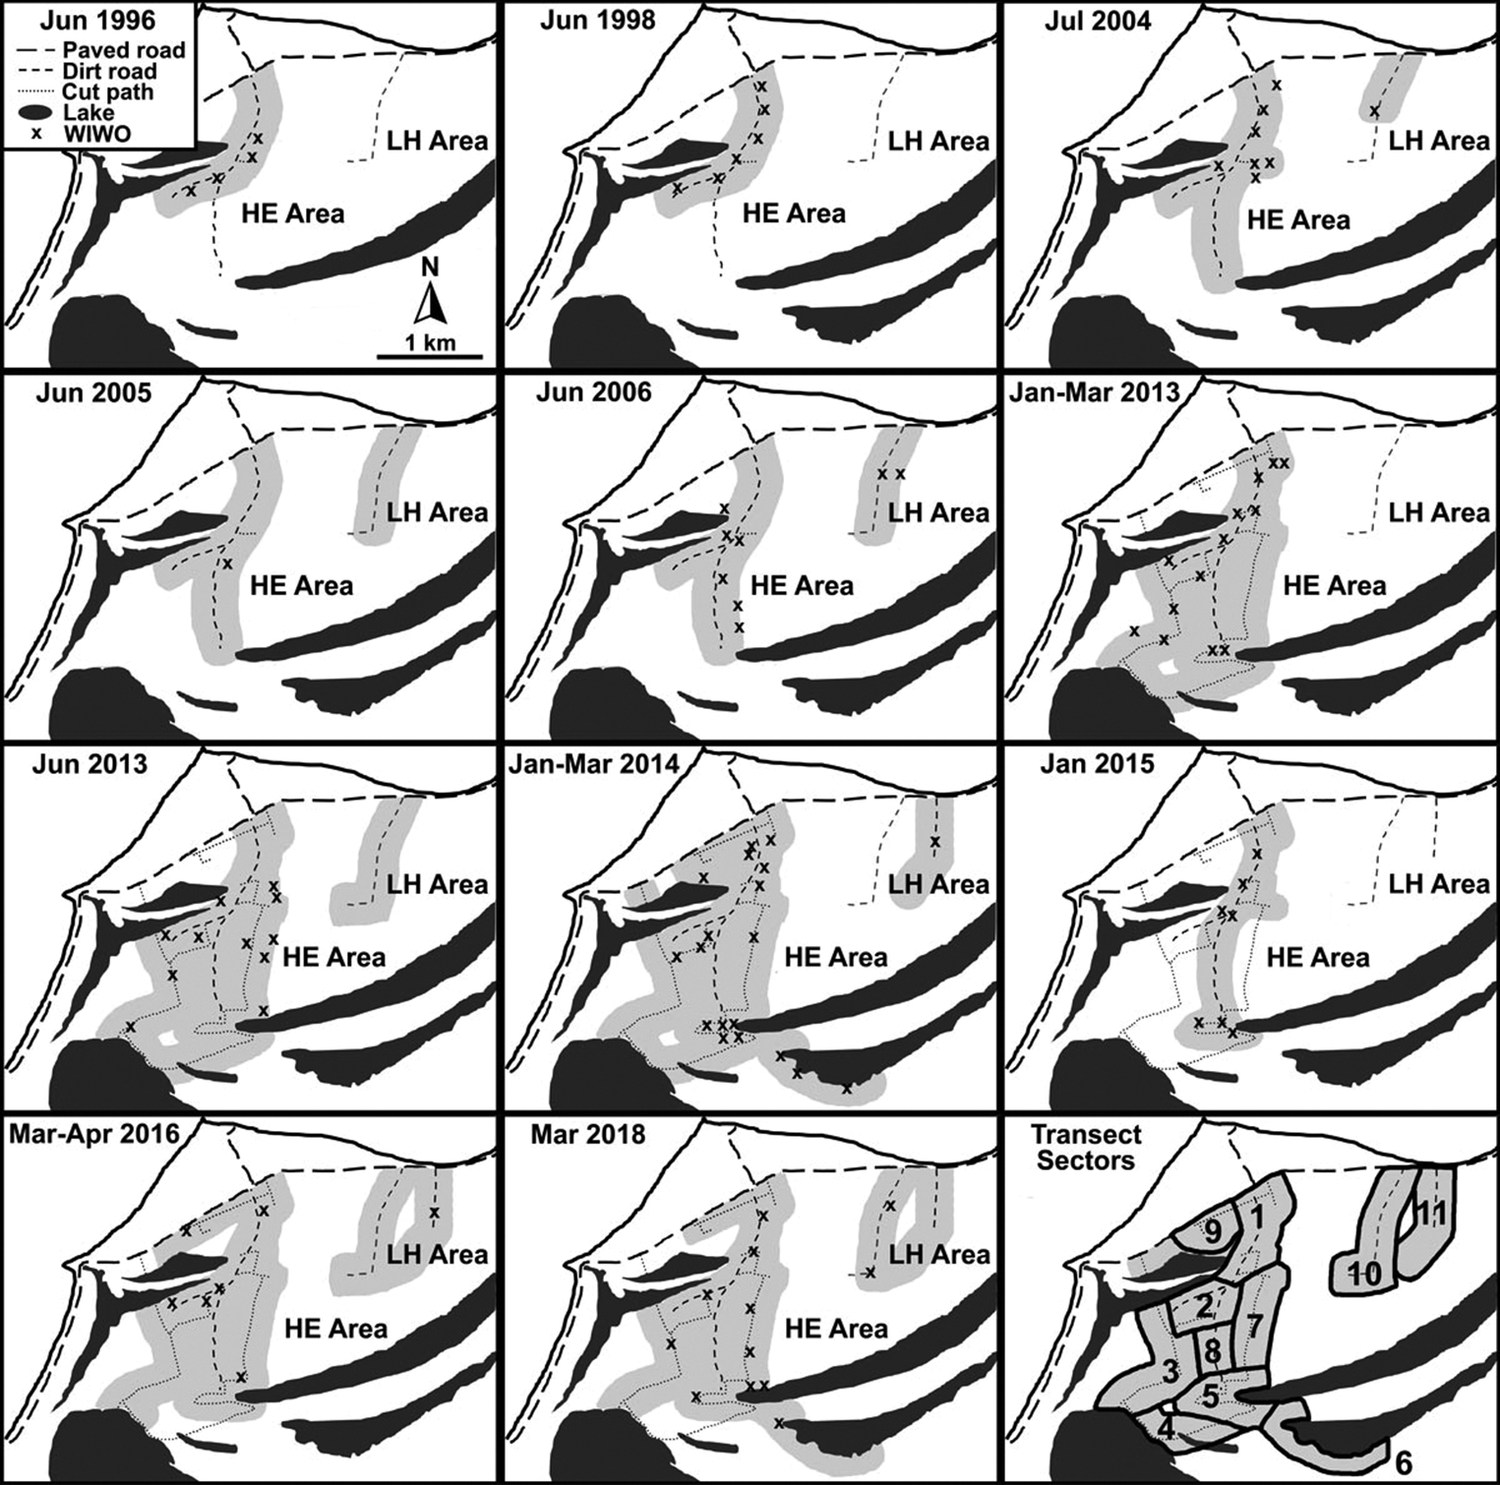
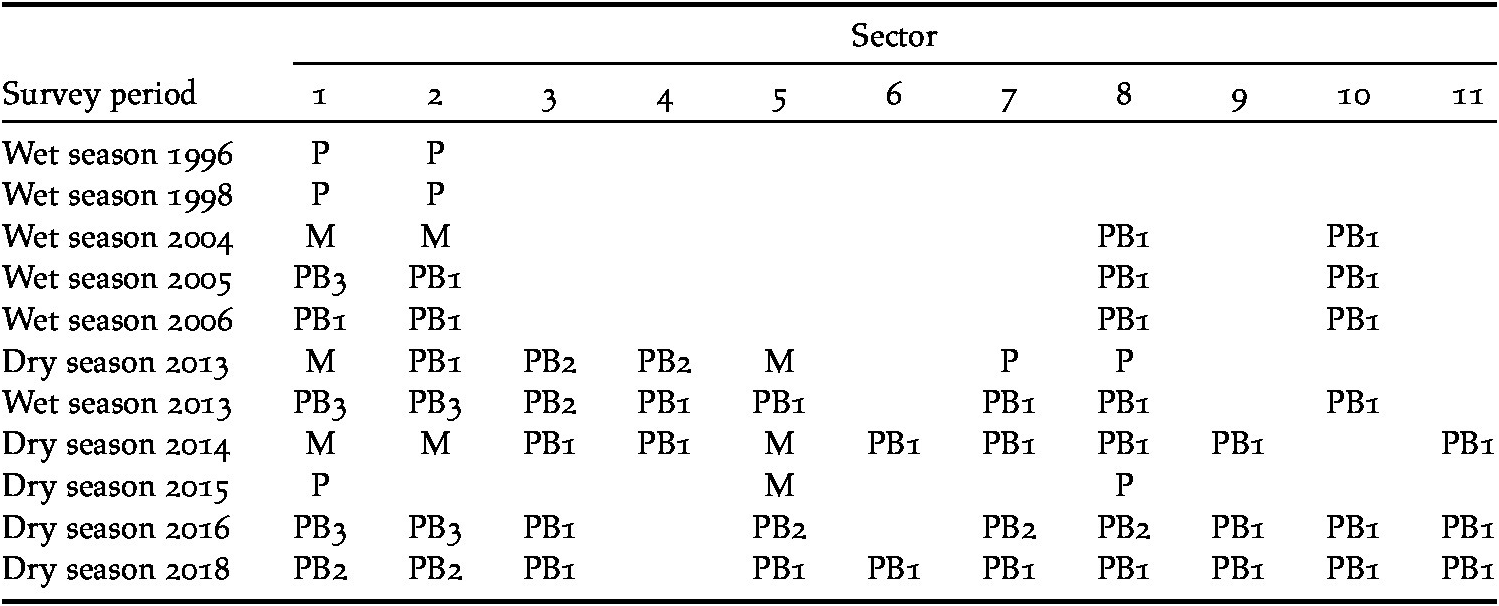
We conducted intensive repeated surveys along line transects in the Harbour Estates–Line Hole area during 1996–2018 to estimate local woodpecker population density and document the effects of hurricanes. Because surveys followed existing roads, trails, and the bulldozer cuts created in 2012, some line transects were not straight. We divided the habitat into 11 sectors (Figure 2), each of which included the area within 200 m of either side of a transect. Given that the access to certain sectors changed over time, we often surveyed only a subset of sectors in particular years. Also, survey methods and the number of repeated surveys during each year and season varied (Table 1).
West Indian Woodpecker Melanerpes superciliaris nyeanus detections in the Harbour Estates (HE) and Line Hole (LH) areas from 1996–2018. Maps depict areas surveyed (light grey), inland water bodies (dark grey), roads and bulldozer cuts, and shifting locations of woodpecker territories (x marks). The bottom right map denotes placement of the sectors.

Details for each of the 11 sectors (mapped in Figure 2) surveyed to assess the West Indian Woodpecker Melanerpes superciliaris nyeanus population in the Harbour Estates and Line Hole areas during each survey period from 1996 to 2018. Surveys were classified as: P = passive without playback; PB1 = once with playback; PB2 = twice with playback; PB3 = three or four times with playback; and M = mixed surveys, including mist-netting, playback, and/or passive (see text for details).

We assumed woodpecker territories were approximately 200 m in length and width (~3.1 ha for a circular territory), based on previous estimates (Miller et al. Reference Miller, Miller and Findholt2018: 2.8 ± 0.2 ha) and our own observations of counter-calling pairs and captures of banded birds (MEA pers. obs.). Both male and female West Indian Woodpeckers call, so we assumed that two woodpeckers heard or seen within 200 m of each other during a single visit represented a single territorial pair. If three or four birds were observed within 200 m of each other during a single survey, we assumed that there were two adjacent territories in the area. We also classified a single territory when we recorded separate detections within 200 m of each other during multiple surveys within the same survey season. Our approach assumes birds are not dispersing within seasons (Miller et al. Reference Miller, Miller and Findholt2018) and that all territories are of similar size, but it remains unknown whether the actual population conforms to these assumptions. Polyandrous females paired with multiple males (Willimont et al. Reference Willimont, Jackson and Jackson1991), or single, unpaired males, may have been observed, but we could not account for these possibilities with our survey methods. Despite these assumptions, this consistent method of defining territories allows for a general assessment of changes in relative density.
We tallied the number of woodpecker pairs (i.e. territories) observed for each sector in each season. Based on our estimate of detection distance (Hutto Reference Hutto2016), we created a 200 m buffer on either side of each transect using Google Earth (Google 2017) to quantify the surveyed area of each sector. Buffered areas for each sector ranged from 21 to 50 ha. In some seasons or years, the surveyed area varied slightly, and we adjusted the sector area accordingly. Additionally, small proportions of the 200 m buffered areas of adjacent transects overlapped slightly in some years; when this occurred, the overlapping buffered area was split between the two sectors. If a woodpecker territory was observed in an area that had overlapping transect buffers (i.e., between two sectors), then the territory was assigned to the sector closest to where the bird was observed.
Statistical analyses
We first conducted analyses on the repeated surveys in the Harbour Estates–Line Hole area to assess the effects of hurricanes on the core population. We included several different predictor variables in our statistical models. We created a categorical variable, time since hurricane, with each survey period classified as pre-hurricane (>3 years post-hurricane), 1-year post-hurricane, or 2–3 years post-hurricane. We made this categorical because previous studies (Wiley and Wunderle Reference Wiley and Wunderle1993) and exploratory analyses of our data demonstrated little difference in bird densities among years after 3-years post-hurricane. One-year post-hurricane surveys were conducted in 2005 and 2016, 2–3 years post-hurricane surveys in 1998, 2006, and 2018, and >3 years post-hurricane surveys in 1996, 2004, 2013, 2014, and 2015. Surveys were further classified as being conducted in either the dry (January-April) or early wet season (May-June). For each survey period, we also classified the survey type within each sector as (1) passive point counts or surveys along transects without playback; (2) playback transects conducted once on a single day; (3) playback transects conducted twice (on separate days); (4) playback transects conducted three or four times; or (5) a mixed category, which included surveys done with a combination of passive surveys, playback surveys, and mist-netting. In total, 74% of the 63 seasonal surveys within each sector were conducted with only playback (54% once, 13% twice, and 7% three or four times in a season), 13% were passive surveys, and 13% were “mixed” (Table 1).
We conducted a Generalized Linear Mixed Model (GLMM), with the number of woodpecker territories per sector as the response variable and the time since hurricane as the main categorical predictor variable. Our observational unit was territory abundance for each sector during each survey season. We fit the response count data to a Poisson distribution, which fit the data better than a negative binomial or zero-inflated Poisson distribution, based on Akaike’s Information Criterion (AIC) values (Burnham and Anderson Reference Burnham and Anderson1998, Gelman and Hill Reference Gelman and Hill2007). Our model included a fixed effect, categorical variable of survey type to account for potential variation in detectability given the survey type. In addition, we included a random effect of sector, because we conducted repeated visits to the same sectors over multiple years (Zuur et al. Reference Zuur, Ieno, Walker, Saveliev and Smith2009). The random effect of sector essentially accounts for variation in territory abundance among the different sectors within and among survey periods, such that any additional yearly variation observed is not a result of which sectors were surveyed in a given year. We also included an offset, the natural log of the buffered area of the sector, to account for the varying sizes of the different sectors surveyed (Akresh et al. Reference Akresh, Dinse, Foufopoulos, Schubel and Kowalczyk2009, Askins et al. Reference Askins, Folsom-O’Keefe and Hardy.2012). Our approach using territory abundance (number of birds) as the response variable, with an offset and fit to a Poisson distribution, is more robust than examining density (number of birds / ha) with a simpler linear model because in our approach, the area surveyed is accounted for when there were no birds observed (i.e. our model differentiates between observing 0 pairs/40 ha versus 0 pairs/25 ha; Zuur et al. Reference Zuur, Ieno, Walker, Saveliev and Smith2009). Overall, although different areas were surveyed during different years and various sampling methods were used, our analytical approach accounted for these factors while assessing the impact of hurricanes on the bird population. Moreover, for passive surveys, a considerable amount of time (at least 1.5 hours) was spent in each sector, making these surveys comparable to directed surveys conducted with playback. We therefore believe that any effect of hurricanes in our model is not a result of variation in our survey efforts.
We additionally tested a fixed effect of season (surveys conducted in the dry season versus wet season), but this covariate did not further explain variation in our response variable (n = 63, z = -0.34, P = 0.74) and we therefore removed it from our final model. West Indian Woodpeckers can breed between January and August (Winkler and Christie Reference Winkler, Christie, Hoyo, Elliott, Sargatal, Christie and Juana2019), and MEA observed a pair excavating a nest cavity in late March 2013, but most birds may nest in the wet season between May to August on San Salvador (Miller et al. Reference Miller, Miller and Findholt2018). In 2013, when surveys were conducted in both seasons, detected abundance was similar between seasons. Although we conducted surveys during 1996–2013 in the wet season, and surveys during 2013–2018 in the dry season, these findings indicate that season was not an important factor in explaining detected woodpecker abundance.
We were also interested in determining if there was any long-term trend in the population from 1996-2018. We conducted a second GLMM analysis with the same response and predictor variables as above to account for survey effort as well as population fluctuations due to hurricanes, but additionally included a continuous variable of year in the model. We standardised the variable of year to a mean of 0 and a SD of 1, to assist with model convergence (Bates et al. Reference Bates, Maechler, Bolker and Walker2015). We were unable to include interactions between year and survey type due to data limitations and model convergence issues. For all our mixed models, we used the ‘lme4’ and ‘lmerTest’ packages (Bates et al. Reference Bates, Maechler, Bolker and Walker2015, Kuznetsova et al. Reference Kuznetsova, Brockhoff and Christensen2016) within the statistical program R version 3.4.3 (R Core Team 2017).
Lastly, we wanted to estimate the size of the entire island population before and after hurricanes. Based on our island-wide surveys, we first quantified the area where woodpeckers were regularly observed on the island. We defined this area as the terrestrial area east of Triangle Pond (Akresh and King Reference Akresh and King2015), north of Great Lake, and north and west of the southern tip of Fresh Lake (Miller et al. Reference Miller, Miller and Findholt2018). We also added 5 ha of suitable habitat at the western end of Hard Bargain Trail, given that one territory was observed in that area over several years (Figure 1). We rounded up to the nearest 100 ha because of some uncertainty in the exact distribution of woodpeckers on the island. Our population size estimates may be conservative because we were unable to survey the entirety of the interior of the island, and we assumed that there are no other large areas occupied by the woodpeckers. Alternatively, our population size estimates could be biased high because we assumed that the entire northern area had a similar, relatively high density as found in the core population in the Harbour Estates–Line Hole area (see computations below).
We examined two separate methods to assess the population size during two different periods: pre-hurricane (defined in this analysis as >1-year post-hurricane) and 1-year post hurricane. We computed multiple estimates for population size because we wanted to accurately reflect the uncertainty of our data, and further explore the effects of hurricanes on the population. We first estimated the population size before a hurricane, using raw detected densities that were not predicted from a model. To estimate the mean total population size on the island during pre-hurricane years, we took the average density per sector in the Harbour Estates–Line Hole area during years before hurricanes (>1-year post-hurricane), and multiplied that value with the total area of suitable woodpecker habitat. We also computed a confidence interval of the mean population size, by calculating the detected mean density per sector ± 1.96*SE, and then multiplying those lower and upper confidence values with the total suitable area. We were also interested in estimating a population size 1-year after a hurricane, and thus also calculated a mean and 95% confidence intervals (CIs) for the total population size 1-year post hurricane using the same approach as above, but using densities detected during the 1-year post hurricane surveys (2005 and 2016).
In a separate, but similar, approach in estimating population size before and after hurricanes, we used predicted woodpecker densities in the Harbour Estates–Line Hole area from a GLMM to compute population size estimates. To predict woodpecker densities in this area while accounting for survey type, we conducted a GLMM analysis with the same offset, random effect, and response variable as explained for our previous GLMM analyses, but we now classified the categorical predictor variable of hurricane in two levels: 1-year post hurricane or >1-year post-hurricane. As before, we included a covariate of survey type in the model to account for differences in detected densities among survey types. Because survey type is an additional categorical variable in the model, one must define a specific survey type when predicting woodpecker densities pre- and post-hurricanes. From the model output, we calculated predicted densities based on the number of woodpeckers that would have been observed if all seasonal surveys were playback transects conducted three or four times. Confidence intervals were computed from predicted means and SEs from the model. We then multiplied the previously computed area of suitable woodpecker habitat with our predicted densities to calculate total population sizes. This approach, using densities predicted from the GLMM, should account for some degree of detectability when computing the total population size because we had more detections of woodpeckers when we conducted playback transect surveys three or four times. However, we note that the model predicts densities based on this specific survey type, but only 7% of our total surveys at only two sectors were conducted with three or four playback surveys, and thus there is some extrapolation inherent in the predicted densities of the model. We therefore present population estimates from both raw detected densities and predicted densities to highlight the uncertainty in our estimates.
Results
Island-wide distribution
We searched for woodpeckers throughout the island (Figure 1), but because of difficulty accessing interior regions, we were unable to survey large areas far from roads, trails, or shores of inland lakes. Nevertheless, all our woodpecker detections were on the north end of the island despite substantial playback surveys and point counts in most of the suitable habitats in the middle and southern portions of the island.
The densest cluster of observations occurred in the Harbour Estates and Line Hole areas on the north-west portion of the island, which were the areas we most intensively surveyed. Woodpeckers were also detected intermittently in the north-east, although these north-eastern areas were not surveyed as consistently as the north-western areas (Figure 1; see also next section). Although we did not survey the entire northern area between Triangle Pond and the GRC, the habitat (tall coppice interspersed with sabal palms; Figure 3) is likely to be similar to the areas we did survey based on geological mapping and examination of aerial photos (Mylroie and Carew Reference Mylroie and Carew1995, Mylroie et al. Reference Mylroie, Ho, Infante, Kambesis and Leist2015, Google 2017), and we expect that woodpeckers occupy unsurveyed areas within this northern section of the island. Despite extensive playback conducted during multiple years in potentially suitable habitat south-west of the Lighthouse, along the road north of Storrs Lake, along Hard Bargain Trail, at the western end of Hard Bargain Trail, in the vicinity of the Fortune Hill Ruins, and along much of the eastern shore of Great Lake and its northeast arm, we found just one pair at the western end of Hard Bargain Trail in 2004, 2014, and 2018 (but not detected in 1996, 1998, 2006, and 2013; Figure 1).
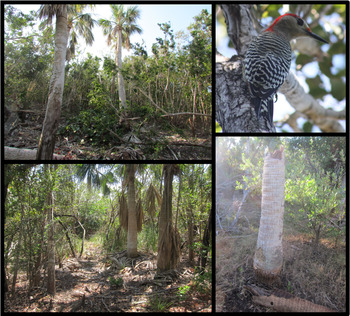
Bottom and top left images: tall coppice and sabal palms Sabal palmetto, which are typical habitat for West Indian Woodpeckers on San Salvador. Top right: San Salvador West Indian Woodpecker. Bottom right: A dead sabal palm, with an old nesting cavity, partially destroyed by Hurricane Joaquin.

Changes in population density
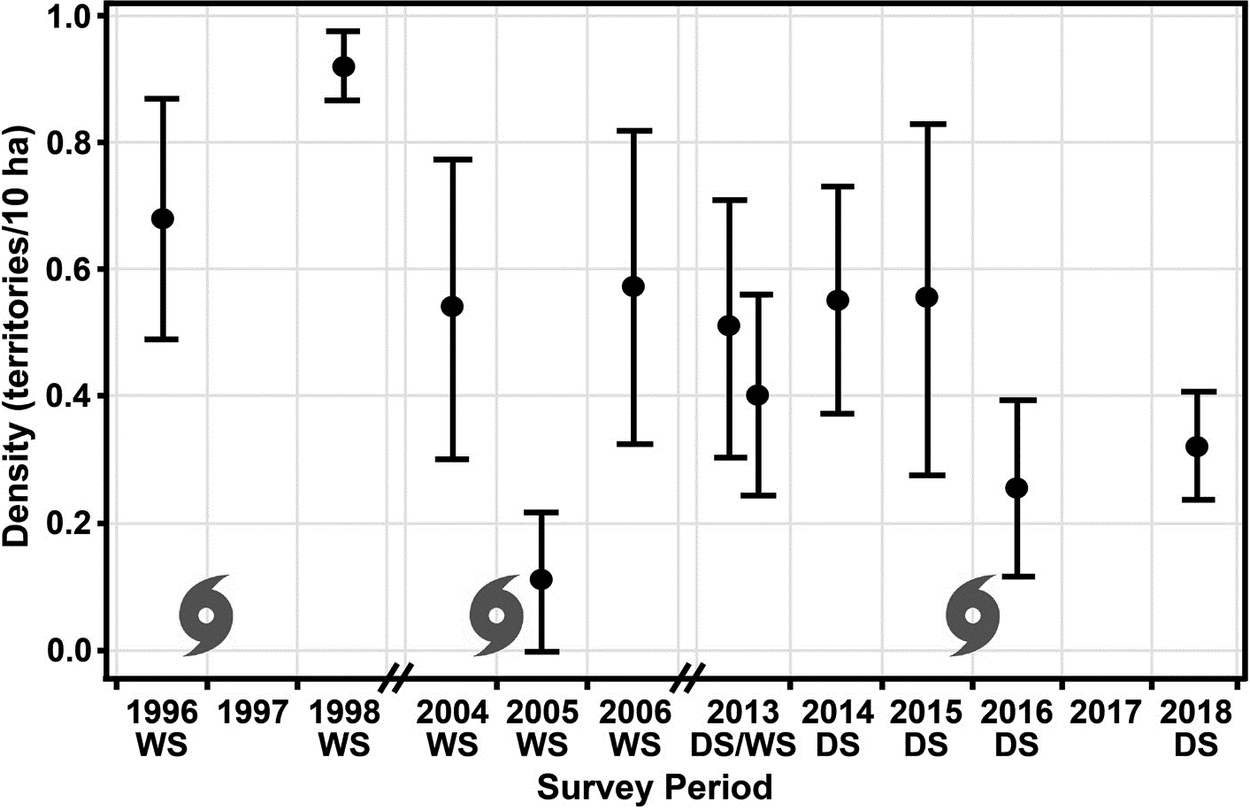
Population densities in the Harbour Estates and Line Hole area fluctuated throughout the 22-year study period (Figures 2 and 4). Both among sectors and among years, there was variation in observed territory densities per sector, with densities ranging from a minimum of 0 territories per 10 ha to a maximum of 1.35 territories per 10 ha (sector 5 in 2014).
Detected densities of woodpecker territories (mean ± 1 S.E. per sector) among survey periods in the Harbour Estates and Line Hole areas from 1996 to 2018. The circular symbols indicate hurricanes Bertha and Lili (occurring in 1996; 169 and 177 kph winds, respectively), Frances (2004; 190 kph), and Joaquin (2015; 200 kph) between survey periods. Densities were calculated per sector within a given survey period and do not account for variation due to the survey method in this figure. The double notches on the x-axis denote gaps in our survey efforts. WS = Wet Season; DS = Dry Season.

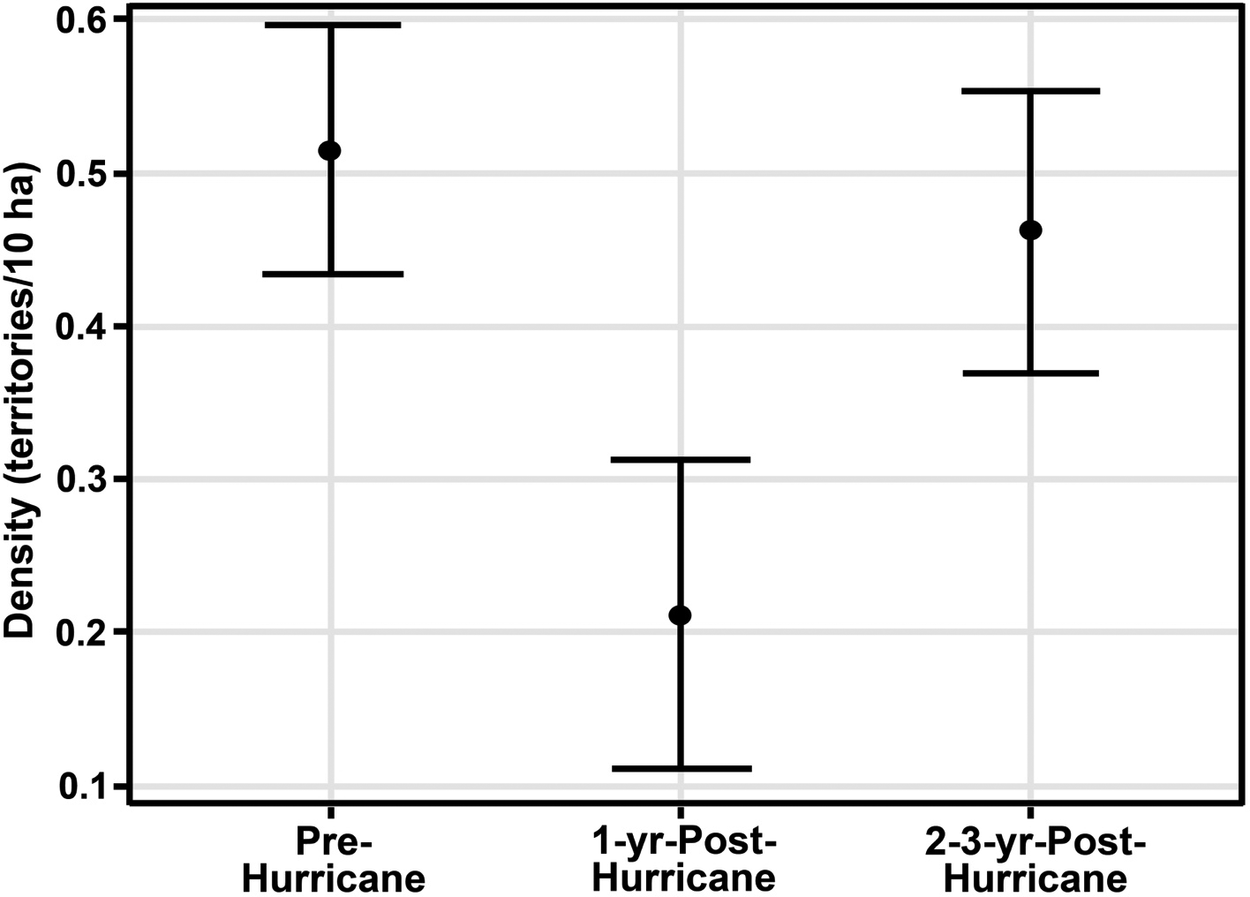
Accounting for survey effort, there was a significant negative effect of hurricanes on observed population density, with lower woodpecker densities 1-year post-hurricane compared to densities pre-hurricane (n = 63, z = -2.13, P = 0.03, Figure 5). Population densities appeared to rebound sometime after 1 year, as 2–3-year post-hurricane densities were significantly higher compared to 1-year post-hurricane densities (z = 3.02, P = 0.003). Survey type significantly affected density estimates; mixed surveys with mist-netting had higher densities than passive surveys (z = -2.25, P = 0.02), playback surveys conducted once (z = -4.45, P < 0.001), and playback surveys conducted twice (z = -2.60, P = 0.009). Also, playback surveys conducted three or four times had higher densities than playback surveys done once (z~= -2.68, P = 0.007). Other pairwise comparisons among survey types were not significant (all P > 0.05).
Detected densities of woodpecker territories (mean ± 1 S.E. per sector) pre-hurricane (n = 5 years), 1-year post-hurricane (n = 2 years), and 2–3-years post-hurricane (n = 3 years) in the Harbour Estates and Line Hole areas from 1996 to 2018.

The continuous effect of year was not significant (z = -0.86, P = 0.39) in a model that included year of survey, the hurricane categorical variable, and survey effort, indicating no long-term population trend independent of the effects from hurricanes.
Population size
We calculated an approximate area of 1,400 ha used by West Indian Woodpecker on the island. Excluding the post-hurricane years 2005 and 2016, the mean detected density per sector for all the other years was 0.50 (CI = 0.38–0.62) territories per 10 ha. Therefore, based on the average detected density and the woodpecker distribution on the island, the population size estimate was 70 (CI = 53–87) pairs, or 140 (CI = 106–174) individuals before hurricanes, without correcting for detectability in our surveys. One year after severe hurricanes, the mean detected density per transect was 0.21 (CI = 0.02–0.41) territories per 10 ha. As a result, without correcting for detectability, the total population size declines to 29 (CI = 3–57) pairs, or 58 (CI = 6–104) individuals after a hurricane. This represents a 59% loss of the population following a hurricane.
We also computed population sizes based on a model that accounted for survey type; predicted densities were calculated as if all surveys were playback transects conducted three or four times. Excluding the post-hurricane years 2005 and 2016, predicted density was 0.85 (CI = 0.24–1.46) territories per 10 ha. Based on the predicted density and woodpecker distribution, the population size estimates were 119 (CI = 34–204) pairs, or 238 (CI = 68-408) individuals. One year after severe hurricanes, the predicted density was 0.30 (CI = 0.05-0.55) territories per 10 ha, and the predicted population size declined to 42 (CI = 7–77) pairs, or 84 (CI = 14–154) individuals. Using these model predictions, there was a 65% loss of the population following a hurricane.
Discussion
Changes in density following major hurricanes
Our study is one of the first to examine the effects of hurricanes on a bird population during a period of over 20 years. Major declines in density of West Indian Woodpeckers in both 2005 and 2016 were probably the result of severe hurricanes. In the year following these two storms, woodpeckers may have (1) suffered a substantial population decline, (2) shifted their distribution elsewhere on the island, or (3) been less responsive to call playback. A population decline seems like the most likely explanation for our results. A similar pattern apparently occurred on the island of Abaco, where previously common and conspicuous West Indian Woodpeckers virtually disappeared after two major hurricanes hit the island in 2004 (Bracey Reference Bracey2005). Although Wunderle et al. (Reference Wunderle, Lodge and Waide1992) found circumstantial evidence for shifts of bird populations from montane to lowland habitats following a major hurricane in Jamaica, we did not detect woodpeckers dispersing to other habitats on San Salvador after a major hurricane. Six months after Hurricane Joaquin, we searched for woodpeckers using playback surveys in nearly all accessible areas during March and April 2016, including along the shores of the southern Little Lake and Great Lake, but we recorded woodpeckers only in their usual habitat at the northern end of the island. Additionally, there was no evidence that detectability of woodpeckers changed after storms; when certain sectors were visited several times in 2016, woodpeckers consistently responded to playback by calling and/or approaching.
Numerous studies have shown that some species of birds are particularly vulnerable to the direct and indirect effects of severe cyclonic storms (Wiley and Wunderle Reference Wiley and Wunderle1993, Johnson and Winker Reference Johnson and Winker2010, Lloyd et al. Reference Lloyd, Rimmer and Salguero-Faría2019). Species that depend on nectar or fruit are particularly vulnerable because leaves, flowers, and fruit are stripped away by hurricane-force winds, and plants do not tend to produce flowers and fruit during the subsequent few months while they are replacing their leaves (Askins and Ewert Reference Askins and Ewert1991, Waide Reference Waide1991a, Wauer and Wunderle Reference Wauer and Wunderle1992, Wunderle et al. Reference Wunderle, Lodge and Waide1992, Rathcke Reference Rathcke2000, Reference Rathcke2001, Foster et al. Reference Foster, Tweed, Camp, Woodworth, Adler and Telfer2004). In contrast to nectar and fruit, insect populations tend to recover more quickly, so insectivorous birds generally do not show major declines (Askins and Ewert Reference Askins and Ewert1991, Waide Reference Waide1991a, Wauer and Wunderle Reference Wauer and Wunderle1992, Murphy et al. Reference Murphy, Cornell and Murphy1998). West Indian Woodpeckers feed on fruit, insects, and occasionally other food resources (Riley Reference Riley1903, Winkler et al. Reference Winkler, Christie and Nurney1995, Dalsgaard et al. Reference Dalsgaard, Baquero, Rahbek, Olesen and Wiley2016, Miller et al. Reference Miller, Miller and Findholt2018). On Grand Cayman, 44% of their diet consists of small fruit; the rest of their diet consists of insects gleaned or probed from bark and bromeliads, as well as some small vertebrates (Johnston Reference Johnston1975, Cruz and Johnston Reference Cruz and Johnston1984). In Cuba, 50–60% of the food items brought by West Indian Woodpecker parents to their nestlings consisted of fruits 5–10 mm in diameter (Kirkconnell Reference Kirkconnell2000). The decline of the San Salvador population following major hurricanes suggests that the woodpeckers cannot obtain sufficient resources in the absence of fruit, though some may perish during the storm itself.
Members of the genus Melanerpes in Caribbean Basin forests appear to be more impacted by major hurricanes passing over small islands than by hurricanes passing over large islands or the mainland. The Golden-fronted Woodpecker Melanerpes aurifrons in Belize (Lynch Reference Lynch1991), Puerto Rican Woodpecker Melanerpes portoricensis in Puerto Rico (Waide Reference Waide1991b, Lloyd et al. Reference Lloyd, Rimmer and Salguero-Faría2019), and Jamaican Woodpecker Melanerpes radiolatus in Jamaica (Wunderle et al. Reference Wunderle, Lodge and Waide1992) did not decline after severe hurricanes. In contrast, on the small island of Basse-Terre, Guadeloupe Woodpeckers Melanerpes herminieri showed a substantial decline four months after a hurricane (Haney et al. Reference Haney, Wunderle and Arendt1991), and the West Indian Woodpecker declined on both San Salvador and Abaco after storms (Bracey Reference Bracey2005, this study). Populations on small islands may be more vulnerable because changes in food supply may occur throughout an entire island, whereas birds on larger islands can more readily move to an area less affected by the hurricane (Wunderle et al. Reference Wunderle, Lodge and Waide1992, Wunderle Reference Wunderle1995). Additionally, storm surges can contaminate sources of freshwater with salt on small, low-lying islands. After Hurricane Floyd hit Abaco in 1999, West Indian Woodpeckers became regular visitors to hummingbird feeders during the post-hurricane period (Bracey Reference Bracey2005). The lack of freshwater and fruit might be especially detrimental following hurricanes on the low-lying islands of the Bahamas (Serventy Reference Serventy, Farner and King1971, Currie et al. Reference Currie, Wunderle, Freid, Ewert and Lodge2019).
Species that nest and roost in tree cavities are also susceptible to substantial declines following hurricanes (Snyder et al. Reference Snyder, Wiley and Kepler1987, Hooper et al. Reference Hooper, Watson and Escano1990). After a hurricane in the southeastern United States, Red-cockaded Woodpeckers Picoides borealis may have been killed when roosting-cavity trees broke off at or near the roost cavity (Hooper et al. Reference Hooper, Watson and Escano1990). On San Salvador, West Indian Woodpeckers primarily nest in dead sabal palms (Miller et al. Reference Miller, Miller and Findholt2018 and our observations), but we do not know if woodpeckers take shelter in these cavities during storms. Nonetheless, we observed that most (but not all; Figure 3) of the dead sabal palms with nesting cavities survived Hurricane Joaquin’s 200 kph winds without major damage.
Lack of evidence for baseline population changes over the last 50 years
The baseline, pre-hurricane West Indian Woodpecker population size did not appear to change drastically since the 1970s. During the 1970s, Miller et al. (Reference Miller, Miller and Findholt2018) estimated 100–160 territorial pairs of woodpeckers on San Salvador based on surveys along roads and trails in the same region of tall coppice and sabal palms at the northern end of the island where we found woodpeckers. Their calculations for population size are not entirely clear, but Miller et al. (Reference Miller, Miller and Findholt2018) noted that their estimates were based on the average territory size and assumed that either 50% or 100%, respectively, of the northern area was occupied with territories. In contrast, our estimates were derived from average densities, not territory size. To obtain comparable population size estimates, we calculated density for the 1970s from data presented by Miller et al. (Reference Miller, Miller and Findholt2018). They recorded 40 territories in a 400-ha study area, yielding a density of 1 territory per 10 ha. Using the same suitable area that we used (1,400 ha), this yields a density-based population estimate of 140 pairs for the Miller et al. (Reference Miller, Miller and Findholt2018) study. The estimate of 140 pairs for the 1970s is similar to our model-based estimate of 119 pairs, and within our confidence interval (34–204 pairs). We therefore suspect that the baseline woodpecker population size has not changed substantially since the 1970s.
We observed no lasting downward trend between 1996 and 2018. After population declines were detected directly after Hurricane Frances in 2004, the birds increased back to pre-hurricane densities by 2006. Additionally, after the hurricanes in 1996 (which had slightly lower wind speeds than in 2004), the birds were at pre-hurricane density levels in 1998, but unfortunately, we did not survey the population in 1997 to confirm any post-hurricane decline. After Hurricane Joaquin, the detected density in 2018 did not appear to completely rebound to pre-hurricane levels; however, this could have been partially due to reduced survey effort in some sectors in 2018. On Abaco, after severe hurricanes in 2004, West Indian Woodpeckers similarly recovered from a population decline (Bracey Reference Bracey2005) and were widely distributed on the island between 2009 and 2018 (see sightings map for these years on eBird.org; their status in 2019 is uncertain after Abaco was hit by category five Hurricane Dorian). Perhaps increased reproductive productivity during the breeding season after a hurricane allows for rapid population regrowth (Varty Reference Varty1991, Wiley and Wunderle Reference Wiley and Wunderle1993). West Indian Woodpecker pairs may be able to produce double broods (Kirkconnell Reference Kirkconnell2000, Miller et al. Reference Miller, Miller and Findholt2018), suggesting the capacity to increase productivity. Individual nests contain up to 5–6 nestlings (Raffaele et al. Reference Raffaele, Wiley, Garrido, Keith and Raffaele1998, Kirkconnell Reference Kirkconnell2000, Miller et al. Reference Miller, Miller and Findholt2018), so a combination of single and double brood production, even in a reduced number of territories, could result in rapid recovery of a reduced population. Furthermore, if male territorial owners die after a hurricane, and their territories are thus unoccupied and in prime habitat, these territories could theoretically be quickly filled by “floater” or younger individuals that previously were unable to secure a territory for breeding (Cooper et al. Reference Cooper, Murphy, Redmond and Dolan2009, Akresh et al. Reference Akresh, King and Brooks2015).
Other factors may be impacting the woodpecker population on San Salvador, but perhaps not as drastically as hurricanes. Rats occur throughout the island (Hall and Dougherty Reference Hall, Dougherty, Smith and Smith2003, Hayes et al. Reference Hayes, Cyril, Crutchfield, Wasilewski, Rothfus and Carter2016), and we have observed feral pigs, cattle, and a cat in the Harbour Estates area. However, the woodpecker population appears to have remained stable since the 1970s, and has rebounded quickly after hurricanes, so we suspect invasive mammals are not greatly influencing the population’s reproductive success. The native Pearly-eyed Thrasher Margarops fuscatus, a potential nest predator which can also aggressively compete for nest cavities and food resources (Snyder et al. Reference Snyder, Wiley and Kepler1987, Arendt Reference Arendt and Schulenberg2020, MEA and WKH pers. obs.), is one of the more common species in the same habitat (MEA, RAA, and WKH unpubl. data) and might be limiting the woodpecker population (Olson et al. Reference Olson, Gregory and Hilgartner1990).
Distribution and habitat use on San Salvador
West Indian Woodpeckers were concentrated in the northern end of the island where relatively tall coppice is adjacent to sabal palm groves, large buttonwood trees, and tall red mangroves. We suspect that both tall coppice and sabal palms are needed to provide suitable habitat (Cruz and Johnson Reference Cruz and Johnston1984, Miller et al. Reference Miller, Miller and Findholt2018). All the old woodpecker nesting cavities and active nests were in dead palm trees, as noted by other studies (Miller Reference Miller1978, Kirkconnell Reference Kirkconnell2000). Although much of the habitat along the Hard Bargain Trail consists of taller coppice (>4 m; Murphy et al. Reference Murphy, Pierce, Shoen, Murphy, Campbell and Hamilton2001), most of this area lacks sabal palms (Smith Reference Smith1993). Despite numerous searches, woodpeckers were detected only at the very western end of the Hard Bargain Trail, where patches of sabal palms are present. Even though sabal palm groves occur in a number of other surveyed locations where woodpeckers were absent, most of these other locations do not have tall coppice. Large buttonwood trees and tall coppice could be preferred foraging habitat and provide bark-dwelling insects and fruit, as well as allowing for easier movement underneath a taller, less structurally dense canopy.
Although most individuals have only been detected in the northern part of San Salvador since the 1970s (Miller et al. Reference Miller, Miller and Findholt2018), potentially much more of the island was occupied by woodpeckers before the agricultural clearing of forests that occurred in the 1800–1900s. Historical accounts suggest that most of the island was covered with taller coppice, such as large mahogany trees Swietenia mahagoni, and thus all areas on the island with sabal palms may have supported other areas of suitable habitat in the past (Eshbaugh and Wilson Reference Eshbaugh, Wilson, Elliot, Edwards and Godfrey1996). After the decline in agriculture on the island, San Salvador’s rocky and sandy soils have prevented a complete re-growth of taller, mature coppice (e.g. >6 m) (Eshbaugh and Wilson Reference Eshbaugh, Wilson, Elliot, Edwards and Godfrey1996). Preliminary analysis of precipitation on San Salvador indicates the northern region may receive more rainfall than other sites on the island (Gamble and Jordan Reference Gamble, Jordan, Laurence and Gamble2006). Additionally, the topography and geology of the Harbour Estates area may allow for wetter, less-saline soils (Mylroie et al. Reference Mylroie, Ho, Infante, Kambesis and Leist2015). As a result, a quicker and taller regeneration of the vegetation after the agricultural period may have occurred in the northern area (Sealey Reference Sealey2006), providing suitable woodpecker habitat.
Other observations of West Indian Woodpeckers on San Salvador in locations not detected by our surveys include a bird collected by Cockburn Town (Riley Reference Riley1903), a male seen at Alter Cave (ebird.org, K. and N. Andersen pers. comm.), and birds recorded at Owl’s Hole and Fortune Hill (White Reference White1998; Figure 1). Nonetheless, we surveyed these locations repeatedly with playback and failed to detect any woodpeckers. These areas may have been used historically and are occasionally occupied by dispersing birds but are currently not used by sizeable numbers of individuals (Olson et al. Reference Olson, Gregory and Hilgartner1990). Besides habitat preference, another possible cause for the lack of large groups of individuals outside of the northern core population is conspecific attraction (Ward and Schlossberg Reference Ward and Schlossberg2004). West Indian Woodpeckers may be less inclined to use isolated, but suitable, habitat on the island in areas that only support 1–2 territories (Burgess et al. Reference Burgess, Roulston and Shaw1982).
Conclusions
Based on the International Union for Conservation of Nature’s (IUCN) Red List criteria (IUCN 2012), we believe M. s. nyeanus should be listed as a ‘Critically Endangered’ subspecies because its extent of occurrence is <100 km2, it occurs in only one location (San Salvador), and it has shown extreme population fluctuations. The population remains vulnerable to catastrophic storms and further habitat loss and may be impacted by other potential threats such as introduced nest predators, disease, and inbreeding depression. We estimate that the entire population size may be well under 300 individuals (Miller et al. Reference Miller, Miller and Findholt2018), and that it declines in years following severe hurricanes to fewer than 50–150 individuals. However, we made several assumptions when computing our population size estimates and our confidence intervals were large; thus, more research assessing the population size is needed.
We strongly recommend the preservation of the taller coppice, sabal palms, and mangroves in the northern part of the island, between Triangle Pond and the GRC. This northern, wetter area supports the only known core population of M. s. nyeanus, and also provides high-quality habitat for migratory songbirds of conservation concern, such as Kirtland’s Warbler Setophaga kirtlandii and Prairie Warbler Setophaga discolor, and other threatened resident species, such as Key West Quail Dove Geotrygon chrysia and White-crowned Pigeon Patagioenas leucocephala (Sullivan et al. Reference Sullivan, Wood, Iliff, Bonney, Fink and Kelling2009, Jones et al. Reference Jones, Akresh and King2013, Akresh et al. Reference Akresh, King and Marra2019). Some development has occurred in the northern area during the last few years. Although the northern area is privately owned, we hope that any plans for future developments consider the endangered woodpecker population.
We also recommend continued monitoring of the Harbour Estates population, and further surveys throughout the island to derive a more accurate population estimate. Alternatively, genetic analysis could assess the effective population size on the island (Luikart et al. Reference Luikart, Ryman, Tallmon, Schwartz and Allendorf2010) and could also address potential concerns of inbreeding. More information on nest site selection and success is needed. West Indian Woodpeckers nest in wooden utility poles on Abaco, Cuba, and Grand Cayman (WKH pers. obs.), and some on Abaco have used nest boxes (M. Wilson pers. comm., https://rollingharbour.com). Despite ample utility poles on San Salvador, woodpeckers do not use them for nesting. If San Salvador woodpeckers could be induced to use these alternative nest sites, the population might expand into tall coppice areas that lack sabal palms.
Overall, intensity of cyclonic tropical storms is predicted to increase in the Caribbean as a result of climate change and increasing sea surface temperature (Sobel et al. Reference Sobel, Camargo, Hall, Lee, Tippett and Wing2016, Bhatia et al. Reference Bhatia, Vecchi, Knutson, Murakami, Kossin, Dixon and Whitlock2019). For small, threatened bird populations on islands, such as the San Salvador West Indian Woodpecker, extremely intense and long-lasting hurricanes (e.g. Hurricane Dorian in 2019), or multiple severe hurricanes that pass over an island in successive years, may be especially detrimental (Raffaele Reference Raffaele1977, Wiley and Wunderle Reference Wiley and Wunderle1993, Hayes et al. Reference Hayes, Barry, McKenzie and Barry2004). Our study provides a glimpse of how climate change, interacting with existing threats such as habitat loss and invasive species, could lead to the extinction of an at-risk bird species, and highlights the complexity in conserving threatened wildlife species in the future.
Acknowledgements
We thank the numerous field technicians that helped with this study and the corresponding large-scale avian study on San Salvador, including E. Armstrong, K. Beaman, H. Buleje, B. Carnes, E. Cook, T. Duclos, K. Erbas-White, R. Escobar, M. Fiola, M. Fuirst, B. Hayes, T. Hulsey, T. Jones, S. Kemphers, B. Kramer, A. Moss, A. Muse, K. Peiman, P. Roberts, Z. Smith, and K. Yang. We appreciate the Gerace Research Centre, especially K. Buchan, T. Dexter, T. Rothfus, and V. Voegeli, for providing helpful support and logistics on San Salvador Island. Funding was provided by Loma Linda University; the U.S. Forest Service, Northern Research Station; the Walt Disney Company Foundation’s Disney Conservation Program; Connecticut College; and out-of-pocket expenses.