

Introduction
Globalization is all about world regions being in touch with each other. Although this might seem to be a mere truism, the simple statement’s avail lies in clearly identifying two of the global historian’s foremost objects of study: global connections and interactions. Waves of globalization therefore are nothing but the creation of new connections between hitherto isolated regions or the intensification of existing links, while de-globalization – taking place, for instance, in the interwar period of the twentieth century – is the consequence (or indeed the act) of diminishing contact and exchange. The reasons for both intensification and decrease are manifold and can relate to political, economic, social or cultural factors. Periods of intensification, however, often also go along with technological advances in transport and/or communication which render the negotiation of large distances easier. Such advances may come in two categories: as increases in quantity or as thorough changes in quality. In the nineteenth century, the invention and diffusion of the railway is an example for the former. Ever bigger loads of goods and higher numbers of passengers could now be transported across England and the industrializing world. Both speed and capacity of the railways outperformed horse carts and coaches, but apart from that the physical nature of transport changed but little. The invention and spread of electric telegraphy on the other hand belongs to the latter category. It marks one of the rare moments when technological progress impacts not only on capacities and speed, but also on the very nature of a process – in our case of telecommunication.
Connections are established by movements – either of people (migration), goods (trade) or information (communication). Although these three elements often move together (the merchant caravan providing one of the more picturesque examples), their impact on sending and receiving countries is mostly studied separately. The study of migration and migratory movements has long been a central concern of historians who employ a global perspective.Footnote 1 And the study of supra-regional, intercontinental and finally global trade and trade patterns has also seen a good deal of scholarly attention.Footnote 2 The role of information movement, however, has received little recognition by global historians so far.Footnote 3 This can partly be explained by the fact that for the better part of human history, information generally moved with people. The diffusion of inventions, ideas or intelligence has received some scholarly thought,Footnote 4 but has generally been closely attached to the study of migration or trade. The flow of information comes as an unavoidable by-product of the flow of people and material goods and is often studied accordingly.
Especially for the period before the nineteenth century, this approach certainly holds much value, but does not allow for the dynamics of information flow itself. Even at the time when migrants and traders served as the main vehicles of information movement, communication obeyed its own rationale and did not stick strictly to the routes, speed or intentions of its carriers. At times, it outpaced its conveyors or lagged behind. Contents and meanings might change while in transit. Sometimes the spread of information (or knowledge as a processed form of information) would peter out for no obvious reason; other bits and pieces would spread like wildfire. All this is to say that even at a time when information moved with and through people and goods, its movement, reception and impact deserve separate attention and some detachment from the study of migration and trade.Footnote 5 With the technological developments of the late eighteenth and then the nineteenth century, however, such separate treatment becomes a necessity. The advent of telecommunication detached the flow of information from the movement of people. This marks a watershed in the history of globalization, because it created a new, virtual space in which established distances and limitations of time were suspended. The quality of global communication was completely altered by its dematerialization.
But what exactly are the qualitative changes ushered in by the dematerialization of telecommunication and how are these connected to patterns of global interaction? The emergence and early spread of electric telegraphy – first domestically and then internationally – falls into a time of constantly intensifying global trade links and an increasing volume of international trade. The industrial revolution provided the industrializing countries in Europe and North America with new transport technologies. Iron-clad and steam-driven ships started to ply inland waterways and coastal areas in the 1820s and subsequently conquered the high seas. On land, the expansion of the railway network significantly cut transport costs. In his excellent study on the acceleration of international communication between 1820 and 1870, Yrjö Kaukiainen has convincingly argued that – together with other factors – these technological advances have significantly reduced communication times between world regions during his period of observation. In purely quantitative terms, the ‘shrinking of the world’ in this pre-telegraphic period is even more pronounced than the advances made through the spread of global telegraphy in later years as Kaukiainen aptly demonstrates.Footnote 6
Highly significant as these early increases in transmission speed certainly are, they do lack one essential quality that comes only with the detachment of information transmission from transport. ‘[Information] moved along with the cargo, and though not usually bulky, its speed was limited to that of the fastest mode of travel of the day.’Footnote 7 Therefore, before the emergence of a global telegraph network, information could not outpace railways or steamships. For instance, merchant houses had no means to control their ships or provide them with up-to-date market information once they had left the home port. Birgitte Holten as well as Byron Lew and Bruce Cater have recently drawn our attention to the qualitative changes in global trade and trade patterns brought about by international telegraphy. Holten compares three examples of trade transactions between European or North American merchant houses and Brazilian coffee exporters as to their organization and efficiency. She shows that before South America was telegraphically linked with the rest of the world, trade transactions depended on pre-arranged instructions. For the merchant houses it was impossible to react flexibly on changing conditions. The second transaction discussed by Holten took place in 1874, shortly before South America was directly connected to the global telegraph network but with well-developed domestic networks in place in Europe and North America. Although the headquarters’ control over their ships had improved only marginally compared to the earlier example, it becomes clear that general information on world markets and business conduct was significantly more widely available and easier to access. The final example from 1893 – with a reasonably tight global telegraph network up and running – clearly highlights how international business methods had changed during the period of observation. Market information was exchanged by telegraph and readily available at both ends of the transaction. Coffee orders were handled more promptly and more flexibly, thereby making the trade significantly more cost-effective.Footnote 8
Byron Lew and Bruce Cater have tried to quantitatively assess the impact of this qualitative transformation of global trade methods so aptly described by Birgitte Holten. In a recent article they show that the global spread of telegraphy – and with it the change in shipping co-ordination – has had a highly stimulating impact on the growth of world trade between 1870 and 1910. With the help of refined quantitative methods they prove the close connection between the telegraphic development of a region and its position in global trade. In a counterfactual analysis, Lew and Cater argue that international trade in the year 1870 would have been twice as voluminous as it actually was, had the telegraphic network of that year already had the dimensions of the year 1910.Footnote 9 While, at least to my understanding, the historical validity of such calculations still stands on somewhat disputable ground (despite the sophisticated statistical methods involved), it is nevertheless convincingly argued that domestic as well as international telegraphic development intensified global trade links and transformed established trade patterns in the second half of the nineteenth century.
Global connectivity became a key factor in determining a country’s or a region’s position in international trade during that time. Therefore, if we want to fully understand the global trade patterns and structures, we have to be aware of the distribution of global communication centres and peripheries in the nineteenth and early twentieth century. It is the central aim of this essay to contribute to an identification of such centres and peripheries. After a definition of the terms ‘dematerialization’ and ‘telecommunication’, which I deem necessary in order to exactly frame the subject of study, the article provides a short introduction to the technical history of telegraphy. In the following sections, quantitative data on the growth of domestic telegraph networks in European and non-European countries will be presented and interpreted. This data will confirm that – together with North America – Europe undoubtedly stood at the centre of the global telecommunication network. With the help of Social Network Analysis methods, I will then take a closer look at the European network and try to pin down the significantly different positions that individual cities and regions occupied in this network. Hopefully, I will be able to show that even within a telegraphically relatively well developed world region like Europe, global connectivity was very unevenly distributed and came in a number of different grades and qualities. While an ideal network analysis would draw on data from the entire global telecommunication network, this is unfortunately not possible due to the scarcity of data on telegraph circuits outside the so-called Western world. Therefore, the network analysis is limited to European data, but I will make reference to its position in and connectivity with the global network wherever possible.
Defining dematerialization
I have repeatedly been made aware of the various terminological and semantic difficulties arising from the use of the word ‘dematerialization’. Neither from a purely philosophical nor from a natural scientific viewpoint is the use of the term sufficiently exact as it implies the complete escape from the realm of matter as such. This, however, is not how the word will be used here. Neither does it refer to the philosophical concept of materialism, nor does it want to withstand scrutiny from post-Newtonian physicists. I use the term for the very reasons for which we still employ Newtonian physical laws and calculations in everyday life: because it is exact and yet simple enough to describe what happened to information transmission from the viewpoint of a social historian. What exactly has changed in the way we send and receive messages and how did this impact on societies? Dematerialization is exact and complex enough to provide a number of valuable clues in this direction. It stands for the translation of information into acoustic, optical or – most importantly – electric impulses instead of using tangible (i.e. material) carriers. That telegraph lines, for instance, are quite tangible, too, does not oppose this definition as the line (or the cable) itself, once put in place, does not move in order to convey a message but merely provides the path along which information travels. In this respect the telegraph line is to communication what roads or railway tracks are to transport: not the message, only the medium.Footnote 10
Technically, dematerialization merely frees information transmission from a number of (Newtonian) physical constraints from which all material movement suffers. Dematerialized information does not have a mass (if we ignore the infinitesimal mass of moving electrons for now). It is thus not limited by physical inertia (whereas technological inertia is yet another matter, as will be seen below). Some sorts of non-material communication know other limitations. The spoken or shouted word only reaches so far. Leaving aside fibre optics, optical communication depends on a clear line of sight. Electric current needs a wire and encounters electrical resistance. Yet, all these limitations follow rationales different from those faced by moving matter.
The earliest and still essential forms of communication between humans were non-material: sounds, signs, and speech. Later, both the visual and the verbal forms of information sharing became materialized and developed, for instance, into painting and eventually script.Footnote 11 The transmission of reasonably complex information over larger stretches of time (storage) and space depended on such materialization.Footnote 12 Ancient means of dematerialized distance communication – such as fire beacons, drums or smoke signals – were inflexible and suitable for simple, prearranged messages only. While pioneering the principle of dematerialization, they existed in a narrow niche and cannot be considered an alternative to material distance communication.
Only the invention and diffusion of telecommunication technologies in the late eighteenth and early nineteenth century finally rendered the dematerialization of complex long-distance communication possible and completely changed its nature. By detaching communication from transport, a virtual space was created that adhered to a set of alternative physical and psychological rules. I have argued and illustrated elsewhere that in this virtual information space the relation between time and space is distorted.Footnote 13 Complex messages based on flexible code systems negotiated large distances with the use of very little time and energy. While their relation was still proportional, the ratio between the covered distance and the duration of the transmission had shifted enormously. Telecommunication had freed itself from the speed limits of material transport.
Telecommunication
The word ‘telecommunication’ was coined by Edouard Estaunié (1862–1942) in his Traité pratique de télécommunication electrique published in the year 1904. Putting the Greek tele for ‘distant’ in front of ‘communication’, the term, in the literal sense of the word, means the exchange of information over a great distance. Estaunié himself had a narrower meaning in mind. To him telecommunication depended on electric transmission and encompassed telegraphy, telephony and wireless telegraphy only. For the purpose of this essay, however, the use of electricity as a carrier should not be the defining feature of telecommunication. Instead, the dematerialization of the transmitted information must be seen as the distinguishing marker. In the nineteenth century converting messages to electric impulses was only one – albeit a widespread and important – method to achieve this and formed the technological basis of electric telegraphy and later of telephony. The birth of telecommunication, however, had but little to do with electricity. In the last decade of the eighteenth century, the Frenchman Claude Chappe invented the system of optical telegraphy. Although later it could not compete with its electric successor, optical telegraphy successfully detached long-distance communication from transportation for the first time.
This essay, however, is mainly concerned with electric telegraphy – the only telecommunication technology of global relevance in the nineteenth century. Although optical telegraphy pioneered the idea of communication dematerialization, the system has never been adapted beyond national level due to technical limitations. Likewise telephony – still in its infancy in the late nineteenth century – was not yet advanced enough to negotiate distances larger than a few hundred kilometres. Electric telegraphy, on the other hand, proved to be useful for international communication very soon after its initial introduction. The first international connection was established between the United States and Canada in the year 1846. England and France were linked up by submarine cable only five years later. Telegraph cables soon criss-crossed the Mediterranean and began to connect continents. The transatlantic cables and the imperial cables to India testify to the rapid global expansion of the telegraph network since the 1850s.
This comes as no surprise. Whether a new technology manages to spread and to be widely adopted mostly depends on the demand situation and therefore on the advantages it offers compared to the next best alternative. In the case of national or regional telegraphic networks, the long lack of public demand came to an end in the 1830s when railway expansion created the need for fast and reliable communication to co-ordinate trains. Once in place, the telegraph was quickly used for business, press or private messages as well. Demand for international and intercontinental telegraphic connections came both from national and imperial administrations as well as from the business sector. Here the next best alternative – postal communication via steamer – was so much slower than a telegraphic message that the advantages of electric communication needed little explanation. The potential gain in efficiency brought about by telecommunication clearly grows with the distance between the communicating parties. Therefore, telegraphy did ‘go global’ as soon as early technical problems with insulation and signal transmission had been solved. British administrators welcomed the new ‘tool of Empire’Footnote 14 as a means to bring their far-flung colonies nearer to the metropolis. European merchant houses finally had an instrument to direct their vessels once they had left European harboursFootnote 15 – a situation similar to the demand for telegraphic communication created by railway expansion.
Telegraphy: invention and innovation
Before we take a look at the spread of telegraphic communication in national contexts in the nineteenth century and then start to examine the structure of the European telegraph network in more detail, I will briefly outline the technological development behind early electric telegraphy. While the process of technical invention might be of only limited interest for the global historian, it does set the stage for the following phase of innovation and early diffusion of the technology. And here the influence of technological inertiaFootnote 16 and the importance of public demand become clearly visible – an understanding of which forms the basis for our later explorations.
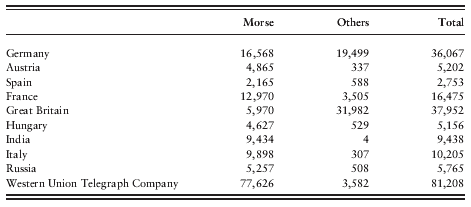
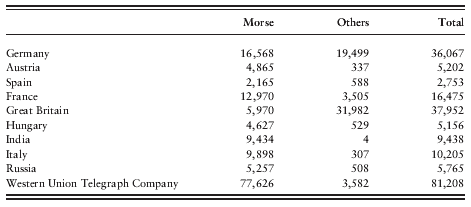
In popular culture the invention of telegraphy is usually attributed to the American artist and engineer Samuel Morse. The reasons for this ascription are manifold and range from the superior capacity of the telegraphic code system that Morse co-invented via Morse’s successfully patent policy to the cultural hegemony of the United States in the twentieth century which has helped popularize the idea of the ingenious American inventor. Beyond doubt, Morse’s telegraph and code system – to which other inventors have significantly contributed as well – proved to be the most efficient, flexible and easy to handle over the decades. In the year 1900, for instance, most member states of the International Telegraph Union primarily used Morse’s telegraphs. As can be seen in Table 1, Germany and Great Britain are the only bigger states where the Morse system had encountered serious resistance from local competitors.
Telegraph equipment in selected countries, 1900.
Source: Bureau International des Administrations Télégraphiques, Statistique Générale de la Télégraphie dressée d’après des Documents Officiels, Année 1900, Berne: Bureau International des Administrations Télégraphiques, 1902.
In the early days of telegraphy, however, Samuel Morse was only one of many inventors concerned with developing electric telecommunication. The earliest proposal for such an outcome had been made as early as 1753 by an anonymous author in The Scots Magazine. The article suggested the construction of an apparatus with one wire for each letter of the alphabet running from sender to receiver. When the sender charged a wire, electrostatic attraction would move a piece of paper with the corresponding letter on it. While somewhat impracticable, the proposed system would certainly have worked. The same can be said for the telegraphic devices developed by Samuel Thomas Soemmering (1809) and Francis Ronalds (1816). Ronalds’s design had been influenced by Claude Chappe’s optical tachygraphe and employed moving pointers. The British Admiralty, however, showed no interest whatsoever in the new technology and informed Ronalds that the existing system of optical communication between London and the principal ports was absolutely sufficient. In short, there was no official or public demand for such an expensive (at least in initial costs) and untested technology.
The telegraphic devices of Paul Shilling von Canstatt (1832), Carl Friedrich Gauss and Wilhelm Eduard Weber (1833) and Karl August Steinheil (1835) all suffered similar fates, although they were all in a working order. Up to now only tentative suggestions have been made as to why exactly these designs all failed to proliferate. Gauss, Weber and Steinheil worked within the territory of today’s Germany. Split up in a multitude of principalities during the first half of the nineteenth century, this might indeed not have been the ideal testing ground for a centralizing and integrating technology like the telegraph. Working for the Tsar, von Canstatt, however, should have encountered many incentives to carry on his work and put the telegraph into practice in Russia. More research into the factors preventing an adoption of the telegraph in these early years will be necessary to fully understand the reasons why some designs failed and others did not.
While the reasons for many of the failures still remain unclear, the cause behind the first successful use and diffusion of telegraphy is comparatively well researched. In Great Britain, Charles Wheatstone and William Fothergill Cooke worked on electric telegraphy as a classic engineer-entrepreneur pair. Wheatstone perfected the mechanism and Cooke found a suitable test application. Their telegraph was first installed and successfully tested between Euston and Camden Town stations on the London and Birmingham Railway. Although the telegraph worked absolutely satisfactorily and facilitated the co-ordination of line traffic, the railway company chose not to adopt the new technology. Jeffrey Kieve cites the Guide to the London and Birmingham Railway 1840 as stating on the matter: ‘Electricity was thought of as a quicker signal agent and some successful experiments were tried with it, but experience has proved that the whistle is more advantageous and suitable at every respect.’Footnote 17 It took Cooke another two years to convince Great Western Railways to test and adopt the technology between their stations in West Drayton and Paddington. The connection went online in 1839 and marks the inauguration of the world’s first non-experimental telegraph line.Footnote 18 Although only modestly used, it demonstrated for the first time the potentially profitable symbiosis between railway and telegraph companies. For the railway companies, the telegraph provided the only means to co-ordinate their trains and to thereby use a single track in both directions. For the prospective telegraph companies, the railways’ right-of-way was of great appeal. Aware of this potential mutual benefit, Cooke eventually talked Great Western Railways into allowing him to expand the existing line from West Drayton to Slough with all expenses payable out of his own pocket. When the line was completed in 1843, Cooke opened it for public commercial use, while the railway company was allowed to use it free of charge.Footnote 19
Although the benefits of erecting telegraph lines along their tracks had been quite obvious to the railway companies from the late 1830s onwards, the high costs involved had deterred many of them. Now that telegraphy had proved to be potentially profitable in its own right as well, the companies’ reluctance was quickly overcome. In many cases external investors could be attracted, in other cases the railway companies themselves chose to run the telegraph operations. After 1843 the technology spread so quickly that, with 3,600 kilometres, almost a third of England’s railway network had been equipped with telegraph lines by 1850.Footnote 20 Apart from the railway companies’ demand for swift communication, two other circumstances contributed to the rapid spread of telegraphy. First, the press soon realized the potential telegraphy held for the provision of accurate and up-to-date news. In England, the first press telegram was sent from Windsor Castle to London announcing the birth of Prince Alfred. Second, the spectacular capture of the murderer John Tawell, made possible by rapid telegraphic communication, provided excellent publicity for the new technology.Footnote 21
In the United States, the first press telegram had been sent even a couple of months before that, in late 1844. Samuel Morse had publicly demonstrated a working telegraph in 1837, filed a caveat and applied for Congress funding of a proper test line. Thanks to the early successes of Messrs Cooke and Wheatstone in Great Britain, Congress eventually agreed to fund a telegraphic connection between Washington and Baltimore. In the year 1844, the line was inaugurated with the now-famous sentence ‘What hath God wrought?’. After a one-year test period Congress did not anticipate much profit and gave the line back into private responsibility.Footnote 22 It was this act of privatization that triggered an investment boom in telegraphy. Within the next ten years about 50,000 kilometres of telegraph wire were put up in the United States, connecting practically all major settlements in the eastern part of the country. Just like in the United Kingdom, railway companies became one major carrier of the technology while the sheer size of the country provided an extra incentive for telegraph expansion. In 1850, twenty private telegraph companies competed in the United States, but it was the Western Union Telegraph Company that would eventually emerge as the quasi-monopolist in telegraphic matters.Footnote 23
Communication centres and peripheries
Little more than a decade ago, the sociologist Manuel Castells coined the term network society and explained its rationale in a seminal three-volume publication known as the Information Age trilogy.Footnote 24 To Castells it is one of the distinguishing features of a network that it has no centre – and thus no periphery.Footnote 25 To a certain extent this might be true. No node is absolutely essential to the network. Should one node fail, the network will reconfigure itself and bypass the gap with the help of other nodes.Footnote 26 However, this is not to say that all nodes in a network are of the same importance or, as Castells puts forward, share the same degree of centrality. Centrality here is not a geographic term but relates to the flow of information in a network – which, after all, is the essential purpose of a network. Since the 1970s, Social Network Analysis (briefly introduced later in this paper) has aptly demonstrated that some nodes are indeed more important for the efficient functioning of the network and that they are closer to the actual information flow. Our own analysis will confirm this.
Therefore, it seems absolutely reasonable to assume that global telecommunication networks (as all other networks of a similar structure) do have centres and peripheries, i.e. certain nodes that are closer and other nodes that are further from the information flow. But where is the benefit in clearly identifying such nodes with the help of quantitative methods? Is it not evident that regions such as Great Britain or New England in the United States were communication centres, while other regions outside the ‘West’ formed the periphery? In short, is it not reasonable to assume that the centrality pattern of the global communication network resembles an underlying socioeconomic pattern about which we already know much? From a general perspective this is probably true, but our analysis will provide a more refined picture and will, as shall be seen, produce some interesting results. In the end, this essay seeks to identify suitable cases (of countries or cities) for later comparative studies that will try to establish how centrality in global communication impacted on local development. If we merely compare the obvious centres and peripheries, the insights generated by such a comparison will be limited and distorted by a variety of other contributing factors. However, if we succeed in identifying comparable pairs that differ only in individual categories and aspects, a comparison will hopefully leave us with accurate and concise findings as to the potential impact of global connectivity on local development.
From its very onset telegraphy developed at two different levels. On the one hand it spread along railway tracks and roads and brought the remoter regions of a country into contact with the administrative centre. Centres of industry were connected with financial centres, new territories were opened up and hitherto peripheral regions were brought under closer central control. In short, telegraphic expansion here served the purpose of national integration and centralization. For reasons outlined above, railway companies played a crucial role in weaving such national telegraph networks as did many other private telegraph companies such as Western Union in the United States or the ‘Electric’ and the ‘Magnetic’Footnote 27 in Great Britain prior to 1870. In many cases, however, the expansion and maintenance of the national telegraph network was a state enterprise under close ministerial control. France and Germany are two excellent examples of such a policy. The construction and expansion of a national telegraph network during Japan’s rapid industrialization from the 1860s onwards provides another example for strictly state-controlled telecommunication development.Footnote 28 And even Great Britain, where free enterprise and entrepreneurship formed the very foundation of the economy, domestic telegraphy was nationalized by the Telegraph Act of 1868 (and with effect from 1870). Additional to the creation of a national telegraph network, there were soon efforts to establish international telegraphic connections as well – first between neighbouring countries, but soon also spanning continents and oceans. Only years after domestic telegraphy had started to emerge, a global telecommunication network began to be woven. This study endeavours to identify the communication centres and peripheries in such a network. Both the degree of international connectivity and the rate of the internal telegraphic development of a nation play crucial roles in such an assessment.
Only if a nation has both a well-developed domestic telegraph network and is tightly connected to other network nodes beyond its borders, can we really speak of a communication centre. Lew and Cater even say that there is a direct correlation between the use of a country’s domestic network and its global connections. ‘Generally, the greater the domestic telegraph usage the greater the international usage. […] Domestic and international messages [in the sample of Lew’s and Cater’s article] have a correlation coefficient of 0.97.’Footnote 29 The domestic lines provide the essential link between the global and the local. Only if this link is complete, can the global impact on the local – or vice versa. Therefore, we will first take a look at the creation of domestic networks in different regions of the world during the nineteenth century and then set out to examine the structure of a specific part of the international telegraph network in more detail. Due to the availability of statistical material, this detailed network analysis can only concentrate on Europe for which we have suitable circuit data available. While it is hoped that future research will also provide us with usable circuit data for North America, it seems unlikely that such material can be uncovered for the non-Western world. A network analysis of the submarine telegraph network – for which abundant data is available – will also only yield partially valuable results, as such a study can only cover the marine parts of the network and suffers from huge gaps wherever landline data does not exist. Therefore, we will have to settle for the circuit material that is available at the moment. And these are mainly figures for Europe in the early twentieth century.
National telegraphic development
The statistical data presented in the following have been collected in the archives of the International Telecommunications Union (ITU) in Geneva, Switzerland. Today a specialized agency of the United Nations, the ITU was founded as the Bureau International des Administrations Télégraphiques by the signing parties of the 1868 Conférence Télégraphique Internationale in Vienna. It had its headquarters in Berne, Switzerland, and was eventually renamed the International Telegraph Union. It was the main purpose both of the telegraphic conferences of the mid-nineteenth century and of the bureau to facilitate and monitor international telegraphy. To this end the ITU collected a wealth of statistical material on the domestic networks of its member states as well. Although the data is not as complex and detailed as some of the material that can be found in the archives of the national telegraph administrations, it has one distinct advantage: it has been compiled and prepared in order to allow for comparisons between the different member states.
The ITU started to request statistical information from its member states immediately after its foundation and, additionally, tried to retrospectively gather information on network growth prior to 1870 as well. The material received from the national administrations for this early period was not plentiful, and was of mixed quality. The domestic telegraph companies in Great Britain, for instance, did not submit any useful data. Other members such as Prussia (later the North German Confederation and then the German Empire respectively) or Austria-Hungary, however, provided material from 1849 onwards. France has contributed to the ITU surveys since 1851. Unfortunately, the ITU statistics do not hold any information on telegraphic development outside Europe for this early period of telecommunication development.
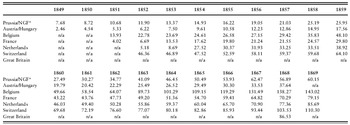
A quick look at the early statistical material (see Table 2) shows that among the bigger European states, Prussia (and its successors), France and Great Britain developed quickest and managed to erect reasonably dense telegraphic networks. In the year 1868, for instance, the recently created North German Confederation features a density of 57 km of telegraph lines per 1,000 square km. Among the larger countries, only France (70 km per 1,000 sq km) and Great Britain (86 km per 1,000 sq km) are doing better. Although Austria-Hungary had almost as many kilometres of telegraph lines as Germany up and working by 1868, it lagged behind in terms of network density with only 38 km per 1,000 sq km. Interestingly, smaller states such as Belgium, the Netherlands and Switzerland led in terms of network density. Switzerland inaugurated its telegraphic network in the year 1852 only, but already exhibits an impressive 46 km of telegraph lines per 1,000 sq km in that year. The figure keeps increasing and reaches 110 in 1869. Similarly, Belgium sets out with 14 km per 1,000 sq km in 1851 and eventually reaches the extremely impressive figure of 143 in 1869, while the Netherlands starts with a comparatively modest ratio of 5 in 1852 but also reach 85 in 1869. These figures confirm the findings of an earlier study, in which I have examined the development of domestic telegraphy between 1870 and 1900, i.e. at a time when the ITU data supply was much more constant and reliable. In order to guarantee better comparability of the network development in different states and world regions, the earlier study works with statistical material indexed towards a selected European average.Footnote 30
Length of telegraph lines per area in selected countries (km per 1,000 sq km).

Source: Bureau International des Administrations Télégraphiques, Statistique Générale de la Télégraphie dans les Différents Pays de l’Ancien Continent, Berne: Imprimerie Rieder & Simmer, 1871.
Remarks: *Until 1866 Prussia is the unit of study. From 1867 onwards, the data represents the North German Confederation.
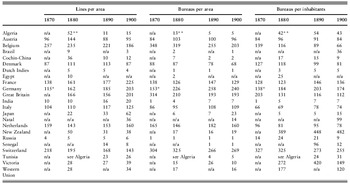
The data prepared in this way provides a comparative perspective on global telegraphic development in the closing third of the nineteenth century. It probably comes as little surprise that Europe and North America outpace most other world regions in the extent and usage of their telegraph networks. Not only did telegraphy technically originate there, the domestic expansion of the technology was also favoured by the creation of vast transport networks and their excellent positions in the global trade network. ITU data on North America concentrates exclusively on the United States of America. Although ‘the United States remained the only industrialized nation without a government telegraph service’ after the British telegraph companies had been nationalized in 1870,Footnote 31 Western Union had practically monopolized the telecommunication business. The company submitted statistical data to the ITU at irregular intervals. As can be seen from Table 3, the Western Union telegraph network could not compete with the European average in line density or bureau density per surface area. Yet, this must mainly be attributed to the vastness of the country and the concentration of the network in several densely populated regions – for instance in and around the New England area. These geographical and demographical factors distort the per-area figures, but it can clearly be seen that the United States performs excellently in several per-head categories with highly competitive ratios of bureaus (Table 3) and internal messages per inhabitants (Table 4).
Length of telegraph lines per area and number of telegraph bureaus per area and inhabitants in selected countries, 1870–1900 (indexed data).

Source: Bureau International des Administrations Télégraphiques, Statistique Générale de la Télégraphie dans les Différents Pays de l’Ancien Continent, Année 1870, Berne: Imprimerie Rieder & Simmer, 1873; Bureau International des Administrations Télégraphiques, Statistique Générale de la Télégraphie dressée d’après des Documents Officiels, Année 1880, Berne: Imprimerie Rieder & Simmer, 1882; Bureau International des Administrations Télégraphiques, Statistique Générale de la Télégraphie dressée d’après des Documents Officiels, Année 1890, Berne: Imprimerie Gebhardt, Rösch & Schatzmann, 1892; Bureau International, Statistique Générale, Année 1900.
Remarks: *In 1870 the data for Germany encompasses only the North German Confederation, Baden, Bavaria and Wurttemberg. Later data refers to the German Empire. **In 1880 the data for Algeria includes Tunisia as well. All data is indexed with one hundred representing the selected European average of each year.
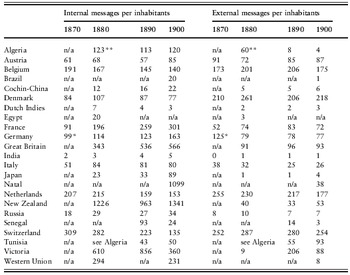
Internal and external telegraphic messages per inhabitants in selected countries, 1870–1900 (indexed data).

Source: Bureau International, Statistique Générale, Année 1870; Bureau International, Statistique Générale, Année 1880; Bureau International, Statistique Générale, Année 1890; Bureau International, Statistique Générale, Année 1900.
Remarks: *In 1870 the data for Germany encompasses only the North German Confederation, Baden, Bavaria and Wurttemberg. Later data refers to the German Empire. **In 1880 the data for Algeria includes Tunisia as well. All data is indexed with one hundred representing the selected European average of each year.
Turning to Europe, Russia represents a similarly distorted but less developed case. Like the New England region in the United States, the European part of Russia also maintained an early tight telecommunication network. However, most of the eastern parts of the country – such as Siberia – were only marginally (if at all) developed in this regard. Similarly, this distorts all figures relative to the area of the country as can be seen in Table 3. Even in the case of Russia, where the gap in the per-area categories is extremely pronounced, we can see a better performance in the per-head categories. Although this indicates that both the United States and Russia indeed had telegraphically very well developed regions, the ITU data does not allow us to examine these regions in greater detail as it is severely distorted due to the sheer size of both countries.
In Europe, Belgium and Switzerland feature extremely tight telegraphic networks and a high rate of telegraph lines per size of country throughout the period of observation – even if Switzerland starts to lose out on its competitors towards the end of the century. Among the smaller states, the Netherlands and – with a certain lag – Denmark also belong to the top group. This can at least partly be attributed to their compactness (true for all), their maritime trading tradition and excellent integration in a global telecommunication network (true for all but Switzerland) or the central geographical and commercial position in Europe (true for Switzerland). Among the larger European nations, Great Britain clearly has the best-developed domestic telegraph network in (or around) the year 1870. France and Germany do quite well, but cannot compete with Great Britain in terms of lines per surface or telegraph bureaus per inhabitants. By around 1880, however, both the German Empire and France have almost fully caught up with Great Britain in line density. And Germany has clearly outperformed Britain in bureaus per inhabitants. Only in the categories ‘wires per area’ and ‘internal messages per inhabitants’ does Great Britain still show the most impressive ratios. In 1890 as well as in 1900, the three big players Great Britain, France and Germany are roughly on par in terms of lines per area. The German Empire had massively invested in telegraph bureaus and displays the best ratio of bureaus per area and per head in the top group.
Outside Europe and North America, most of the data held in ITU statistics refers to current or former European colonies (or informal parts of the British Empire in the case of Egypt in the year 1880). Japan presents the only exception to this rule in Tables 3 and 4. Although the country lags far behind the European average for most of the nineteenth century, the figures clearly reflect the massive investment in industrialization and modernization during the Meiji period. In the last ten years of the nineteenth century particularly we can see a surge in telegraphic development. In this period, Japan pushes its ‘lines-per-area’ ratio from 33% to 62% of the respective selected European average. The ratio of ‘internal messages per inhabitants’ almost reaches that threshold in 1900. Although there is some growth in the number of external messages as well, the low ratio here aptly mirrors the country's continued isolation from the rest of the world.
The available data on self-governing European colonies such as Victoria or New Zealand show only marginally developed telecommunication networks (in and around the social and economic centres). But compared to non-settler colonies (or ex-colonies) such as Brazil, Cochin-China, the Dutch Indies or Senegal, these territories feature the relatively denser networks. As can be clearly seen in Tables 3 and 4, most colonies of domination were practically not developed in telecommunications. Those few lines in existence usually served the colonial administrators or connected the principal ports with the important economic regions. As is often the case with ‘the jewel in the crown’, India presents a certain exception to this rule. Given its sheer size and population density, the indexed figures for India are still quite impressive. In the year 1900, its line density reaches 20% of the European average. This might not seem much at first glance, but is put into perspective when compared to considerably smaller and less populated colonies such as, for instance, the Dutch Indies. The extraordinarily high figures for Natal, New Zealand and Victoria in the ‘messages per inhabitants’ categories mainly stem from the sparse populations rather than from unusually high telegraphic activity. Apart from the territories covered here, the ITU statistics hold little information on telegraph penetration outside Europe. This incompleteness (or distortion) of the extra-European statistical material is a recurring feature in nineteenth- century telecommunication history. While data on intercontinental submarine or overland connections is relatively plentiful, the growth of the domestic networks outside Europe and North America is only scarcely documented.
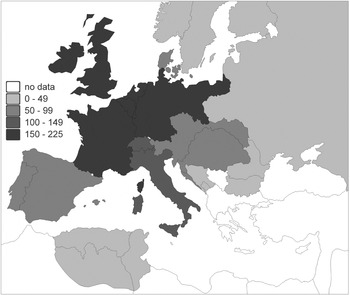
But despite the incompleteness of the available source, the above analysis of ITU data on domestic telegraphy has clearly shown that mainly European countries developed and maintained the densest networks in the nineteenth century. Figure 1 illustrates where the telegraphically best developed countries in Europe were situated in the year 1900. Non-European countries and colonies generally lagged behind in this development. In most cases telegraphic communication focused on the economic centres and completely neglected the commercially less interesting parts of the country. The cases of the United States and Russia highlight the limitations of an analysis of the statistical material collected by the ITU. The data allows us to compare a growing number of countries in terms of the domestic telegraphic development, but the figures on the number of international messages sent and received are the only indicator as to the international connectivity of a country. Table 4 shows the ratio of external messages sent and received per head. The data is also indexed with a selected European average as one hundred and clearly shows that the same smaller states lead the field here as well. In proportion to their population size, these countries – all integrated and participating in a global market – sent and received the highest number of international messages.Footnote 32 All the bigger European players rank slightly under the average of one hundred, with Great Britain clearly leading in this group and France and Germany both lagging behind a little in international telegraphic communication. Although the available data is crude, this seems to confirm Britain’s central role in international telecommunication during the nineteenth century. While states with considerably smaller populations and a nevertheless pronounced interest in global market operations feature much higher ratios of external messages per head, Great Britain leads among the bigger countries. Unfortunately, the figures presented here can only give a first clue towards establishing international telecommunication centres and peripheries. The material does not allow for any assessment of the directions of information flow or for the identification of better- and worse-connected regions within a country. Only access to more detailed data compiled by the national telegraph administrations and the private submarine cable companies will make an in-depth examination possible here. In the case of Great Britain, for instance, the nationalization of the domestic telegraph network led to a number of surveys that provide us with information on messages sent from and received at all telegraph stations. The preparation and analysis of this data will take several more months and is extremely time-consuming. Even then, it will enlighten us about British regional connectivity but with only very limited international comparison.
Map showing the density of telegraph lines per area (km per 1,000 sq km) in Europe, 1900.

International connectivity in Europe
Such a detailed analysis of sent and received domestic and international messages will allow for a use-orientedFootnote 33 study of international telegraphy. It will for the first time enable us to assess not just the maximum capacities of a network, but also how much such a potential has actually been used. This will shed more light on the difference between theoretical capabilities and actual demand for telecommunication. Until such data is available, however, we will have to resort to cruder methods. A circuit analysis, for instance, can help with identifying communication centres and peripheries beyond the national level. Here, existing direct connections between regions (represented by cities and towns) are interpreted with the help of Social Network Analysis (SNA) software. The software calculates several different indicators for a node’s position in the network and thus identifies communication centres and peripheries within the network.
As the name suggests, Social Network Analysis was originally designed to examine the functioning of social networks, i.e. of complex connections between people. The mathematical methods and calculations on which SNA rests, however, can in most cases be directly applied to other networks as well.Footnote 34 While human networks differ substantially from, for instance, telecommunication networks in their purpose and their development patterns, their structure and functioning is essentially the same. Connections between individual nodes form the network and stand at the centre of Social Network Analysis. The SNA software, therefore, interprets data on telegraphic intercity connections with the same accuracy as it processes social network data. However, since we will be feeding the programme with statistical material on existing telegraphic circuits at a given point in time, there is one important difference that we will have to keep in mind. While datasets on social networks usually show connections only when there is indeed interaction between the two nodes, circuit data only tells us about the communication potential. An existing direct circuit between, say, London and Paris, indicates the potential of information flow between the two nodes. The hardware is in place. While it is likely that most potentials have indeed been used, nothing definite can be said about the actual flow of information. In contrast to the study of social networks, our results therefore only mirror the centrality of the nodes in terms of communication potential.
Applying SNA methods to telegraphic connections encounters one more difficulty. Accurate circuit data is almost as hard to prepare as data on sent and received messages. Most of the surviving statistical material on existing circuits is fragmented and notoriously hard to piece together. Here, again, it will take some more work until a reliable dataset can be created just for Great Britain. In isolated instances, however, the ITU has already done some of the necessary work for us. The following analysis, for instance, is based on the ‘Carte Schématique des Grandes Communications Télégraphiques Internationales du Régime Européen’ compiled by the ITU in the year 1923 and held in its archives. The map shows all existing direct telegraphic connections between cities and towns in Europe. The connections shown on the map have all been entered into a data matrix that forms the basis of the Social Network Analysis. The analysis itself has been conducted with Ucinet for Windows, version 6.145.Footnote 35 We will have to keep in mind that all extra-European connections (except the cross-Mediterranean links) only show one terminus at which the network then ends. In reality, however, many more nodes continued the network in, for instance, North America or Asia. The results of our SNA must, unfortunately, ignore all parts of the global telecommunication network that cannot be found on the map. This naturally distorts some of the findings and downplays the importance of the nodes at or near the major cable landing sites. This deficiency can only be overcome if a global telecommunications map featuring all major network nodes and links can one day be compiled.
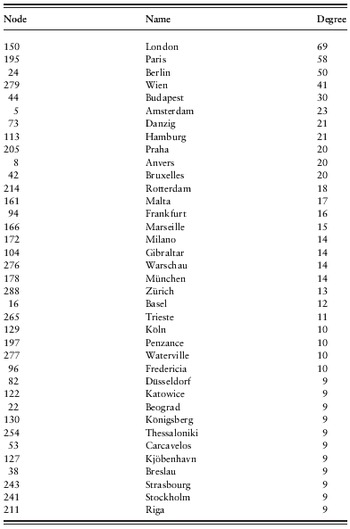
Table 5Footnote 36 lists 37 of the 289 cities and towns included on the ‘Carte Schématique’ ranked according to their Freeman degree Centrality. The calculation of the Freeman degree is one of the most widely used centrality measures in Social Network Analysis and simply counts the number of connections that a node has to other nodes. Valued dataFootnote 37 is recognized by the Freeman degree measure, and therefore circuits with bigger capacities are treated accordingly. For the same reason, the normalized degree (nDegree) has not been included in the table as it should only be calculated for binary data. The comparatively unsophisticated degree count shows that London (conveniently leading), Paris and Berlin maintain the highest number of direct connections to other places. Vienna follows at some distance. Maybe a little surprisingly, Budapest comes fifth before Amsterdam starts to represent the well-developed maritime nations that have done so well in the domestic telegraph study. Zurich and Basel rank twentieth and twenty-first in the list and cannot quite live up to the excellent performance of Switzerland in the domestic statistics. It is interesting to see that seemingly unimportant places such as Malta, Gibraltar, Penzance or Waterville are included in Table 5. This reflects the gateway function of these towns which all occupied strategically important positions in the global telegraph network. Together with, for instance, Brest and Porthcurno, Penzance and Waterville serve as landing sites for most of the Atlantic submarine cables. Gibraltar and Malta are the British strongholds in the Mediterranean and practically all Asian connections via Alexandria and Suez passed through here. Similarly, Carcavelos was an important junction for the Atlantic and Mediterranean cables.
Degree centrality of top thirty-seven network nodes.

Source: Carte Schematique des Grandes Communications Télégraphiques Internationales du Régime Européen dressée par le Bureau International de l’Union Télégraphique, ITU Library and Archives, Geneva, 1 December 1923.
Software: Ucinet 6 for Windows
Remarks: The place names in the table resemble the language and spelling used in the original map.
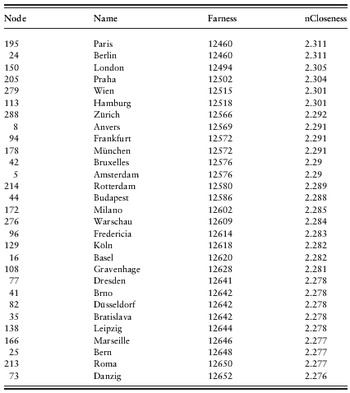
The Freeman degree analysis only shows us how many direct connections a specific node maintained to other nodes in the network. While it is often illuminating to have this information broken down into clear figures, it tells us little about the qualitative position of a node in a network. In his categorization of network analysis methods, Linton Freeman presents two other ways of calculating centrality in a network beyond the simple degree value – closeness and betweenness.Footnote 38 Both only operate with binary connections and do not recognize valued data. They ignore the strength of the link between two nodes and are rather interested in their positions within a network. Table 6 shows the farness and the closeness of the top twenty-nine nodes in our network. Farness is the sum of connections it takes for a node to reach each and every other network node.Footnote 39 The higher the number of connections, the less central is the node. Closeness is the reciprocal value of farness. In its normalized form as nCloseness it shows the percentage of the highest possible closeness value. In our network analysis, the top twenty-nine nodes in terms of closeness are surprisingly near together. Paris reaches every other node in the network in 12,460 steps. Ranking twenty-ninth, Gdańsk needs only 252 steps more than that. Even Benghazi, which is not included in the table but ranks last in the main network body, needs only 13,541 steps. The normalized closeness ranges from 2.311% in the case of Paris via 2.276% for Gdańsk to 2.127% for Benghazi. Paris, Berlin and London again top the list, but are only marginally closer to the rest of the network than other nodes. This can be seen as proof that the European telegraph network fulfilled its central purpose and brought most places in Europe closer together. The network was very well integrated and all the cities and towns connected to the main network were reasonably easy to reach from any other position in the net. The marginal advantages of the French, German and British metropoles do not count much here. As a matter of fact most places were – telegraphically speaking – equally close or far from each other.
Closeness centrality of top twenty-nine network nodes.

Source: Carte Schematique des Grandes Communications Télégraphiques Internationales du Régime Européen dressée par le Bureau International de l’Union Télégraphique, ITU Library and Archives, Geneva, 1 December 1923.
Software: Ucinet 6 for Windows
Remarks: The place names in the table resemble the language and spelling used in the original map.
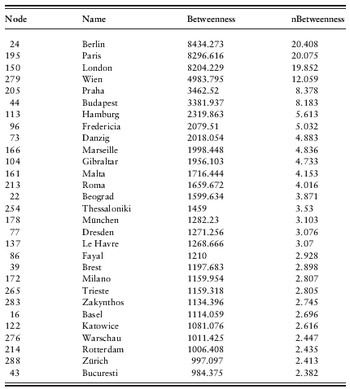
The picture we get when we look at the third Freeman method, betweenness, is substantially different. Betweenness refers to the centrality of a network node in terms of its mediating position in the network. It describes how often the shortest connection between two nodes passes through a certain node and is therefore a clear indicator for the importance of a particular city or town for the efficient functioning of the entire network. The normalized value nBetweenness is the original value divided by the maximum number of node pairs excluding the evaluated node. Table 7 shows that Berlin, Paris and London clearly rank highest in terms of mediating centrality. Vienna follows fourth but reaches only around 12% in nBetweenness. Prague and Budapest lag far behind with slightly over 8% each. Fredericia first represents the small coastal countries that did so well in the study of the development of domestic telegraphy. Rotterdam only comes in twenty-seventh in this category, followed by Zurich as the first Swiss city. Therefore, both degree and betweenness centrality put the findings of the domestic telegraphy figures into perspective. It is clearly the bigger European countries such as Great Britain, France and Germany (and their capitals) that occupied the central positions in the telegraph network in the late nineteenth and early twentieth century. The high betweenness values for Berlin, Paris, London and, to a lesser extent, Vienna emphasize these cities’ central positions in the telegraphic data flow. It was highly likely that a message sent between two European places would pass through one of these central junctions. And especially for London we could even expect a somewhat higher rate if the data used were to include the North American and South Asian networks as well.
Betweenness centrality of top twenty-nine network nodes.

Source: Carte Schematique des Grandes Communications Télégraphiques Internationales du Régime Européen dressée par le Bureau International de l’Union Télégraphique, ITU Library and Archives, Geneva, 1 December 1923.
Software: Ucinet 6 for Windows
Remarks: Data is symmetric and has been binarized for the calculation of betweenness. The place names in the table resemble the language and spelling used in the original map.
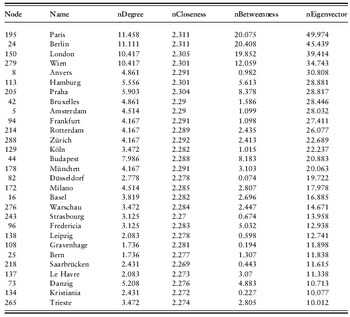
Finally, we should also take a look at Bonacich’s eigenvector method.Footnote 40 Here a node is central when it is connected to other central nodes. Table 8 lists the top twenty-nine nodes in our network sorted by their eigenvector value and giving normalized values for Freeman degree, closeness and betweenness as well. Paris, Berlin and London can again be found at the top end of the list, but London interestingly does much worse than the other two. Vienna comes as usual fourth, but then we quickly find places such as Antwerp (fifth), Brussels (eighth), Amsterdam (ninth), Rotterdam (eleventh) or Zurich (twelfth) in the list. Therefore, the eigenvector ranking differs essentially from the betweenness table (at least below the top ranks) and generally supports the findings of the domestic telegraphy analysis above. Antwerp, Brussels and Amsterdam are excellent examples for this difference. As Table 8 shows, these three cities feature normalized eigenvector values of between 30% and 28%. They are therefore in the range of Hamburg or Prague and even relatively close to Vienna, while their normalized betweenness values are marginal compared to those of their competitors.
Bonacich eigenvector centrality of top twenty-nine network nodes.

Source: Carte Schematique des Grandes Communications Télégraphiques Internationales du Régime Européen dressée par le Bureau International de l’Union Télégraphique, ITU Library and Archives, Geneva, 1 December 1923.
Software: Ucinet 6 for Windows
Remarks: Data is symmetric and has been binarized for all calculations including normalized Freeman degree. The place names in the table resemble the language and spelling used in the original map.
As to their position in the European telegraph network, this means that they were not central in terms of being situated on the main routes of communication. They were of only limited importance for the actual flow of information between other network nodes, but had good access to the very centres of the network. Therefore it seems reasonable to assume that these cities on the Belgian and Dutch coast and in the Swiss Alps occupied a special position in the European (and global) communication network of the late nineteenth and early twentieth century. They did not belong to the leading metropoles nor were they near the European average. It could be suggested that these cities were probably more on the consuming end of the international dataflow, contributing less than they were receiving and with little control over the flow of information itself.
Conclusion
It has been the main aim of this brief study primarily to provide clues as to where we can find communication centres and peripheries in the late-nineteenth- and early-twentieth-century world – both from a perspective of internal (or domestic) telegraphic development as well as regarding their international connectivity. As has been pointed out earlier, a crude distinction between the opposing ends of the spectrum is rather easy to establish. It was predictable that the big metropolises of the day – such as London, Berlin and Paris – stood at the very centre of national and international communication networks which reached out across the entire globe. Similarly, it comes as little surprise that the few evaluated non-European territories, the vast Asian part of Russia, or the poorer countries in the eastern part of Europe had only rudimentary domestic networks and formed the end of the field – let alone all the many states and colonies that would not even make it into the statistics. This general pattern is rather well established, yet it offers us few clues as to the actual transformative potential of telecommunications. The two ends of the spectrum are – in the true sense of the phrase – worlds apart. They are essentially different in many social, economic and cultural aspects and thus lack a common basis of comparison. So many other factors would influence such a comparison that the accurate evaluation of the impact of domestic and international connectivity could hardly be isolated in the process.
Therefore a more accurate and graded evaluation of the internal and external telecommunication integration of a country or node is necessary in order to identify suitable pairs for comparison. A first step in this direction has been made by looking at the statistical data compiled by the Bureau International des Administrations Télégraphiques. In order to render the results comparable the raw data had to be put in relation to the area and population of the countries. The analysis of the different degrees of domestic telegraphic development in different world regions between 1870 and 1900 has clearly shown that Europe featured the best-integrated telecommunication networks at that time. While it is absolutely reasonable to assume that the United States was roughly on a par with the better-developed European states, the data derived from ITU sources gives only limited clues to this. The validity of the available figures is distorted by the vastness of the country and the unequal distribution of the telegraph network in the United States. The very same holds true for data on Russia. Non-Western regions generally lag far behind in telegraphic connectivity throughout the period of observation. It is notable that white settler colonies such as New Zealand or Victoria, as well as rapidly industrializing Meiji Japan, featured much better development indicators than most colonies of domination that exhibited only rudimentary telecommunication networks centred around the principal ports and economic regions.
In Europe, Great Britain, France and Germany (in various constellations until 1871) obviously belong to the top group in terms of domestic telegraphic development. However, they are joined – and even surpassed in certain categories – by compact, trade-oriented countries such as Belgium, the Netherlands and Switzerland. Austria-Hungary (later only Austria) and Italy together with the smaller Denmark form the telecommunications midfield, while the rest of Scandinavia, the Iberian countries and most of Eastern Europe lag far behind and form the bottom end of the European scale. The only ones doing worse are the various non-European countries or colonies and obviously Russia, whose data is distorted by the vastness of its landmass.
Trying to identify international communication centres (in our case within a European network), the Social Network Analysis brought roughly corresponding results. In all categories, London, Paris and Berlin were topping the tables. However, Vienna – the capital city of domestically only average Austria – ranks fourth in all feasible SNA categories. While the internal telegraphic development in Austria could not compete with the top group, the capital certainly occupied a central position in the European telegraph network. An equally interesting observation has been made regarding the smaller members of the domestic top group. Several Belgian, Dutch and Swiss cities occupy top ranks in degree centrality and eigenvector centrality, yet they lag behind in betweenness centrality. At the moment, we can only speculate as to what this position, close to the centres but far from the pathways of information, meant for the development of these cities and their home countries. Only a systematic comparison between these nodes and the European metropoles will shed further light on the matter. Mainly corresponding with the findings of the domestic statistics, the Social Network Analysis identified most Eastern European, Scandinavian (apart from Denmark) and Iberian nodes as disadvantageously placed in the European network. The poor performance of the Iberian countries in the domestic as well as in the international evaluations is somewhat surprising. Both Portugal and Spain have longstanding maritime traditions and have maintained considerable extra-European trade links. They also occupied a central geographic position between Europe and Africa and guarded the entrance to the Mediterranean. Admittedly, their economic and political influence had declined considerably during the eighteenth and nineteenth centuries, but Spain’s position, in particular, at the very end of the European scale, nevertheless surprises.
Now, what have we gained through these analyses and what remains to be done? The material presented in this study can at best provide a first step towards identifying global communication centres and peripheries. While the preparation and indexing of the ITU data has created a first, tentative map of domestic telegraphic development in Europe, much remains to be done here. Only the systematic consultation of the material left behind by the national telegraph administrations can render such a map accurate and comprehensive. Especially from the perspective of the global historian, the geographic focus on ITU member states and the eurocentrism that follows from this must be utterly unsatisfactory. Again, only the compilation and preparation of national telegraphic data will eventually enable us to extend such a map beyond European borders. In addition, the data presented in this part of the study is mainly static data on telegraph lines and wires. In the earlier study mentioned above I have also included figures on telegraph bureaus and messages handled,Footnote 41 but the potential insights provided by the latter category as to patterns of information flow suffer particularly from the crudeness of the data. A refinement of our research methods and access to more detailed statistical material will be crucial for future studies. In the case of Great Britain, for instance, the telegraph administration has at various points in time gathered information on the number and type of messages sent from and received at all major telegraph bureaus. The analysis of such data is a painstaking process but will hopefully soon provide us with fresh hints as to the pattern of information flow in Britain.
At least to my knowledge, the methods of Social Network Analysis have never been used to examine the history of telecommunication in Europe before. As we have seen, these methods offer many useful hints as to the exact position and function of individual cities or regions within the network. Particularly when contrasted with the findings of the domestic telegraph study, a good number of new, sometimes surprising insights have been generated and will hopefully inform future comparative studies on the topic. Yet, the potential of Social Network Analysis for our specific purposes is severely curtailed by the scarcity of available data. Maps or tables showing comprehensive data on national or international telegraph circuits are extremely rare. When available at all, they tend to be incomplete – a particular problem for the analysis of an entity (the network) that unfolds its total potential only on the global scale. The SNA conducted in this study illustrates these difficulties. Instead of consulting data from the nineteenth century – which would have much better complemented the findings of the first study – a map from the year 1923 builds the database. And instead of dealing with a global network, we had to settle for the analysis of its European part. Although the provision of a more comprehensive database for such studies will be a laborious and piecemeal process, it should be one of the priorities of future studies as it will hold the key for examining the prominence and power of any local node (and its constituting agents) in the global network.