INTRODUCTION
In arid and semiarid coastal areas, freshwater resources are scarce and are frequently affected by salinization processes (Mastrocicco and Colombani, Reference Mastrocicco and Colombani2021). Therefore, identifying groundwater salinization mechanisms is a critical tool for water resource management (Edmunds, Reference Edmunds2009). Salinization of coastal aquifers is commonly associated with current seawater intrusion; however, other sources or processes may be recognized, such as saline paleo-water associated with past transgressions (Han et al., Reference Han, Song, Currell, Cao, Zhang and Kang2011; Giambastiani et al., Reference Giambastiani, Colombani, Mastrocicco and Fidelibus2013; Sola et al., Reference Sola, Vallejos, Daniele and Pulido-Bosch2014; Santucci et al., Reference Santucci, Carol and Kruse2016), water–rock interaction (Sánchez-Martos et al., Reference Sánchez-Martos, Pulido-Bosch, Molina-Sánchez and Vallejos-Izquierdo2002; Cendón et al., Reference Cendón, Ayora, Pueyo, Taberner and Blanc-Valleron2008; Lucas et al., Reference Lucas, Schmitt, Chabaux, Clément, Fritz, Elsass and Durand2010), and anthropogenic contamination (Perrin et al., Reference Perrin, Parker and Cherry2011; Merchán et al., Reference Merchán, Causapé, Abrahão and García-Garizábal2015). Despite these possibilities, recognizing the origin of groundwater salinization in coastal aquifers is not a simple task.
Coastal aquifers associated with littoral landforms deposited during the last 120,000 years have been subject to multiple phases of sea-level fluctuations and climate changes that strongly conditioned recharge processes (Wang and Jiao, Reference Wang and Jiao2012; Giambastiani et al., Reference Giambastiani, Colombani, Mastrocicco and Fidelibus2013; Sola et al., Reference Sola, Vallejos, Daniele and Pulido-Bosch2014; Geriesh et al., Reference Geriesh, Balke, El-Rayes and Mansour2015; Santucci et al., Reference Santucci, Carol and Kruse2017). The Quaternary geologic, geomorphological, and climatic evolution of coastal areas directly influences the hydrolithologic characteristics determining the current presence of fresh and saline ground water in coastal aquifers (Carol et al., Reference Carol, Cellone, Tanjal and Galliari2022). Added to this imprint of the past are the existing characteristics of each coastal area. In arid and semiarid regions, the scarce and sporadic rainfall and high evaporation rates condition the recharge of the aquifers (Shrestha et al., Reference Shrestha, Bach and Pandey2016; Hu et al., Reference Hu, Wang, Li, Huang, Hou, Li, She and Si2019; Kammoun et al., Reference Kammoun, Trabelsi, Re and Zouari2021). In this context, identifying hydrogeologic controls on groundwater flow paths, recharge, and salinization is often critical to the management of limited arid groundwater resources (Druhan et al., Reference Druhan, Hogan, Eastoe, Hibbs and Hutchison2008).
The Atlantic coast of Patagonia in Argentina constitutes an extensive coastal area where arid and semiarid conditions dominate and local populations face serious freshwater supply problems (Alvarez et al., Reference Alvarez, Trovatto, Hernández and González2012). The town of San Blas, located on the northern coast of Patagonia (Fig. 1), is a small urban area that is supplied by the exploitation of ground water stored in Quaternary beach ridge deposits. Previous studies have shown that freshwater lenses only develop on Holocene beach ridges, while water is mainly brackish on Pleistocene ridges (Carol et al., Reference Carol, Alvarez, Tanjal and Bouza2021a, 2021b). In freshwater lenses of Holocene beach ridges, it was determined through hydrochemical and geophysical studies that there is evidence of marine intrusion caused by current pumping in the most populated sector. On the other hand, ground water in Pleistocene beach ridges has given indications about the influence of Quaternary geomorphological evolution in salinization processes (Carol et al., Reference Carol, Perdomo, Álvarez, Tanjal and Bouza2021b). However, previous works only have hydrochemical data from wells located in the edge sectors, close to current tidal channels, and little geophysical data. Therefore, to understand in greater detail the influence of the Quaternary geomorphological–climatic evolution, it is necessary to increase the number of monitoring wells and geophysical profiles, as well as hydrolithologic studies and infiltration tests that allow quantifying possible hydrogeologic variations conditioning groundwater salinity. The aim of this work was to evaluate the influence of Late Quaternary climatic events on the hydrogeologic characteristics conditioning the distribution of fresh, brackish, and saline ground water in the Holocene and Pleistocene beach ridges of San Blas Bay. The present study is intended to fill the gaps in previous works by expanding the water-monitoring zones, generating more geophysical transects, and carrying out hydrologic and recharge rate studies. This will allow a regional analysis of those factors that occurred in the recent past and that currently influence the hydrogeology and salinity of the water, interpreting the geomorphological–climatic evolutionary context of the area.
(a) Location of the study area; (b) detail of the study area showing the location of the Pleistocene and Holocene beach ridges; (c) digital elevation model (DEM) with the location of water-monitoring wells (black triangles), vertical electrical soundings (VES; red circles), and geophysical profiles (white lines).

STUDY AREA
The study area includes the coastal area of San Blas Bay, which has been repeatedly occupied by Quaternary marine transgressions and has the best-preserved deposits corresponding to Marine Isotope Stages (MIS) 5e and 1. The MIS 5e deposits correspond to beach ridges outcropping west of the Jabalí channel reaching heights between 8 and 10 m above sea level (m asl) (Fig. 1). These beach ridges correspond to a sea level that was located about 6 m above the current level (Schnack et al., Reference Schnack, Isla, De Francesco and Fucks2005; Hearty et al., Reference Hearty, Hollin, Neumann, O'Leary and McCulloch2007). They are composed of homogeneous gravelly sediments with a gray sandy-loamy matrix, with molluscan fauna that was dated to 28.4 ± 0.8 and 12.0 ± 0.97 ka (Trebino, Reference Trebino1987). On top of these Pleistocene deposits, only thin layers of sands are recognized in some sectors. On the other hand, MIS 1 deposits are represented by beach ridges with maximum elevations of 6 m asl. located east of the Jabalí channel (Fig.1), corresponding to a sea level that was located approximately 4 m above the current level (Isla, Reference Isla1998; Schnack et al., Reference Schnack, Isla, De Francesco and Fucks2005). These ridges are composed of gravels and sands with scarce shells that were dated to 3.28 ± 0.08 ka (Fucks et al., Reference Fucks, Charó and Pisano2012), 4.1 ± 0.9, and 5.37 ± 0.11 ka (Trebino, Reference Trebino1987). Toward the southern sector, eolian sands are deposited over these beach ridge deposits, forming dune fields.
The town of San Blas is located on the Holocene beach ridges and has a stable population of no more than 2000 inhabitants, while the rural population is very low on the Pleistocene ridges (INDEC, 2022). In both cases, water is supplied from shallow wells (between 5 and 8 m deep) taking water from the phreatic aquifer. In the most populated sector, there is a water supply cooperative, while the rest of the inhabitants have household wells. The phreatic aquifer is recharged from excess rainfall, which is scarce, because the annual potential evapotranspiration reaches 730 mm, while the annual rainfall averages 300 mm (Galliari et al., Reference Galliari, Santucci, Misseri, Carol and Alvarez2021). The low water surpluses that recharge the aquifer mean that marine intrusion can occur in the areas of greatest pumping within the Holocene beach ridges (Carol et al., Reference Carol, Cellone, Tanjal and Galliari2022).
MATERIALS AND METHODS
A geomorphological characterization of the study area was carried out using digital elevation models (DEMs, MDE-Ar v. 2.0 30m) generated by the National Geographic Institute of Argentina (IGN, 2020), the interpretation of satellite images (Google Earth software), and field surveys. During fieldwork, outcropping geologic profiles were described in quarries; soil pits and manual auger drilling (up to 2 m deep) were carried out to describe their hydrolithologic characteristics. This information was supported by previous lithologic profiles of water supply perforations provided by the San Blas water supply cooperative. At selected sites, infiltration tests were performed using the simple ring method (Chowdary et al., Reference Chowdary, Rao and Jaiswal2006). These infiltration tests were made in triplicate, counting some sectors with two nearby measurement sites, because lithologic variations were observed within a few meters (e.g., beach ridge sectors and depressed inter-ridge sectors where fine sediments predominate).
Within the Holocene and Pleistocene beach ridges, vertical electrical sounding (VES) was performed with ARES II equipment from GF Instruments. VES data were acquired using a Schlumberger array of 100 m of maximum-current electrode distance. During the fieldwork, an apparent resistivity curve was obtained after circulating a direct current through the emission circuit and measuring the potential difference generated between the receiver electrodes. The inversion scheme followed here was proposed by Zohdy (Reference Zohdy1989), and the number of layers was then reduced using the Dar Zarrouk parameters (Maillet, Reference Maillet1947). The response curve was then calculated with a linear filter (Johansen, Reference Johansen1975), adjusting a misfit of 5% or less with observed data. At the sites where VES was carried out, the water table position and electrical conductivity (EC) were measured in existing nearby perforations. This information was used to generate the geophysical models and define the minimum number of electro-layers. For the spatial and in-depth analysis of the lithologic variations in the unsaturated zone and groundwater salinity, transects cutting beach ridges were carried out. The relative heights of the VES models were arranged on topographic lines obtained from a DEM MDE-Ar v. 2.0 (IGN, 2020).
Additionally, groundwater samples were taken from borewells (5–8 m deep) in order to analyze major ion content, after having first purged the borewells by pumping.. Total dissolved solids (TDS) and pH were measured in the field using multiparametric equipment. Chemical determinations were made using standardized American Public Health Association methods (APHA, 1998) in the laboratory at the Centro de Investigaciones Geológicas (Geological Research Center). Sodium (Na+) and potassium (K+) were determined by flame photometry; calcium (Ca2+), magnesium (Mg2+), carbonate (CO32−), bicarbonate (HCO3−), and chloride (Cl−) by titration; and sulfate (SO42−) by UV-visible spectrophotometry. Data were interpreted using both ionic variation and ionic relation plots and Gibbs diagrams (Gibbs, Reference Gibbs1970).
Stable isotope determination (δ2H and δ18O) was carried out for some groundwater samples at the Universidad Nacional de San Luis (National University of San Luis) following cavity ring-down spectroscopy methods, using a Picarro L2120-i coupled to an A0211high-precision vaporizer. Isotopic results are expressed as δ‰, defined as δ = 1000(R s − R r)/R r‰, where δ is the isotopic deviation in per mil (‰) relative to Vienna Standard Mean Ocean Water (Gonfiantini, Reference Gonfiantini1978), s is the sample, r is the international reference, and R is the isotopic ratio (2H/1H, 18O/16O). Groundwater isotopic values were compared with the local meteoric line δ2H = 7.73 ± 0.28*δ18O + 8.89 ± 1.67 (Martínez et al., Reference Martínez, Quiroz, Dapeña, Glok-Galli, Massone and Ferrante2011), these being the closest data for a coastal area. Theoretical water mixing was undertaken considering the average isotopic and chloride composition of the freshwater samples (C fw) and the sea water (C sw) as extreme members:

where y is the percentage of sea water and (1 − y) the percentage of fresh water in the lenses.
RESULTS
Hydrolithologic characteristics and infiltration rates
Pleistocene beach ridges constitute a series of linear deposits with a predominantly N-S orientation, reaching elevations up to 12.0 m asl. These deposits are separated by more-depressed areas with elevations that vary between 0.5 and 4 m asl. In both the geologic profiles and shallow drilling (approximately 2 m deep), it was observed that the sediments in the beach ridges are composed of gravels with a silty loam matrix. The presence of carbonate cement was observed in most of the studied profiles, sometimes forming important layers of calcretes cementing the gravel deposits (Fig. 2a–c). Lithologic profiles from perforations indicate that the gravels with a sandy loam matrix are 3 to 4 m thick with an underlying level of cemented sandstone. The estimated infiltration rates obtained during fieldwork varied between 2.75 and 28.06 mm/h, registering the lowest values in the sectors where gravels present predominantly silty loam matrices.
Lithologic profiles and field photos showing the lithologies in the different sectors within Pleistocene (a–c) and Holocene (d–f) beach ridges. Temporal range defined according to Trebino (Reference Trebino1987) and Fucks et al. (Reference Fucks, Charó and Pisano2012).

Holocene beach ridges exhibit heights that vary between 2 and 8 m asl with a N-S elongation that in the N sector diffracts toward the NW due to the ongoing coastal drift that originates and models the current deposits of the barrier spit. In the geologic profiles and shallow drillings, it was observed that the sediments are composed of gravel with a scarce sandy matrix in the N sector, gravel and sand in the central sector, and sandy deposits associated with dunes in the S-SE sector (Fig. 2d–f). Lithologic profiles obtained from deeper perforations (21 m deep) carried out in the S sector show that the first strata from the top are composed of 8.5 m of sand. At depth, there are 3.5 m of gravel with a sandy matrix, 2 m of cemented sand, and 7 m of clay (Fig. 2f). In the Holocene beach ridges, the estimated infiltration rates varied spatially following the lithologic features. In the N sector, within the gravelly ridge deposits, infiltration rates varied between 16.14 and 55.71 mm/h, registering a marked decrease in the more clayey inter-ridge area with values of 1.71 to 2.14 mm/h. On the other hand, in the central and S-SE sectors where gravel with sandy levels and sand on the surface begin to dominate, the estimated infiltration rates varied between 18.51 and 47.35 mm/h.
Vertical electrical soundings (VESs)
The proposed VES models generally present higher resistivities in the shallower electro-layers, whereas electro-layers with lower resistivities are observed as the depth increases (Fig. 3). In these models, resistivity values were interpreted based on both the lithologic characteristics surveyed in profiles and drillings and groundwater EC measured in wells adjacent to the VESs.
Vertical electrical soundings (VES) of the Pleistocene and Holocene beach ridges.

In the VES models obtained for the Pleistocene ridges, it can be observed that the most superficial layers present intermediate resistivities (10 to 200 Ohm⋅m) that correspond, based on field observations, to an unsaturated zone composed of gravel with a sandy matrix cemented by carbonates that in some sectors develop calcretes. In VESs 18 and 26, the first layers have a very high resistivity, possibly because they were measured in a lowland area where the sediments have little cementation. The water table location is also interpreted as a decrease in resistivity. From water EC information for mills adjacent to the VESs, it was possible to verify that the phreatic aquifer has brackish characteristics (EC between 3.64 and 15.90 mS/cm) and the resistivities vary between 4 and 30 Ohm⋅m for the VESs 18, 19, 22, 23, 25, and 30, while for the VESs 24, 26, and 29, the resistivities of the phreatic aquifer vary between 25 and 40 Ohm⋅m. Very low resistivity values for the last electro-layer may be interpreted as result of an increase in the water EC.
The proposed models for the VESs (1−6, 10, 11, 13, and 14) located in the Holocene ridges present a very high resistivity (generally between 175 and 2000 Ohm⋅m) in the shallower sectors, up to about 4 m deep. These measurements would correspond with the described geologic profiles, which are composed of gravel and thick sediments with little cohesion and without fine matrix or cementation. The water table location is interpreted as a decrease in resistivity, which in some cases manifests itself across several orders of magnitude (e.g., VES 5: 9000 to 10 Ohm⋅m). Below this, there is a layer with resistivities between 10 to 120 Ohm⋅m corresponding to the freshwater aquifer (associated with EC measurements in adjacent wells between 0.71 and 1.88 mS/cm), with a maximum thickness of 8 m in the ridge center. The electro-layers that are attributed to the presence of fresh water, in general, present little lateral extension, registering a decrease in thickness in the VES toward the sea and the Jabalí channel, which is interpreted as a response of a lenticular morphology. The last electro-layer shows very low resistivity values, attributable to the presence of saline water. On the other hand, in VESs 7–9, very low values were observed for the unsaturated zone, being attributed in this case to the fact that they are located in marsh transitional environments, which are topographically lower with a dominance of clays and saline precipitates on the surface where the ground water registers values greater than 10 mS/cm.
Hydrochemistry
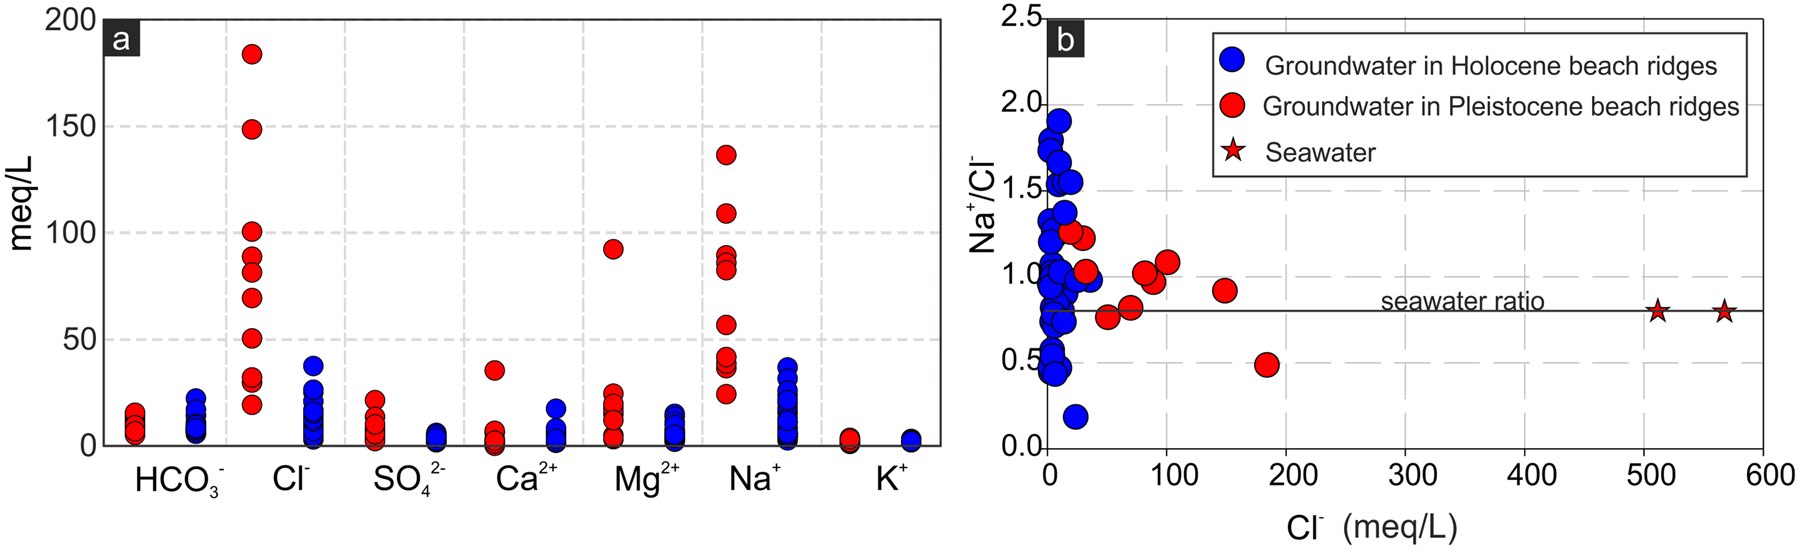
Groundwater TDS content shows average values of 5945 mg/L in the Pleistocene ridges and 1107 mg/L in the Holocene ridges, the pH being neutral to slightly alkaline in all cases. The chemical composition of major ions in ground water of the Pleistocene beach ridges is Cl− >> SO42− > HCO3− and Na+ >> Mg2+ > Ca2+ > K+ (Fig. 4a), with the high Cl− and Na+ ion content driving the increase in salinity. On the other hand, in ground water of the Holocene beach ridges, the major ion composition is HCO3− > Cl− > SO42− and Na+ > Ca2+ > Mg2+ > K+ in most of the samples, registering in some wells located in both the urban and coastal areas Cl− ≥ HCO3− > SO42− and Na+ > Ca2+ > Mg2+ > K+ (Fig. 4a). The Na+/Cl− ratio versus Cl− (Fig. 4b) shows that ground water in Pleistocene beach ridges presents an increase in Cl− concentration with a tendency to Na+/Cl− values similar to those of sea water, whereas in the Holocene beach ridges, the Cl− concentrations are lower, and the Na+/Cl− ratios are highly variable.
(a) Major ion concentrations and (b) Na+/Cl− ratio vs. Cl−.

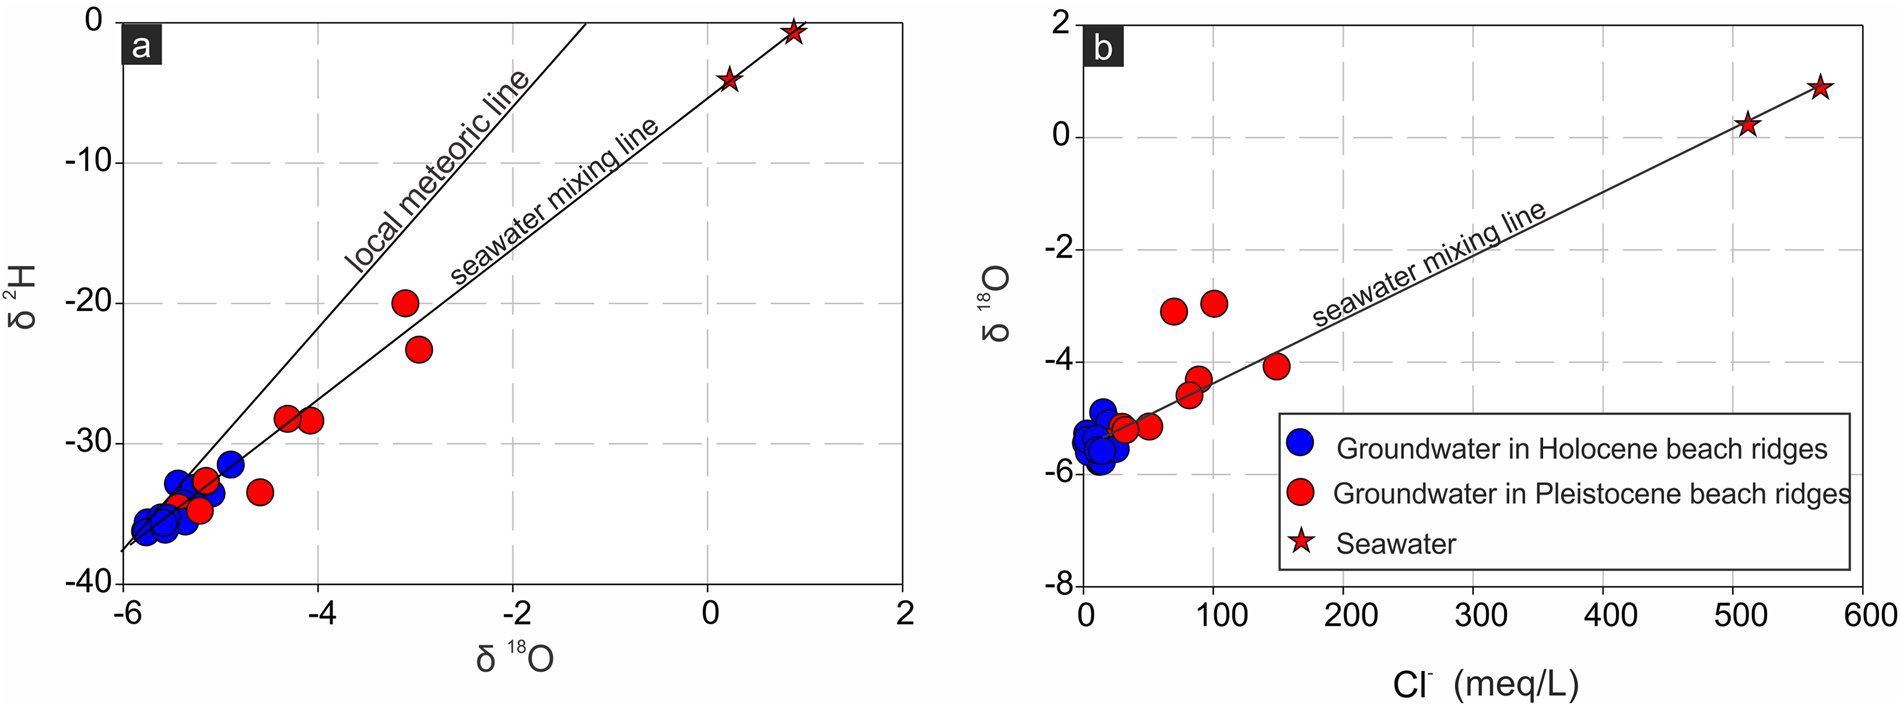
In relation to the isotopic signal, δ18O and δ2H values vary between −5.15 and −2.95‰ and between −34.5 and −20.0‰, respectively, in the Pleistocene beach ridges, where it can be observed that samples deviate from the local meteoric line, being located around to the mixing line with sea water (Fig. 5a). This tendency toward sea water in the isotopic compositions is also observed in the relationship of δ18O versus Cl− (Fig. 5b). Conversely, in the Holocene beach ridges, ground water has an isotopic signal that is not very variable (δ18O varies between −5.75 and −4.90‰ and δ2H between −36.0 and −31.5‰) and similar to that of rainfall (Fig. 5a). The relationship δ18O versus Cl− (Fig. 5b) shows that both the δ18O and Cl− values are a little variable, with no evidence of increases associated with salinization in the Cl− values.
Isotopic ratios: (a) δ2H vs. δ18O and (b) δ18O vs. Cl−.

The Gibbs diagram also demonstrates that the trend toward salinization (increase in TDS) in groundwater samples from Pleistocene beach ridges is associated with Cl−/Cl− + HCO3− and Na+/Na+ + Ca2+ values close to 1 related to sea water (Fig. 6). On the other hand, in groundwater samples from the Holocene beach ridges, there is a tendency toward increased salinity associated with values of Cl−/Cl− + HCO3− between 0.2 and 0.8 and Na+/Na+ + Ca2+ between 0.3 and 1. Within the Gibbs diagram, the groundwater samples are mainly located in the field related to the acquisition of salts by interaction with the aquifer's sediments (Fig. 6).
Gibbs diagram: (a) TDS vs. Cl−/Cl−+HCO3− (b) TDS vs. Na+/Na++Ca2+.

DISCUSSION
The study of the hydrolithologic characteristics of beach ridges deposited during the Late Quaternary in the San Blas Bay area shows that there are differences between Pleistocene and Holocene ridge deposits that directly influence groundwater chemistry. Pleistocene beach ridges are arranged on sand levels strongly cemented by carbonates and are composed of gravels with a sandy matrix also cemented by carbonate in some sectors (Fig. 2a–c). Holocene beach ridges, on the other hand, despite the lithologic similarity (as they are composed of gravels with a sandy matrix or gravels with sandy layers), do not present carbonatic cementation (Fig. 2d–f). This difference due to cementation occurring in the unsaturated zone is also recorded in all VESs, where resistivities in the Pleistocene beach ridges were low compared with the very high resistivity values recorded in the Holocene ridges (Fig. 3). This difference in resistivity values in the shallower layers (unsaturated zone) could be attributed to a combination of sediment characteristics, matrix cementation, and sediment saturation. In the Holocene ridges, resistivities would be higher, resulting from poor cohesion and low partial saturation of the sediments due to grain size. On the other hand, in the Pleistocene ridges, electrical conduction would occur more easily in the cemented matrix, and therefore lower resistivity values are observed. These characteristics registered in all the soundings and profiles described give indications that cementation in the Pleistocene ridges is a regional feature that would be associated with the processes that occurred before the deposition of the Holocene ridges. Calcretes are known to be developed in arid and semiarid climates with a long dry season (Alonso-Zarza and Wright, Reference Alonso-Zarza and Wright2010), a characteristic that makes the presence of this type of carbonatic cementation an important paleoenvironmental indicator (Wright and Tucker, Reference Wright and Tucker1991; Cerling and Quade, Reference Cerling and Quade1993; Yaalon, Reference Yaalon1997; Durand et al., Reference Durand, Monger, Canti, Stoops, Marcelino and Mees2010; Tanner, Reference Tanner2010; Gocke et al., Reference Gocke, Pustovoytov, Kühn, Wiesenberg, Löscher and Kuzyakov2011). The presence of calcretes recorded in all Pleistocene beach ridge deposits along the Patagonian littoral indicate that arid conditions were maintained after MIS 5e (Schellmann and Radtke, Reference Schellmann and Radtke2010; Pedoja et al., Reference Pedoja, Regard, Husson, Martinod, Guillaume, Fucks, Iglesias and Weill2011; Pfeiffer et al., Reference Pfeiffer, Le Roux, Solleiro-Rebolledo, Kemnitz, Sedov and Seguel2011, Reference Pfeiffer, Aburto, Le Roux, Kemnitz, Sedov, Solleiro-Rebolledo and Seguel2012). The surface presence of MIS 5e beach ridges along much of the Patagonian coastline is evidence of weakly degradational or weakly aggradational regimes, a characteristic that also facilitates the formation of calcretes (Allen and Hajek, Reference Allen and Hajek1989; Alonso-Zarza and Wright, Reference Alonso-Zarza and Wright2010) along with alkaline pH conditions favoring carbonate precipitation (Appelo and Postma, Reference Appelo and Postma2005). In addition, calcretes develop more rapidly in substrates with coarse grain size (Alonso-Zarza, Reference Alonso-Zarza2003) similar to those of the studied beach ridges, their origin being pedogenic or groundwater associated (groundwater calcretes). The development of calcretes in the superficial part of the studied Pleistocene gravelly ridge deposits (Fig. 2b and c) indicates an origin associated with pedogenic processes (Wright and Tucker, Reference Wright and Tucker1991; Bouza, Reference Bouza2012, Reference Bouza2014). Water loss through evaporation is considered the main mechanism of pedogenic carbonate precipitation (Rabenhorst et al., Reference Rabenhorst, Wilding and West1984), a characteristic that confirms its formation in arid and semiarid conditions.
The formation of calcretes and/or the cementation of the sandy matrix of the unsaturated zone in the Pleistocene ridges causes a noticeable decrease in infiltration rates (Pfeiffer et al., Reference Pfeiffer, Le Roux, Solleiro-Rebolledo, Kemnitz, Sedov and Seguel2011). The results obtained show a strong influence of the calcretes on the infiltration rates, registering in some sectors of the Pleistocene ridges values between two times and up to an order of magnitude lower than in the area of uncemented Holocene ridges. This has a negative impact on rainwater infiltration that recharges the aquifer in the entire Pleistocene beach ridge area. In this way, after the marine ingression that gave rise to the deposition of the Holocene ridges (MIS 1) during the climatic optimum or Hypsithermal, sea water that entered the Pleistocene and Holocene littoral deposits may have begun to be displaced downward by rainwater infiltration, allowing the development of freshwater lenses. However, the development of freshwater lenses is only recorded in the area of the Holocene ridges (Fig. 3), which reach thicknesses close to 8 m. In contrast, the cementation of the unsaturated zone in the Pleistocene ridges decreases the infiltration rate, and the scarce rainwater that infiltrates them cannot totally displace sea water. Therefore, a layer of brackish water (resulting from the mixture of sea water and rainwater) is formed only superficially, underlain by saline water. As was observed with respect to cementation, the existence of brackish ground water over saline water is a feature recorded in all VESs in the Pleistocene ridges area (Fig. 3).
These processes of marine intrusion and subsequent formation of freshwater lenses in the Holocene ridges and of brackish layers in the Pleistocene ridges are hydrochemically verified in the analysis of major ion content and ratios and the isotopic signal. Rainwater infiltration in the Holocene beach ridges is evidenced in the isotopic signal, where it can be observed that groundwater samples are located around the local meteoric line (Fig. 5a). Only a few samples register signs of incipient salinization with an increase in the Cl− content without isotopic variation (Fig. 5b). In these samples, the main ions are HCO3− and Na+, with the TDS versus Cl−/Cl− + HCO3− and TDS versus Na+/Na+ + Ca2+ indicative of the acquisition of dissolved ions by the water–sediment interaction (Figs. 4 and 6). Previous studies showed that the major ion chemistry is controlled by the dissolution of CO2(g), carbonates, and cation exchange (Carol et al., Reference Carol, Alvarez, Tanjal and Bouza2021a). Additionally, in samples located on Holocene beach ridges in near-sea edge sectors, previous studies have identified incipient saline intrusion in the most populated sectors caused by pumping (Carol et al., Reference Carol, Perdomo, Álvarez, Tanjal and Bouza2021b). Conversely, ground water in the Pleistocene beach ridges presents high concentrations of Cl− and Na+, with both isotopic δ18O versus δ2H and ionic ratios of δ18O versus Cl−, TDS versus Cl−/Cl−+HCO3−, and TDS versus Na+/Na++Ca2+ indicative of mixing with sea water (Figs. 4–6). This mixing with saline water cannot be explained by current seawater intrusion due to intensive exploitation, because in the area of the Pleistocene beach ridges studied, there are only seven inhabited estancias, which have few mills that only function for watering animals. The presence of brackish–saline water associated with sea water had previously been reported (Carol et al., Reference Carol, Perdomo, Álvarez, Tanjal and Bouza2021b). However, in this work, the monitoring points corresponded to wells located in the vicinity of tidal channels, which generated doubts as to whether the salinization process affected the entire area of Pleistocene beach ridges or whether it was only a border condition. On the contrary, the present work develops hydrolithologic, geophysical, and hydrochemical studies in the entire area of the Pleistocene beach ridge deposits, demonstrating that the salinization processes are not particular, but regional.
The consistency recorded in the set of hydrolithologic, geoelectric, and hydrochemical data in the Pleistocene and Holocene beach ridges shows that the presence of fresh, brackish, or saline water responds to hydrogeologic controls resulting from the geologic–geomorphological and climatic evolution of the area. In addition, the evolutionary hydrogeologic and hydrochemical interpretations are consistent with those made based on geologic–geomorphological studies in the study area (Fucks et al., Reference Fucks, Charó and Pisano2012). This proves that the understanding of groundwater salinization requires the study of the interactions between the coastal area and global changes, not only through evaluation of current and/or future scenarios but also of past processes. Faced with the context of climate change, it is imperative to understand the processes that condition groundwater salinization. Particularly in coastal areas, predictions of sea-level changes indicate that there will be a global sea-level rise that will cause a saline water intrusion into coastal aquifers. This has led to an increasing number of studies investigating the impact of sea-level rise on groundwater resources (e.g., Werner and Simmons, Reference Werner and Simmons2009; Chang et al., Reference Chang, Clement, Simpson and Lee2011; Colombani et al., Reference Colombani, Osti, Volta and Mastrocicco2016; Moore and Joye, Reference Moore and Joye2021; Abd-Elaty and Polemio, Reference Abd-Elaty and Polemio2023), even though all these works develop future projections without analyzing the clues that past changes can give us to achieve a better comprehension of the hydrogeologic system. Today, studying how Quaternary geologic–geomorphological–climatic evolution conditions groundwater salinization processes is essential, not only to know past conditions but also to predict future scenarios. In addition, the growing aridity that is accentuated in many regions of the world and that affects the studied area, as well as most of the Patagonian coast, places water resource management on alert. On a geologic timescale, we have shown how periods of aridity sustained over time can condition the hydrolithologic characteristics, affecting freshwater reserves. Although it is probable that if aridity conditions increase, the greatest impact on groundwater resources will be due to a decrease in rainfall and consequently in recharge, carbonate precipitation processes and a decrease in infiltration rates may also occur. For example, in Holocene beach ridges located to the north of the study area, it was recorded that in years with low rainfall, ground water tended to saturate in carbonates, which produces its precipitation (Carol and Kruse, Reference Carol and Kruse2012). Particularly in the study area, the presence of superficial layers and sandy soils above the gravel deposits of the Holocene beach ridges enables the future formation of carbonatic cement. This is because infiltrating water is retained before reaching the pressure necessary to fill the larger pores in the underlying horizon (Hillel and Baker, Reference Hillel and Baker1988; Samani et al., Reference Samani, Cheraghi and Willardson1989). Consequently, rain delays its infiltration and begins to evaporate, favoring the precipitation of salts and pedogenic carbonate accumulations in the upper gravel deposits (Stuart and Dixon, Reference Stuart and Dixon1973). In this sense, the results obtained also provide data for the projection of future salinization scenarios facing climate change, beyond those frequently analyzed based on sea-level rise.
CONCLUSIONS
This study contributes to the knowledge of how the hydrogeologic controls resulting from the Quaternary evolution of coastal areas condition the chemistry of groundwater, particularly its salinization. Hydrolithologic, geophysical, and hydrogeochemical investigations carried out in environments associated with Pleistocene and Holocene Quaternary beach ridges allow us to identify the role that pre-Holocene arid conditions played in the infiltration of rainwater that recharges the aquifer. This affects groundwater salinity and the development of freshwater lenses and/or brackish–saline groundwater layers.
The carbonatic cementation of the Pleistocene beach ridges is the result of an arid stage after their deposition, and it strongly decreased their permeability, conditioning the current rate of infiltration and recharge of the aquifer stored in these ridges. Similarly, the Holocene marine ingression that gave rise to the deposition of the Holocene beach ridges salinized the ground water stored in the Pleistocene ridges. With the sea-level drop, both deposits were exposed, and rainwater began to infiltrate these deposits, recharging ground water. Because the Pleistocene beach ridge sediments were cemented, the infiltration rate is very low, preventing the development of freshwater lenses. In contrast, in the Holocene beach ridges, the gravel to sandy sediments are not cemented, and the infiltration rates are high, favoring the infiltration of scarce rainfall and the development of freshwater lenses. In this way, ground water in Pleistocene beach ridge environments is saline to brackish, of sodium chloride type, and with an isotopic signal reflecting seawater contribution, whereas in the Holocene beach ridges, it is mainly fresh, of the sodium bicarbonate type, and with an isotopic signal related to rainwater.
The results obtained in this study contribute to a better understanding of the hydrogeologic evolution and salinization processes of ground water in the coastal environments of Patagonia, where the water supply depends on this water resource. Additionally, the results highlight the complexity of coastal aquifer systems and the importance of approaching their study through different methodologies. The climate has changed in the past, it is changing in the present, and it will change in the future, with the modification of the global hydrological cycle and its implication in the freshwater reserves being the main concern affecting water supply of coastal areas in front of possible future climate change scenarios.
Acknowledgments
The authors are very indebted to the Agencia Nacional de Promoción Científica y Tecnológica and Ministerio de Ciencia, Tecnología e Innovación of Argentina for financially supporting this study by means of their grants, PICT 2019-2421 and Pampa Azul A10. The authors also want to thank Lina Videla, Ignacio Paniagua and Claudia Di Lello who collaborated in the field activities and chemical analysis.