Introduction
The Triassic represents a significant period in the history of life, in which ecosystems recovered from the most massive extinction in Earth's history, the end-Permian event. In the aftermath of this event, the earliest members of many major modern tetrapod clades appear in the fossil record, including lepidosaurs (Jones et al. Reference Jones, Anderson, Hipsley, Müller, Evans and Schoch2013), crocodylomorphs (Benton and Clark Reference Benton, Clark and Benton1988), testudinates (Schoch and Sues Reference Schoch and Sues2015), and mammals (Luo Reference Luo2007). Although mammals are the only members of the synapsid lineage that survive to the present day, Triassic synapsids include broader diversity outside the crown. Anomodontia and Therocephalia, which were ecologically important synapsid clades in the Permian, survived the extinction and underwent moderate subsequent diversification in the Triassic (Fröbisch Reference Fröbisch2008; Abdala et al. Reference Abdala, Jashashvili, Rubidge, van den Heever, Kammerer, Angielczyk and Fröbisch2014; Huttenlocker et al. Reference Huttenlocker and Smith2017). The primary synapsid success story in the Triassic, however, was from the Cynodontia, the group that eventually gave rise to mammals.
Cynodonts first appear in the fossil record in the late Permian (Botha et al. Reference Botha, Abdala and Smith2007; Kammerer Reference Kammerer2016). Permian cynodonts were rare compared with coeval gorgonopsians and therocephalians, and substantial diversification of the clade did not take place until the Triassic. Even before the origin of mammals, Triassic cynodonts exhibited a remarkably disparate range of morphologies and ecologies, including large predators and herbivores (Ruta et al. Reference Ruta, Botha-Brink, Mitchell and Benton2013). These morphotypes were lost by the end-Triassic, but further diversification among nonmammalian cynodonts occurred among the herbivorous Tritylodontidae and insectivorous Trithelodontidae in the Jurassic. The tritylodontid lineage even extended into the Early Cretaceous (Tatarinov and Maschenko Reference Tatarinov and Maschenko1999; Lopatin and Agadjanian Reference Lopatin and Agadjanian2007), surviving alongside the increasingly rich Mesozoic radiation of mammals (Newham et al. Reference Newham, Benson and Upchurch2014; Close et al. Reference Close, Friedman, Lloyd and Benson2015).
As the ancestors of mammals, cynodonts have been extensively studied with regard to the details they provide on the evolution of the mammalian body plan (Sidor and Hopson Reference Sidor and Hopson1998; Sidor Reference Sidor2003; Kielan-Jaworowska et al. Reference Kielan-Jaworowska, Cifelli and Luo2004; Kemp Reference Kemp2005; Ruta et al. Reference Ruta, Botha-Brink, Mitchell and Benton2013). However, during the Triassic, nonmammalian cynodonts were a diverse assemblage in their own right, and study of their evolution and diversification is important for understanding terrestrial vertebrate faunas in the aftermath of the end-Permian mass extinction.
Here we examine the changes in nonmammalian cynodont species richness throughout their history. Additionally, we examine the completeness of cynodont specimens through time to provide details on the quality of the raw data used in diversity analyses. Recent phylogenetic analyses are used to generate a supertree of cynodonts, which is used to calculate sampling-corrected diversity estimates that are of greater accuracy than raw counts of species through time.
Materials and Methods
Diversity Estimates
A taxic diversity estimate (TDE; no sampling correction applied) was calculated for nonmammalian cynodonts by simply counting the number of cynodont species known from each stage. The data set assembled may be considered complete as of March 2018 (Supplementary Data 1). To account for sampling heterogeneity, a phylogenetic diversity estimate (PDE) was also calculated. This method endeavors to include as-yet-unsampled portions of the fossil record in the diversity estimate by incorporating ghost lineages (lineages not yet sampled but inferred from the phylogeny). The method has been used many times in analyses of terrestrial vertebrates (e.g., Upchurch and Barrett Reference Upchurch, Barrett, Rogers and Wilson2005; Barrett et al. Reference Barrett, McGowan and Page2009; Benson et al. Reference Benson, Butler, Lindgren and Smith2011; Mannion et al. Reference Mannion, Upchurch, Carrano and Barrett2011; Ruta et al. Reference Ruta, Cisneros, Liebrecht, Tsuji and Müller2011; Brocklehurst et al. Reference Brocklehurst, Kammerer and Fröbisch2013; Walther and Fröbisch Reference Walther and Fröbisch2013) and has been shown by simulations to outperform the TDE under a variety of sampling scenarios (Lane et al. Reference Lane, Janis and Sepkoski2005; Brocklehurst Reference Brocklehurst2015).
For this purpose, we generated a supertree (Fig. 1) from nine published phylogenies chosen to maximize the taxonomic sample (Martinelli and Rougier Reference Martinelli and Rougier2007; Watabe et al. Reference Watabe, Tsubamoto and Tsogtbaatar2007; de Oliveira et al. Reference de Oliveira, Soares and Schultz2010; Kammerer Reference Kammerer2016; Martinelli et al. Reference Martinelli, Eltink, Da-Rosa and Langer2017a,Reference Martinelli, Kammerer, Melo, Paes Neto, Ribeiro, Da-Rosa, Schultz and Soaresb,Reference Martinelli, Soares, de Oliveira, Rodrigues and Schultzc; Melo et al. Reference Melo, Martinelli and Soares2017; Panciroli et al. Reference Panciroli, Walsh, Fraser, Brusatte and Corfe2017; Supplementary Data 2), containing 85 valid species of nonmammalian cynodonts, using the matrix representation with parsimony (MRP) method (Baum Reference Baum1992; Ragan Reference Ragan1992). The MRP matrix was analyzed in TNT v. 1.1 using the new technology search incorporating the drift, sectorial search, and fusion algorithms. The minimum tree length was searched for 100 times. In all, 427 most parsimonious trees (mpts) were identified, 100 of which were selected at random for subsequent analyses. The selected mpts were time calibrated using the method of Lloyd et al. (Reference Lloyd, Bapst, Friedman and Davis2016), itself an expansion of a method put forward by Hedman (Reference Hedman2010), implemented in R v. 3.3.2 (R Core Team 2016). This is a Bayesian approach using the ages of successive stratigraphically consistent outgroup taxa relative to the age of the node of interest to make inferences about the quality of sampling; large gaps between the age of the node of interest and that of the outgroups imply a poorly sampled fossil record, and therefore the age of the node of interest may be inferred to be older. Lloyd et al. (Reference Lloyd, Bapst, Friedman and Davis2016) designed a procedure whereby this approach could date an entire tree rather than just a specific node. Three successive outgroups were used to date the root node: the first appearance of Therocephalia in the Wordian (Abdala et al. Reference Abdala, Rubidge and van den Heever2008) and the first appearance of Anomodontia and Dinocephalia in the Roadian (Liu et al. Reference Liu, Rubidge and Li2009). A hard lower bound of 324.7 Myr was placed on the root of the tree: the age of the split between synapsids and sauropsids identified by molecular dating (Dos Reis et al. Reference Dos Reis, Donoghue and Yang2016). While this age may seem overly conservative, potentially allowing cynodonts to originate in the Carboniferous, this is the only node for which molecular data can be used to place an absolute maximum on the origin of this clade (see Supplementary Data 3 for the time-calibrated trees and the posterior distribution of ages for each node).
A, Supertree of nonmammalian cynodonts—strict consensus of the 427 most parsimonious trees. B, A randomly selected example of the time-calibrated trees used to illustrate temporal branching patterns.

A third method to estimate diversity is shareholder quorum subsampling (SQS), a subsampling method in which specimens are drawn until a fixed coverage (proportion of the individuals in the original sample represented by species drawn in the subsample) is attained, measured by Good's u (Alroy Reference Alroy2010). While the concept of coverage-based subsampling has been shown both by empirical and simulated data to be a more accurate method of inferring diversity than rarefaction and modeling approaches (Alroy Reference Alroy2010; Chao and Jost Reference Chao and Jost2012; Close et al. Reference Close, Evers, Alroy and Butler2018), it has been shown to be unreliable at low levels of coverage, particularly when abundance distributions are more uneven (Close et al. Reference Close, Evers, Alroy and Butler2018). The small size of the cynodont data set, and the large number of singleton taxa, means this method is not ideal, and the PDE is better suited to this particular data set. Nevertheless, SQS was applied to the data set as a comparison, using version 3.3 of the code available on the website of John Alroy (Reference Alroyn.d.). Six quorum levels were used: 0.4–0.9 at intervals of 0.1. The species abundances necessary for calculating Good's U were drawn from the Paleobiology Database via the fossilworks platform (http://fossilworks.org) and are included in Supplementary Data 1.
Character Completeness Metric
In recent years, more attention has been given to how the completeness of the specimens available for study can affect our interpretations of the fossil record. Because specimens are the “raw data” for taxonomic assignments, and by extension diversity estimates, the quality of the specimens available, unsurprisingly, has strongly influenced species-richness curves. For this reason, a new class of completeness metrics has been developed and refined during the last decade to assess the amount of anatomical information preserved in the available specimens and show how reliable the taxonomic assignments in a clade may be.
The character completeness metric (CCM) of Mannion and Upchurch (Reference Mannion and Upchurch2010) has been used to examine these issues in a variety of terrestrial clades, including many showing temporal overlap with cynodonts, for example, sauropodomorphs (Mannion and Upchurch Reference Mannion and Upchurch2010), anomodonts (Walther and Fröbisch Reference Walther and Fröbisch2013), parareptiles (Verrière et al. Reference Verrière, Brocklehurst and Fröbisch2016), and pterosaurs (Dean et al. Reference Dean, Mannion and Butler2016). The CCM attempts to quantify the amount of phylogenetic information available for each species by calculating the proportion of morphological characters used in phylogenetic analyses that can be scored for a species. Curves of completeness through time can then be created by finding the mean or median CCM score of all species in a time bin. Comparison of such curves to diversity estimates may be used to assess the impact of taxonomic practices and variable preservation quality on our interpretations of the fossil record.
A number of different implementations of the CCM have been developed since its original publication. The first distinction is between the CCM1 and CCM2 (Mannion and Upchurch Reference Mannion and Upchurch2010). The CCM1 of a taxon represents the proportion of characters that can be scored for the most complete specimen of that taxon, while the CCM2 represents the proportion of characters that can be scored from all available material for that taxon. Mannion and Upchurch (Reference Mannion and Upchurch2010) considered the CCM2 to be more meaningful, and it is this metric that has been used in all subsequent studies.
Two more variations of this metric have been described, dubbed CCMa and CCMb by Verrière et al. (Reference Verrière, Brocklehurst and Fröbisch2016). The first of these, developed and refined by Mannion and Upchurch (Reference Mannion and Upchurch2010) and Brocklehurst et al. (Reference Brocklehurst, Upchurch, Mannion and O'Connor2012), divides up a character list depending on what region/bone the character refers to and assigns a percentage to each region or bone depending on how many characters refer to it. If a particular taxon preserves a particular bone, it receives the relevant percentage score. The second implementation, developed by Bell et al. (Reference Bell, Upchurch, Mannion and Lloyd2013), uses published data matrices and counts the number of characters scored relative to the total number of characters. In a comparison of these metrics, Verrière et al. (Reference Verrière, Brocklehurst and Fröbisch2016) pointed out that CCMa may be distorted by the preservation quality of individual bones; if a bone is preserved, it is assumed that all characters relevant to this bone may be scored, and thus the CCM score will be higher than it should be. Nevertheless, it has advantages over CCMb in that it allows all known species to be included, rather than just those previously included in phylogenetic analyses. Therefore, it is this metric that is applied here. In any case, Verrière et al. (Reference Verrière, Brocklehurst and Fröbisch2016) found little difference in the results obtained from CCMa and CCMb, and did not even find CCMa to be consistently higher than CCMb. Hereafter, when we refer to the CCM, we will be referring to CCM2a.
A single character list was built by combining the lists from the same phylogenetic analyses used in building the supertree. Duplicate characters were removed, leaving a list of 261 characters (Supplementary Data 4). The list was subdivided into anatomical groupings based on the individual or multiple skeletal elements to which they refer (Supplementary Data 5). Using this approach, a completeness score was determined for each taxon. The median CCM score for all species occurring within a geological time bin were calculated to detect fluctuations of the quality of the cynodont fossil record though time.
Statistical Tests
The correlation between the CCM curve and the TDE was assessed using the Kendall's tau correlation coefficient. The CCM curve was also compared with a TDE containing only those species included in the supertree. Generalized differencing (McKinney Reference McKinney and McNamara1990) was applied to account for autocorrelation (the temporal nonindependence of data points).
Kendall's Tau was also used to compare the CCM scores to skull length (where available) as a proxy for size. These were taken from Huttenlocker (Reference Huttenlocker2014), with lengths of taxa described since 2014 taken from the literature. The measurements were log transformed before the correlation test. This correlation test was repeated after first transforming the values using phylogenetic independent contrasts (PIC) to correct for the phylogenetic nonindependence of taxa (Felsenstein Reference Felsenstein1985). However, it should be noted that, while correction for phylogenetic nonindependence is definitely desirable in the case of a heritable trait such as skull length, it is less clear how such methods perform when a trait potentially is not heritable or shows no phylogenetic signal (Rhieindt et al. Reference Rheindt, Grafe and Abouheif2004; Kunin Reference Kunin2008). In fact, using simulations, Kunin (Reference Kunin2008) demonstrated that, in cases in which one variable is phylogenetically independent and one is not, attempting to correct for phylogenetic nonindependence can lead to spurious results; similar results have been found in examinations of other types of autocorrelation, for example, spatial (Clifford et al. Reference Clifford, Richarson and Hemon1989). Of course, the heritability of preservation potential is not something that can be assumed but is possible. If body size was an influencing factor on preservation potential, one would expect the specimen completeness to show a phylogenetic signal, as it is under the control of a trait that also shows such a signal. On the other hand, it might be that sampling practices, for example, an increased employment of microvertebrate sampling methods, was driving the changes in specimen completeness, and therefore one would not expect completeness to be a heritable trait. It is the purpose of this study to examine these possibilities, and therefore one cannot make an a priori judgment on whether the use of PIC is appropriate or not. We therefore provide results both with and without PIC. For the latter, the log-transformed skull length and CCM values of those cynodonts included in the supertree were transformed using the pic() function in the R package ‘ape’ (Paradis et al. Reference Paradis, Claude and Strimmer2004) before applying the correlation test. This was repeated using all 100 time-calibrated trees.
The median completeness scores of cynodonts were compared with those of terrestrial contemporary terrestrial clades using Mann-Whitney U-tests. Clades that have had their CCM assessed and temporally overlap with nonmammalian Cynodontia are: Sauropodomorpha (Mannion and Upchurch Reference Mannion and Upchurch2010), Anomodontia (Walther and Fröbisch Reference Walther and Fröbisch2013), Parareptilia (Verrière et al. Reference Verrière, Brocklehurst and Fröbisch2016), and Pterosauria (Dean et al. Reference Dean, Mannion and Butler2016). Mesozoic birds also temporally overlap with nonmammalian cynodonts, but this comparison would only include five cynodonts and so was not made. For each comparison, the included taxa were limited to those that show temporal overlap, for example, when comparing cynodonts to parareptiles, parareptiles older than the Wuchiapingian and cynodonts younger than the Rhaetian were not considered.
Results
Origins of Major Clades
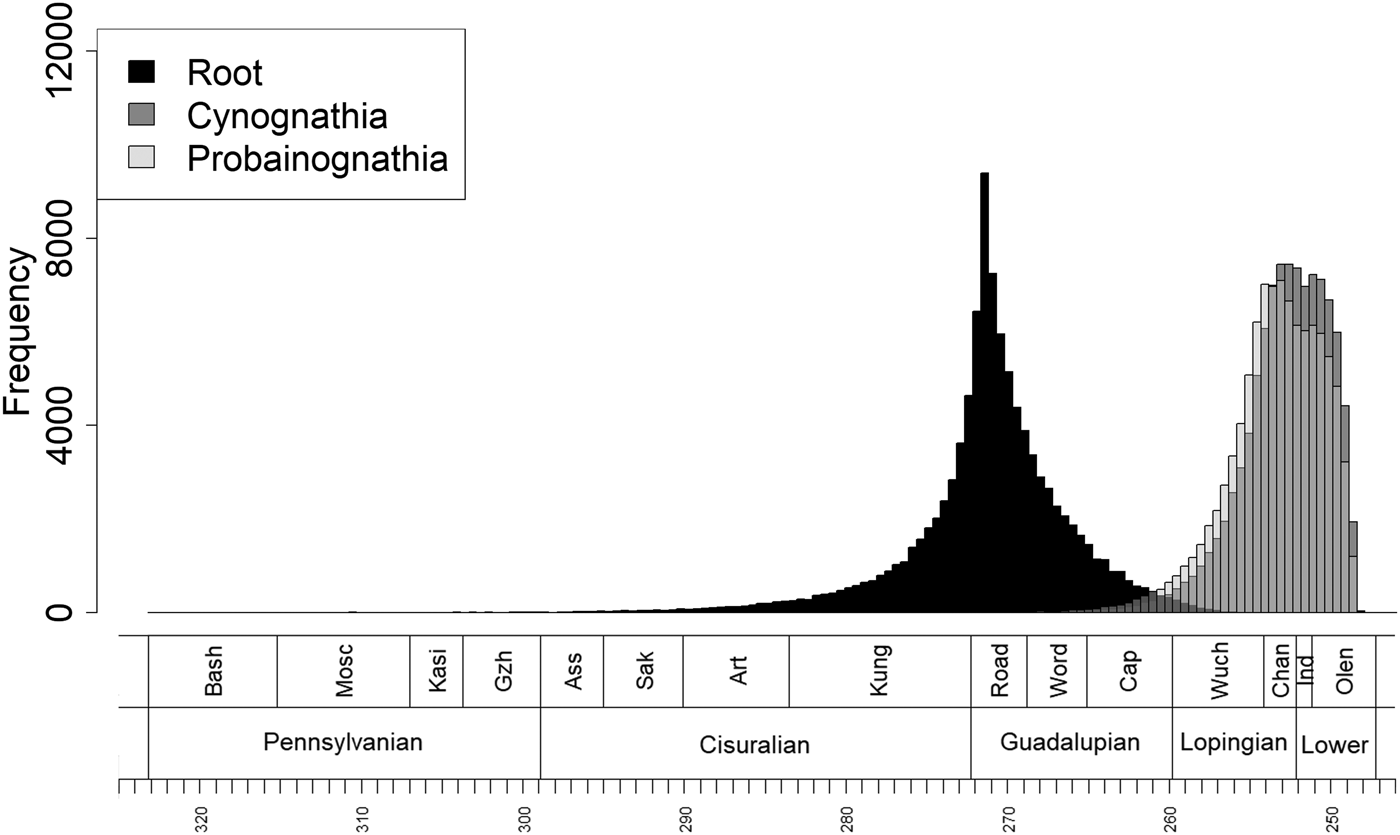
The time-calibration method produced a posterior distribution of 1000 ages for each node in each of the 100 mpts selected. Therefore, a total of 100,000 age estimates for the origin of the clade Cynodontia, as well as the two major Triassic cynodont subclades (Probainognathia and Cynognathia), were generated. These are summarized in Figure 2. The age estimates for the root of Cynodontia are concentrated around the Cisuralian/Guadalupian boundary, with a median age of 272.34 Ma (earliest Roadian). Less than 25% of the estimates are older than 275 Ma, and less than 5% are older than 285. Although the oldest cynodonts included in the tree, Abdalodon and Charassognathus, are Wuchiapingian in age (Kammerer Reference Kammerer2016), less than 1% of the root age estimates are younger than the Guadalupian/Lopingian boundary.
Histogram illustrating the range of ages identified for the origin of Cynodontia (root), Cynognathia, and Probainognathia. Abbreviations: Bash, Bashkirian; Mosc, Moscovian; Kasi, Kasimovian; Gzh, Gzhelian; Ass, Asselian; Sak, Sakmarian; Art, Artinskian; Kung, Kungurian; Road, Roadian; Word, Wordian; Cap, Capitanian; Wuch, Wuchiapingian; Chan, Changhsingian; Ind, Induan; Olen, Olenekian.

The age estimates for the root nodes of Cynognathia and Probainognathia are very similar to each other and concentrated around the Permo-Triassic boundary. The median age estimated for the root of Probainognathia is 251.9, and that of Cynognathia is 249.34 (both Induan). The estimates for both show considerably less variation than the root, presumably due to the larger number of outgroups from within Permian cynodonts to constrain them.
Diversity Estimates
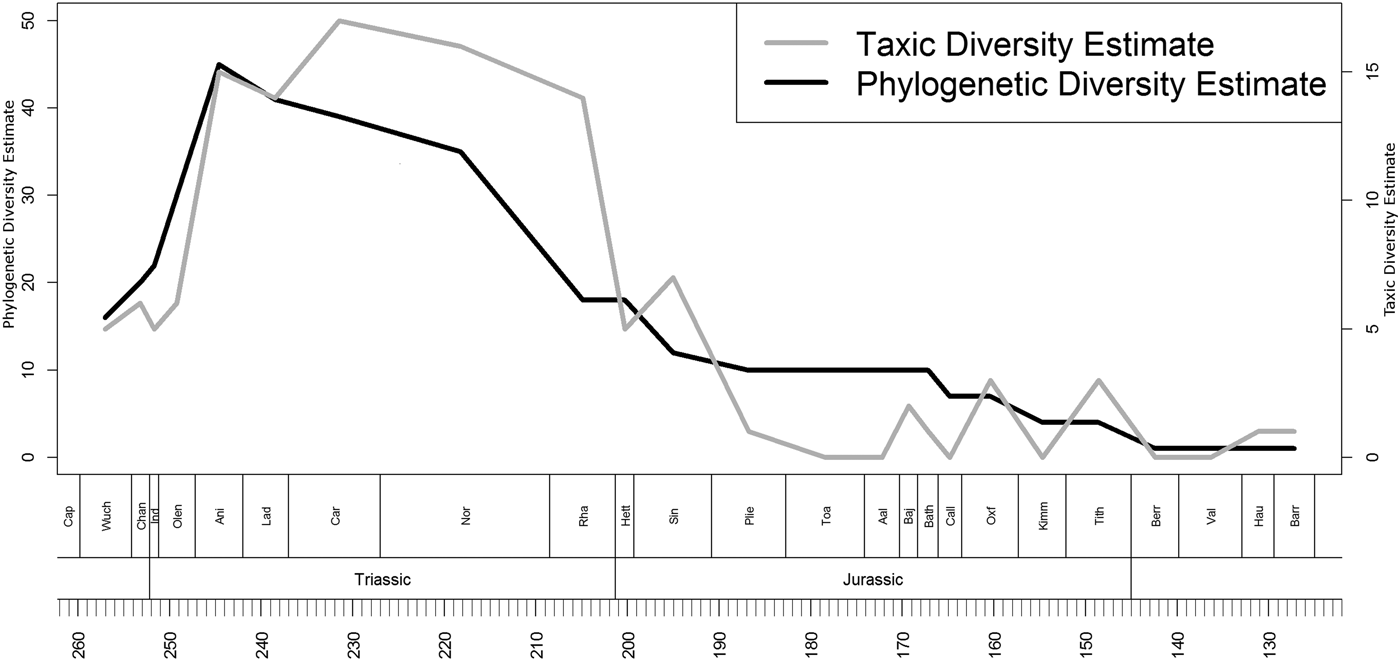
The TDE and PDE (Fig. 3) both indicate cynodont diversity increased dramatically following the end-Permian mass extinction. The PDE reaches its peak in the Anisian, falling slightly in the Carnian and Norian, while the TDE continues to rise into the Carnian and remains high until the Rhaetian. Conflicting signals are observed across the Triassic/Jurassic boundary. The TDE suggests that diversity remained high during the Rhaetian, before falling across the Triassic/Jurassic boundary. However, the PDE suggests an earlier extinction event, with low diversity in the Rhaetian, and a slight recovery during the Hettangian, followed by a second decline between the Hettangian and Sinemurian. Both curves show diversity decreasing throughout the Early Jurassic and remaining low until the Cretaceous.
Taxic and phylogenetic diversity estimates of nonmammalian cynodonts. Abbreviations: Cap, Capitanian; Wuch, Wuchiapingian; Chan, Changshingian; Ind, Induan; Olen, Olenekian; Ani, Anisian; Lad, Ladinian; Car, Carnian; Nor, Norian; Rha, Rhawtian; Hett, Hettangian; Sin, Sinemurian; Plie, Pliensbachian; Toa, Toarcian; Aal, Aalenian; Baj, Bajocian; Bath, Bathonian; Call, Callovian; Oxf, Oxfordian; Kimm, Kimmeridgian; Tith, Tithonian; Berr, Berriasian; Val, Valanginian; Haut, Hauterivian; Barr, Barremian.

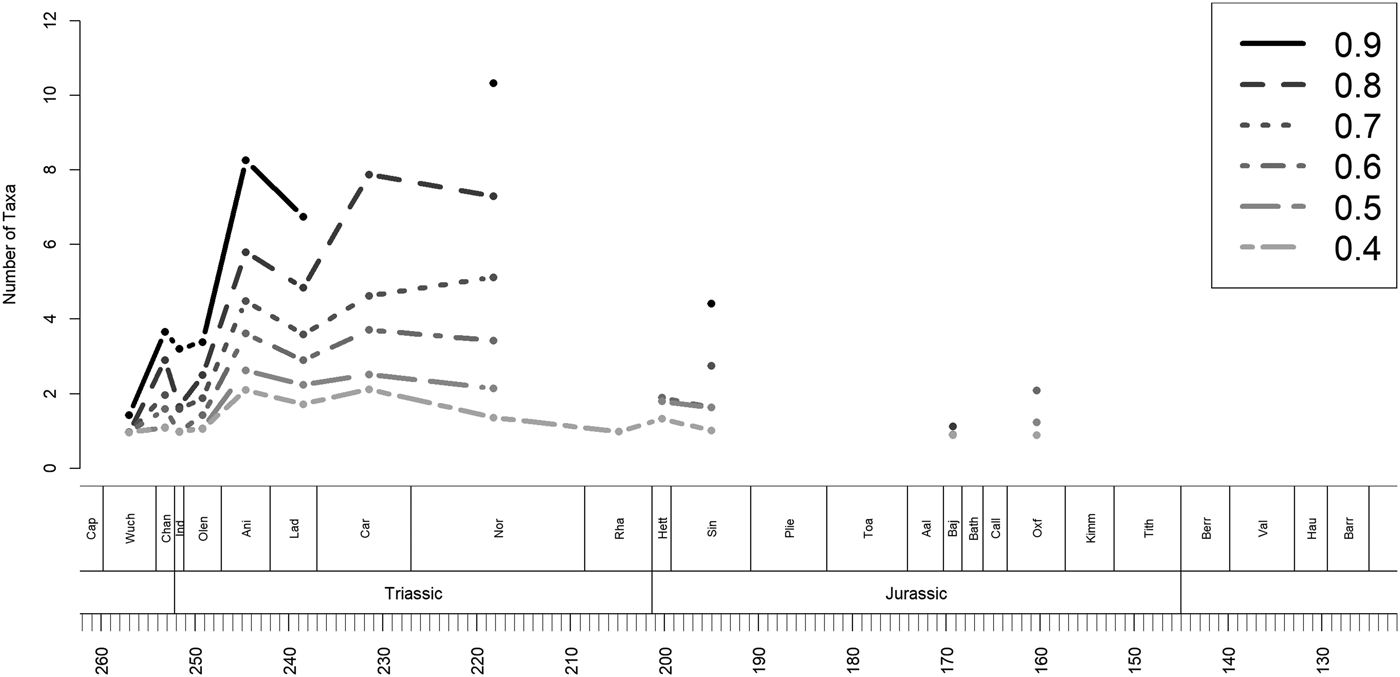
Because of the low sample sizes and large numbers of singletons during the Late Triassic and Jurassic, very few of the time bins after the Middle Triassic allow their diversity to be calculated using SQS with a quorum of 0.9. It has been suggested that results at quorum levels much below this are unreliable, particularly when abundance distributions are especially uneven. Nevertheless, the SQS diversity estimates are fairly consistent with the PDE for time bins where they can be calculated (Fig. 4). A rapid increase in diversity follows the end-Permian mass extinction to an Anisian peak. There is a brief dip in the Ladinian, followed by a period of relative stability during the Late Triassic (albeit calculated at lower quorum levels). Due to the limited Rhaetian and Hettangian data, diversity patterns during the end-Triassic mass extinction are unclear, but the pattern observed in the SQS curves does appear to be that found by the PDE: a decrease between the Norian and Rhaetian, and a slight rise in the Hettangian.
Subsampled diversity estimates of nonmammalian cynodonts. Legend indicates sampling intervals. Abbreviations: Cap, Capitanian; Wuch, Wuchiapingian; Chan, Changshingian; Ind, Induan; Olen, Olenekian; Ani, Anisian; Lad, Ladinian; Car, Carnian; Nor, Norian; Rha, Rhawtian; Hett, Hettangian; Sin, Sinemurian; Plie, Pliensbachian; Toa, Toarcian; Aal, Aalenian; Baj, Bajocian; Bath, Bathonian; Call, Callovian; Oxf, Oxfordian; Kimm, Kimmeridgian; Tith, Tithonian; Berr, Berriasian; Val, Valanginian; Haut, Hauterivian; Barr, Barremian.

Completeness
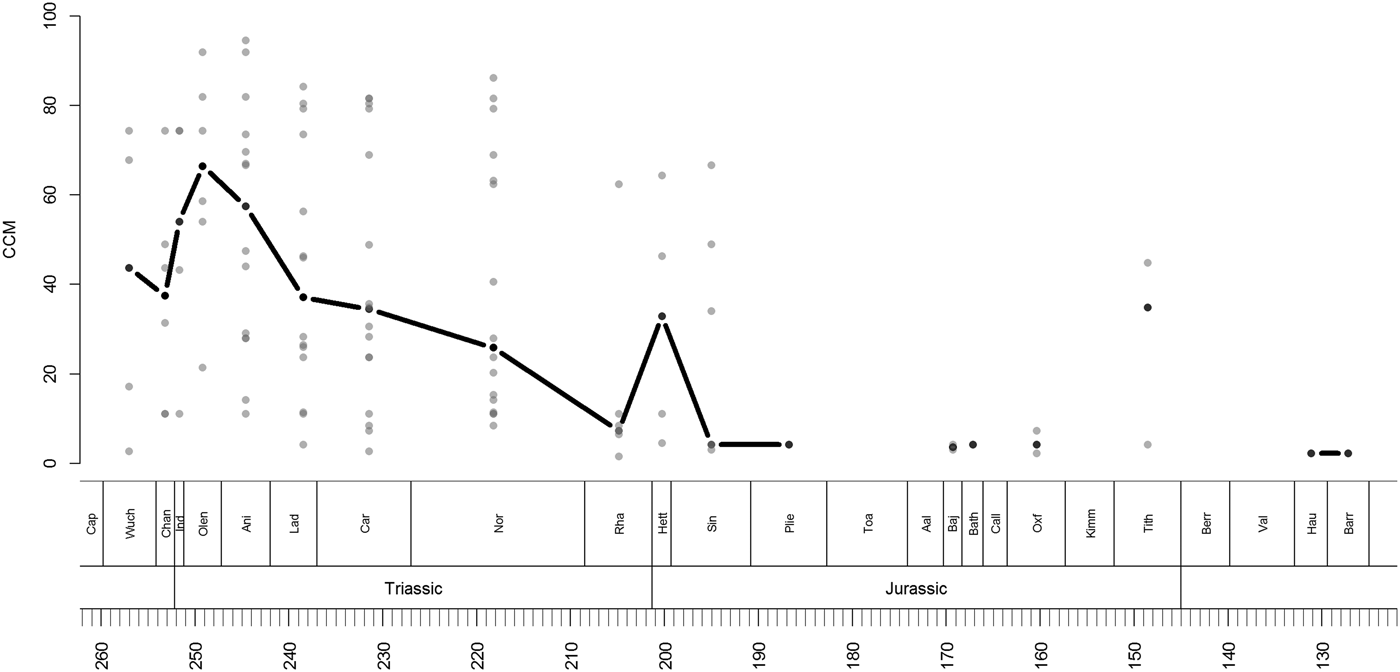
The curve of median CCM scores through time shows an increase through the late Permian and earliest Triassic to an Olenekian peak. The median completeness (Fig. 5) falls during the Middle Triassic, although the range of values observed remains consistent. The lowest Triassic value of completeness is observed during the Rhaetian, although the maximum value in this stage is only slightly lower than those of earlier stages. The median CCM score has another peak in the Hettangian, but for the rest of the Jurassic and Cretaceous, very low values more similar to the Rhaetian are observed.
CCM scores of nonmammalian cynodonts. The black line indicates the median completeness score of all cynodonts in each time bin. The grey points indicate the observed values of each species. Abbreviations: Cap, Capitanian; Wuch, Wuchiapingian; Chan, Changshingian; Ind, Induan; Olen, Olenekian; Ani, Anisian; Lad, Ladinian; Car, Carnian; Nor, Norian; Rha, Rhawtian; Hett, Hettangian; Sin, Sinemurian; Plie, Pliensbachian; Toa, Toarcian; Aal, Aalenian; Baj, Bajocian; Bath, Bathonian; Call, Callovian; Oxf, Oxfordian; Kimm, Kimmeridgian; Tith, Tithonian; Berr, Berriasian; Val, Valanginian; Haut, Hauterivian; Barr, Barremian.

The correlation tests reveal no significant correlation between the CCM curve and the TDE: a tau of 0.1029 (p = 0.5976). Also weak is the correlation between the CCM and PDE: a tau of 0.1764 (p = 0.3488).The correlation between the CCM curve containing only those species included in the supertree was stronger, with a tau of 0.3088 (p = 0.09139).
The correlation between skull length and completeness (Fig. 6) is highly insignificant, with a tau of 0.0970 (p = 0.4229). When PIC is applied to account for phylogenetic nonindependence, the strength of the correlation actually increases slightly, but is still weak. Of the 100 results obtained using the 100 time-calibrated trees, 95 of the tau values were below 0.25, and only 7 of the p-values were less than 0.05 (Supplementary Data 6).
A comparison of log-transformed skull lengths of nonmammalian cynodonts to their CCM scores.

The comparisons between CCM scores of cynodonts and other clades are shown in Table 1. Median cynodont completeness is lower than all clades examined, and significantly lower than those of anomodonts, sauropodomorphs and pterosaurs.
Comparisons of the completeness scores of nonmammalian cynodonts to those of clades with which they overlap in time.

Discussion
Using Completeness Data to Resolve Inconsistencies in Diversity Curves
Probably the most striking inconsistency between the TDE and PDE is the Late Triassic decline observed in the PDE curve compared with the high diversity observed at the same time in the TDE curve. The PDE suggests that diversity fell substantially after the Norian, reaching its lowest value since the Early Triassic, before briefly recovering during the Hettangian, followed by a second decline between the Hettangian and Sinemurian (Fig. 3). The TDE, meanwhile, suggests that diversity remained high until the end of the Triassic, and only fell during the Hettangian with a brief recovery in the Sinemurian. While it might be tempting to trust the phylogenetic diversity more due to the incorporation of sampling correction and the simulations demonstrating its better performance (Lane et al. Reference Lane, Janis and Sepkoski2005; Brocklehurst Reference Brocklehurst2015), in this case the comparison is not so simple, and research practices may be affecting both curves.
The Rhaetian cynodont record is characterized by an abundance of highly fragmentary taxa (mostly based on teeth and lower jaws) that have not been included in any published phylogenetic analysis, and hence also not in the PDE. The CCM bears this out, showing a trough in the completeness of the specimens available in the Rhaetian. In the absence of these taxa in the supertree, the PDE implies nonmammalian cynodont diversity already collapsing after the Norian rather than across the Triassic/Jurassic extinction boundary.
The conflicting Rhaetian diversity patterns, combined with the lower CCM scores, could be interpreted in two ways. (1) The poor preservation of the Rhaetian specimens, combined with a historical tendency toward oversplitting by cynodont paleontologists, has led to an overabundance of poorly defined, potentially invalid taxa being included in the TDE, while the PDE, limited to more complete, reliable taxa, produces a more accurate picture of cynodont diversity patterns. (2) The Rhaetian decline in the PDE is an artifact of poor Rhaetian preservation potential leading to a record limited to teeth, and the limited number of tooth characters has prevented the inclusion of potentially valid taxa in this diversity estimate.
While a conclusive answer to this question would require a thorough revision of the Rhaetian “tooth taxa,” the CCM data do provide indications of the taxonomic and collection practices prevalent in cynodont workers. The significant correlation between the CCM curve and the curve indicating the number of species included in phylogenetic analyses could be used to support either hypothesis. The weak, positive correlation between the CCM and TDE might be used to argue against a tendency toward oversplitting by cynodont workers. However, visual examination of the data indicates some interesting patterns that might not be revealed by correlation tests.
While the median CCM decreases substantially in the Late Triassic relative to earlier stages, the total range of values shows very little shift at all (Fig. 4). From this, one would infer that preservation potential of the tetrapod-bearing formations has not changed substantially; Late Triassic substages still contain localities with both high and low preservation potential. Indeed, other studies of the CCM that have included terrestrial Late Triassic vertebrates indicate the potential to preserve high-quality terrestrial specimens of both large, robust taxa (anomodonts [Walther and Fröbisch Reference Walther and Fröbisch2013], sauropodomorphs [Mannion and Upchurch Reference Mannion and Upchurch2010]) and small, delicate taxa (pterosaurs [Dean et al. Reference Dean, Mannion and Butler2016], procolophonids [Verrière et al. Reference Verrière, Brocklehurst and Fröbisch2016]). What is driving the decrease in median CCM is not a shift in the range of completeness values, but rather a greater concentration of species found and named based on extremely poor data. In other words, rather than the overabundance of highly incomplete taxa indicating poorer preservation potential of the tetrapod-bearing formations, it appears that there was either a shift in collection or taxonomic practices (or both) of workers studying the Late Triassic, or a shift in the evolution of cynodonts, for example, smaller body size, that has produced a preservation shift specific to certain members of this group.
If the former possibility is supported, the shift in sampling practice might be linked to the appearance of a fossil record for mammals in the Late Triassic. Mammal systematics has long been acknowledged to be dominated by dental characters, and the co-occurrence of both mammals and nonmammalian synapsids may have led to these taxonomic practices being applied to the latter. Moreover, an increased emphasis on sampling microvertebrate fossil sites, for example, by sieving and screen washing, characterizes the Late Triassic record, again possibly related to the need to study the earliest mammals and lepidosaurs, whose remains are rarely recovered without such methods (e.g., Sigogneau-Russell and Hahn Reference Sigogneau-Russell, Hahn, Fraser and Sues1994; Heckert Reference Heckert2004; van den Berg et al. Reference van den Berg, Whiteside, Viegas, Schouten and Benton2012). Recent discoveries of small and microvertebrates from before the Late Triassic in the Karoo Basin has highlighted the need to widen the use of such sampling practices (Kammerer Reference Kammerer2016; Gaetano et al. Reference Gaetano, Mocke, Abdala and Hancox2012). However, the taxonomy resulting from such specimens should be treated with caution. Naming taxa based on single teeth risks artificially increasing the diversity estimate by including multiple taxa defined on teeth from different positions in the jaw or artificially lowering the diversity estimates due to the high rate of convergence in tooth morphology (Kangas et al. Reference Kangas, Evans, Thesleff and Jukka2004; Sansom et al. Reference Sansom, Wills and Williams2017).
A final issue that should be discussed is the impact of body size on preservation; a trend toward smaller body size in the Late Triassic might have reduced preservation potential. The paucity of the correlation between skull length and completeness would imply that this is not the case (although it should be noted that the “tooth taxa” could not be included in this analysis due to the difficulties in estimating their size), and recent studies have shown the relationship between body size and preservation potential is more complicated than a simple positive correlation between the two: smaller animals are easier to destroy, but also easier to bury rapidly and completely, so their preservation is favored by Konservat-Largerstätte modes of preservation (Brocklehurst et al. Reference Brocklehurst, Upchurch, Mannion and O'Connor2012; Dean et al. Reference Dean, Mannion and Butler2016). However, in the absence of such modes of preservation in the Late Triassic, small taxa are primarily derived from microvertebrate sites, where preservation is often highly fragmentary and dominated by teeth.
The possibility of a reduction in body size of cynodonts during the Late Triassic that might have driven the shift in preservation quality would require more detailed study on this group than has thus far been carried out. Two previous studies, both fitting models of trait evolution to phylogenies, have supported an early-burst model of evolution as best fitting cynodonts (Sookias et al. Reference Sookias, Butler and Benson2012; Huttenlocker Reference Huttenlocker2014). While it should be noted that both studies only tested four models, not incorporating more sophisticated options with shifts in rate or mode of evolution at specific points in time, the support for the early-burst model would imply that the majority of body-size disparity was established early in the cynodonts’ evolutionary history, with rates of evolution considerably slowed by the Late Triassic. A visual examination of the traitgrams of Huttenlocker (Reference Huttenlocker2014) might lead one to infer the widespread extinction of the larger taxa in the later Triassic, but one should be wary about such interpretations. Inferences about body-size evolution are not independent of sampling practices, and more widespread sampling of microvertebrate sites will obviously increase the prevalence of small taxa. Of course, the inverse is also true: a trend toward smaller body size might drive an increased sampling of microvertebrate sites (the workers following the fossils), but it should be reiterated that there has been very little effort to even attempt to carry out microvertebrate sampling in the latest Permian and Early Triassic (Kammerer Reference Kammerer2016). On the rare occasions that such sampling has been carried out, microvertebrate remains representing previously unknown taxa have been found (Abdala et al. Reference Abdala, Mocke and Hancox2007; Gaetano et al. Reference Gaetano, Mocke, Abdala and Hancox2012), again implying that it is the shift in sampling practices that drives the prevalence of small taxa in the Late Triassic.
It is also worth noting that the median completeness is not necessarily independent of diversity. It has been suggested that the probability of high-quality species preservation may be influenced by the diversity and abundance of taxa (Brocklehurst et al. Reference Brocklehurst, Upchurch, Mannion and O'Connor2012). In this context, if we assume (as argued earlier) that the inferior quality of the Rhaetian specimens is not due to low preservation potential in this time bin, it is entirely possible that the low CCM score reflects a poor preservation probability driven by a dwindling number of cynodonts actually being present at that time. Thus, the PDE would be indicating a genuine diversity signal, while the high taxic diversity would be an artifact of naming many species based on inadequate material. This argument may be extended to the post-Hettangian record.
Overall, the completeness of the cynodont record is relatively poor compared with their contemporaries (Mannion and Upchurch Reference Mannion and Upchurch2010; Walther and Fröbisch Reference Walther and Fröbisch2013; Dean et al. Reference Dean, Mannion and Butler2016; Verrière et al. Reference Verrière, Brocklehurst and Fröbisch2016). The anomodonts, another therapsid clade with which the cynodonts shared much of their history, consistently exhibit higher CCM values during their period of overlap (Walther and Fröbisch Reference Walther and Fröbisch2013). In fact, in none of the time bins in which both clades co-occur does the cynodont CCM exceed that of anomodonts, or even exceed the overall mean anomodont completeness. The median CCM score of all cynodont taxa is also less than that observed in the majority of other clades to which this method has been applied (Mannion and Upchurch Reference Mannion and Upchurch2010; Walther and Fröbisch Reference Walther and Fröbisch2013; Dean et al. Reference Dean, Mannion and Butler2016; Verrière et al. Reference Verrière, Brocklehurst and Fröbisch2016).
Cynodont Diversity Patterns
Despite a highly conservative age constraint being placed on the time calibration of the tree (with the root allowed to extend as far back as the origin of crown Amniota), the PDE does not support the extension of large numbers of lineages only observed in the Triassic fossil record back before the end-Permian mass extinction. The TDE, PDE, and SQS diversity estimates all support previous assertions of a substantial radiation following the end-Permian mass extinction, with peak phylogenetic diversity reached in the Anisian (e.g., Abdala and Ribeiro Reference Abdala and Ribeiro2010; Fröbisch Reference Fröbisch, Kammerer, Angielczyk and Fröbisch2014). The study of Abdala and Ribeiro (Reference Abdala and Ribeiro2010), despite focusing only on Gondwanan cynodonts and not employing sampling correction, also found an Anisian peak in cynodont diversity. Both of the two major Triassic cynodont lineages, Cynognathia and Probainognathia, appear to have originated at this time; the time-calibrated trees give a range of ages of the roots of both these clades straddling the Permian/Triassic boundary (Fig. 2), with median ages just following the extinction event. The postextinction radiation appears to have been driven primarily by cynognathians and non-eucynodonts; the probainognathians do not appear in the fossil record until the Middle Triassic.
The diversity of Cynodontia remained high throughout the Middle Triassic and the earliest part of the Late Triassic (Fig. 3). The Cynognathia declined after the Middle Triassic, although at least one taxon (Scalenodontoides) survived into the Norian. The Probainognathia (the lineage that ultimately gave rise to the mammals) diversified during the Carnian. Abdala and Ribeiro (Reference Abdala and Ribeiro2010) suggested a Carnian peak in cynodont diversity that is supported in the TDE but not the PDE. The earlier peak in the PDE might indicate that the Carnian peak in the TDE is an artifact of sampling bias, but it should be noted that the PDE is biased toward higher diversity earlier in time (Lane et al. Reference Lane, Janis and Sepkoski2005), as this method can only extend observed ranges backward in time. Unfortunately, SQS diversity estimates at this time can only be calculated at low quorum levels, and so could be unreliable, but they do appear to support a Carnian peak as well.
As discussed earlier, however, nonmammalian cynodonts do not maintain their high diversity until the end of the Triassic, but instead appear to have suffered a considerable loss in their diversity in the Rhaetian. Interestingly, an analysis of phylogenetic morphological diversity (disparity) of nonmammalian cynodonts indicated that disparity also declined during the Norian and Rhaetian (Ruta et al. Reference Ruta, Botha-Brink, Mitchell and Benton2013).
It is worth reminding ourselves at this point that this study is being carried out on a paraphyletic grouping; the mammals, which appear in the fossil record in the Late Triassic (Luo Reference Luo2007), are contained within the cynodonts. However, the rapid decline in nonmammalian cynodonts observed here does not appear to simply represent their replacement by more derived mammals. Mesozoic mammal richness was examined by Newham et al. (Reference Newham, Benson and Upchurch2014) using a variety of sampling correction methods, none of which indicated any substantial increase in mammal diversity until the Late Jurassic.
The end-Triassic mass extinction is a poorly understood event in the terrestrial realm, with its timing poorly constrained (Hallam Reference Hallam1990; Pálfy et al. Reference Pálfy, Mortensen, Carter, Smith, Friedman and Tipper2000; Deenen et al. Reference Deenen, Ruhl, Bonis, Krijgsman, Kuerschner, Reitsma and Van Bergen2010). Some published diversity estimates of terrestrial vertebrates have suggested a steady decline in diversity throughout the Norian and Rhaetian rather than a single event at the end of the Rhaetian (e.g., Benton et al. Reference Benton, Ruta, Dunhill and Sakamoto2013; Brocklehurst et al. Reference Brocklehurst, Ruta, Müller and Fröbisch2015). The decline in nonmammalian cynodonts appears to occur after the Norian rather than at the very end of the Triassic, and it is also at this time that the other surviving synapsid lineage, the Anomodontia, disappear from the fossil record (Fröbisch Reference Fröbisch2008).
Conclusions
This study provides novel insights into the diversity patterns and fossil completeness of cynodonts and highlights the importance of systematic practices in determining the results of macroevolutionary studies. It has been demonstrated that such practices are not consistent across workers studying different clades (“lumping” vs. “splitting”; Mannion and Upchurch Reference Mannion and Upchurch2010; Brocklehurst et al. Reference Brocklehurst, Upchurch, Mannion and O'Connor2012; Brocklehurst and Fröbisch Reference Brocklehurst and Fröbisch2014), and here it is established that they are not even consistent within a single clade. These issues not only affect the raw diversity estimates, but, as noted earlier, have the potential to influence the sampling-corrected diversity estimates. Although we interpret the PDE results for Cynodontia to be an accurate depiction of their species richness through time, this does not negate the necessity of examining these issues. It is vital that systematic and collection practices be examined alongside studies of species richness, and it is in this context that completeness metrics such as the CCM are extremely powerful tools.
Acknowledgments
This study was financially supported by a Sofja Kovalevskaja Award of the Alexander von Humboldt Foundation donated by the German Federal Ministry for Education and Research to J.F. and grants from the Deutsche Forschungsgemeinschaft to J.F. (FR 2457/5-1) and to C.F.K. (KA 4133/1-1). We thank the anonymous reviewers for their helpful comments and discussion.