Implications
Sensor technologies, such as tri-axial accelerometers, could provide valuable information on animal health, behaviour and welfare, and consequently, on management practices. The present study introduces an optimized method for classifying different types of gait (walking, trotting and galloping) and posture (standing and lying) in sheep, using a tri-axial accelerometer. Data optimization with this method is based on identification of the most relevant data on one axis of the accelerometer, for classification of gait and posture. The algorithm developed with this approach can be integrated into sensor devices, which can create the basis for simple, cost-effective monitoring of animals.
Introduction
Observation of the locomotion and posture of an animal is the first step in inspecting its general condition, and can be used as one indicator of overall health and behaviour (Moreau et al., Reference Moreau, Siebert, Buerkert and Schlecht2009; Weary et al., Reference Weary, Huzzey and von Keyserlingk2009). Moreover, the activity level and energy expenditure of an animal (Lachica and Aguilera, Reference Lachica and Aguilera2005) is indicative of the management and housing conditions to which it is subjected (Ito et al., Reference Ito, Weary and von Keyserlingk2009; Ledgerwood et al., Reference Ledgerwood, Winckler and Tucker2010) at both the individual and herd levels. The definition of gait suggests that terrestrial locomotion is a continual cycle of repeated movements, manifested as strictly defined patterns of leg movement (Alexander, Reference Alexander1989).
When patterns of locomotion and body postures are considered, observations of only one or a few key points on the leg can provide sufficient temporo-spatial information for the entire body of the animal. Animals must be undisturbed in an environment or surroundings to which they are accustomed for accurate assessment of locomotion and posture; therefore, these assessments can be quite challenging and difficult in free-ranging animals, animals on pasture and wild animals. Sheep are highly social animals, usually reared on mountains or grassland areas that are difficult to access, thereby making constant daily observation impractical (Moreau et al., Reference Moreau, Siebert, Buerkert and Schlecht2009; Bojkovski et al., Reference Bojkovski, Stuhec, Kompan and Zupan2014). Therefore, the quest for the most reliable method to observe sheep and other flock animals continues to be a challenge, even in the context of modern farming.
Sensor technology with automated recordings, such as accelerometer technology, is a tool used for the automatic determination of locomotion and posture in animals (Blomberg, Reference Blomberg2011). The applicability of accelerometers to assess locomotion and posture has been demonstrated in herd/flock animals on pasture such as cattle (de Passille et al., Reference de Passille, Jensen, Chapinal and Rushen2010; Chapinal et al., Reference Chapinal, de Passille, Pastell, Hanninen, Munksgaard and Rushen2011; Nielsen, Reference Nielsen2013) and goats (Moreau et al., Reference Moreau, Siebert, Buerkert and Schlecht2009), as well as sows (Conte et al., Reference Conte, Bergeron, Gonyou, Brown, Rioja-Lang, Connor and Devillers2014), horses (Wickler et al., Reference Wickler, Hoyt, Biewener, Cogger and De La Paz2005; Scheibe and Gromann, Reference Scheibe and Gromann2006; DuBois et al., Reference DuBois, Zakrajsek, Haley and Merkies2015) and domestic cats (Watanabe et al., Reference Watanabe, Izawa, Kato, Ropert-Coudert and Naito2005).
Accelerometers record a vast amount of data that is challenging to process and interpret; thus, data optimization is a primary objective of researchers. The manner in which the data collected by tri-axial accelerometers are processed and interpreted varies among authors, from setting the threshold and cut-off values (Ledgerwood et al., Reference Ledgerwood, Winckler and Tucker2010; DuBois et al., Reference DuBois, Zakrajsek, Haley and Merkies2015; McLennan et al., Reference McLennan, Skillings, Rebelo, Corke, Pires Moreira, Morton and Constantino-Casas2015) to wavelet analysis (Pastell et al., Reference Pastell, Tiusanen, Hakojärvi and Hänninen2009) and fast Fourier transform (Watanabe et al., Reference Watanabe, Izawa, Kato, Ropert-Coudert and Naito2005). The method of choice is highly associated with the targeted parameters to be measured. The aim of the present study was to introduce an optimized method for gait and posture discrimination, using the acceleration values recorded by a tri-axial accelerometer mounted on the hind leg of sheep.
Material and methods
Animals, accelerometers and video recordings
The animals used in the present study consisted of 13 mature sheep (10 ewes and three rams) of the local Pramenka breed, weighing 45 to 60 kg. Previous clinical and orthopaedic examinations determined that all sheep were clinically healthy, with no history or current cases of locomotory disorders. Three observational studies were conducted: standing, gait and lying. The studies for standing and gait analysis were performed at the sheep facilities of the Faculty of Veterinary Medicine in Skopje, whereas the third study was performed on a commercial flock in a mountainous region of Macedonia.
Acceleration values were recorded with a HOBO® Pendant® G acceleration data logger (Onset Computer Corporation, Pocasset, MA, USA). The device weighed 18 g and measured 58×33×23 mm3. The HOBO® Pendant® accelerometer simultaneously recorded acceleration and inclination readings on its three orthogonal axes (x, y and z), and had a measurement acceleration range of ±3.2×g (gravitational acceleration) on all three axes with a memory capacity of 64 kB. In addition, the accelerometer calculated total acceleration (TA) as a sum vector of the acceleration values (a) of the three axes as follows:
 $${\rm TA}\,{\equals}\,\sqrt {(a_{{\rm x}}^{2} {\plus}a_{{\rm y}}^{2} {\plus}a_{{\rm z}}^{2} )} $$
One accelerometer was mounted on the lateral side of the left hind leg, in the midsection of the metatarsal region of each sheep (Supplementary Figure S1). The accelerometer was positioned with the x-axis vertical and towards the ground, and the y-axis parallel to the ground and towards the rear of the animal. We used a cohesive bandage to attach the data logger to the leg of the animal. No obvious deviations in the natural position of the leg were noted during the different types of gait and posture, after the logger was mounted. Likewise, the initial position of the loggers attached to each leg showed no change during the observational studies.
The accelerometer was set to measure acceleration on three axes. Subsequent analysis was performed on data recorded on the vertical (x) and horizontal (y) axes and TA. The values of the lateral (z) axis were not analysed independently, but as part of the TA only, because of the minimal lateral leg movements during locomotion and standing. The acceleration data were read using a base station and a coupler connected to a computer. The specialized software HOBOware® Lite ©2003–2013 (Onset Computer Corporation, Bourne, MA, USA) was used for graphing and analysis.
Sheep movements and the position of the left hind leg were continually video recorded at 30 frames/s using a DVD Camcorder (Canon® DC420; Canon U.S.A., Inc., Melville, NY, USA). The accelerometer was synchronized (to millisecond accuracy) with leg movements in the video recordings, by setting the video clock as time 0 at the onset of integration of the logger with the coupler. Video processing and observations were performed using the Adobe® Premiere® Pro CS5.5 software (©1991–2011; Adobe Systems, Inc., San Jose, CA, USA).
Standing study
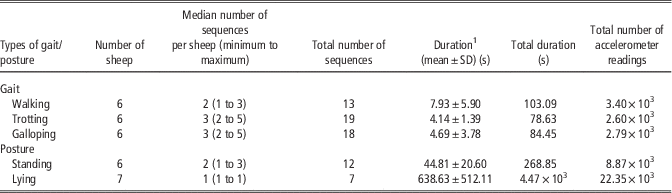
Six sheep (three ewes and three rams) were selected. The ewes (SS 1 to SS 3) and the rams (RS 1 to RS 3) were placed in separate lots (5×3 m). Sampling was done while the sheep were in a standing posture for 15 min. The accelerometer was set in the fast mode of 0.03 s (33 Hz), enabling 100 acceleration readings over a period of ~3 s. The standing analysis was performed on overall video material of 1.31×10³ s and 3.73×10⁴ acceleration readings. In this observational study, we used acceleration values of the respective axes and TA, while the animal was standing still. The mean duration per animal, the total duration of standing and the total accelerometer readings used for the standing analysis are presented in Table 1.
Number of animals, video sequences, sampling duration and total accelerometer readings used for gait and posture discrimination in sheep

1 Duration of video sequence for each type of gait (mean±SD); and duration per sheep in each posture (mean±SD).
Gait study
The second observational study was conducted for different types of gait: walking – the four-beat gait, during which each foot touches the ground at a different time and two or three feet are on the ground at any given point in time; trotting – the two-beat symmetric gait, synchronized diagonally between the hind and contralateral fore limb; and galloping – the four-beat asymmetric movement, during which all legs are off the ground at some point. The same animals in the standing study were used for the gait analysis (three ewes and three rams). The sheep were divided into two groups by gender and placed in an enclosed grass field (50×30 m), with which they were familiar from a daily routine. Using the flight zone of the sheep, one person made the animals walk, trot and gallop for 15 min. The sampling rate of the accelerometer was the same as that for the standing study, that is, 33 Hz with a sampling duration of 10 min.
Gait analysis was conducted on overall video material of 1.37×10³ s and 5.41×10⁴ accelerometer readings. Sequences of the video during which the sheep performed different gaits (walking, trotting or galloping) were identified for each animal. The corresponding acceleration values recorded on the accelerometer were subjected to further data processing. The duration, number of sequences and number of accelerometer readings for each type of gait used in this observational study are presented in Table 1.
Lying study
Seven ewes (SL 1 to SL 7) that had not been included in the previous two observational studies were selected for the lying analysis. The recordings were performed while the sheep were in their lots after feeding time. The animals under investigation were not separated from the flock. The undisturbed behaviour of the animals was observed for 2.5 h with a total of 1.52×10⁵ accelerometer readings. The sampling rate of the accelerometer was set in the fast mode of 0.20 s (5 Hz), with a sampling duration of more than 1 h. The sequences during which the animal was lying were selected and the corresponding acceleration values were analysed (Table 1).
Data processing and statistics
The acceleration values of the vertical and horizontal axes and TA in the three observational studies were processed using the Microsoft® Excel® 2010 software (©2010; Microsoft Corp., Redmond, WA, USA). The acceleration values identified for walking, trotting and galloping were classified into acceleration categories (ACs) in intervals of (n, n+1], where n is an integer and −4<n⩽6, that is, with a range from AC (−4, −3] to AC (5, 6]. Therefore, any acceleration value of a∈R in the interval of (n, n+1] is included in the AC (n, n+1], for example, if a=−1.333×g, then a∈AC (−2, −1]. Each video sequence for walking, trotting and galloping was divided into epochs of 100 acceleration readings, corresponding to ~3 s. For each epoch, the relative frequencies of the acceleration categories (RFACs) were calculated:
 $${\rm RFAC}\,(\,\%\,)\,{\equals}\,{{{\rm number}\,{\rm of}\,{\rm acceleration}\,{\rm readings}\,{\rm in}\,{\rm AC}} \over {{\rm number}\,{\rm of}\,{\rm total}\,{\rm acceleration}\,{\rm readings}\,{\rm in}\,{\rm the}\,{\rm epoch}}}{\times}100$$
The RFACs in the epochs of the vertical and horizontal axes and TA were used for the analysis of gait, standing and lying acceleration.
The forward stepwise discriminant function analysis (Klecka, Reference Klecka1980; StatSoft, Inc., 2007) was applied to determine which of the RFACs effectively discriminates between different gaits, that is, which of the ACs from the x and y axes and TA are the best predictors of gait classification (walking, trotting or galloping). The three gait types were used as dependent variables (groups). Furthermore, the mean values of the RFACs for each AC of the respective axes and TA from the classified epochs for each gait type were used as independent variables (predictors).
First, the significant differences between groups were determined using the multivariate F test. We then calculated Wilks’ λ to determine which of the predictors (RFAC means) were significantly different across the various groups and which AC best discriminated between gaits. Wilks’ λ was used to represent the significance of the discriminatory power of the model. Likewise, the partial Wilks’ λ (also referred to as the partial correlation coefficient) was calculated, which determines the unique contribution of the respective AC to gait discrimination. The value of Wilks’ λ, as well as that of the partial Wilks’ λ, is between 0 and 1, where the values closer to 0 indicate higher discriminatory power and those closer to 1 indicate lower discriminatory power.
The model (discriminant function analysis) was built as a forward stepwise analysis, that is, step-by-step addition of the variables that make the most significant contribution to discrimination between the groups. The total number of variables (predictors) included in the discriminant function was limited by the F-value of the variable (F=1) and tolerance value (1−R 2) of 0.1, thereby including a wide spectrum of ACs. The model created two discriminant functions, which were equivalent to the number of groups (gaits) minus 1, using the ACs with the highest discriminatory power. The first function indicated the gait with the greatest overall discrimination, whereas the second function performed further discrimination between the various gaits. Both functions were orthogonal.
Determination of successive discriminant functions (roots) and their eigenvalues (ratio between explained and unexplained variation in the model) was performed using canonical correlation analysis, to demonstrate the discriminatory power of both functions. Standardized (β) coefficients for each AC within the roots created by the canonical analysis indicated the level of contribution of the respective AC to discrimination between gaits; a higher standardized coefficient indicated higher discriminatory power. The means of canonical variables were used to determine the discriminative nature of each root, that is, which specific gait was identified by the corresponding root.
In order to test the model, post hoc predictions for the two axes and TA were performed using classification functions (StatSoft, Inc., 2007). More specifically, these functions classified the specific gait for each epoch. Moreover, these classification functions can serve as the basis for future application of this method in gait discrimination. Separate weights for each significant AC on the horizontal and vertical axes and TA for the three gaits, and the constant values for each corresponding gait were calculated. Subsequently, the classification score was calculated for each gait in the corresponding epoch, using the following equation:
 $$S_{g} \,{\equals}\,c_{g} {\plus}w_{{gAC1}} rf_{{AC1}} {\plus}w_{{gAC2}} rf_{{AC2}} {\plus}\,\ldots\,w_{{gACm}} rf_{{ACm}} $$
where S is the classification score for each gait, g the type of gait (walking, trotting or galloping), c the constant value for the corresponding gait, AC (1, 2 … m) the significant acceleration categories for gait discrimination, w the weight of the corresponding AC with significant contribution to the discrimination and rf the observed value of the relative frequency for the respective AC in the epoch. The epoch was then classified based on the specific gait that had the highest classification score (S g ).
The classification probabilities used to classify epochs without significant ACs were set to be proportional to the respective group size. The classification matrix was created using the classification functions and probabilities, representing both true and false identified cases (epochs) in the model. The group (gait) centroids, defined by the means of all significant variables in the model, were represented as points in multivariate space. The distance between group centroids and the testing case (epoch) was represented by the Mahalanobis distance. The classification of gait for each case was based on the closest Mahalanobis distance from the group centroid. In the analysis, we used these distances to determine the level of error in false cases, that is, to determine how far the misclassified case was from the true gait centroid.
Mean values and confidence intervals (95% CI) of the acceleration values for the vertical and horizontal axes and TA were calculated for standing and lying postures. The inter-individual differences within groups were tested with Tukey’s honest significant difference post hoc test on the mean acceleration values of the horizontal and vertical axes and TA for lying and standing; and with Kruskal–Wallis ANOVA (two-tailed) on the RFAC for gait acceleration analysis. To compare the mean acceleration values of the axes and TA for standing and lying, we used the t test for independent samples. All values in the present study were presented as mean±SD (
 $\bar{x}\,\pm\,{\rm SD}$
). Complete statistical analysis was performed using the data analysis software STATISTICA 8.0 (StatSoft, Inc., Tulsa, OK, USA).
Results
Gait study
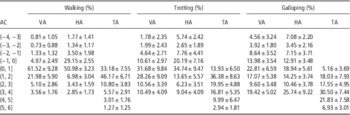
The acceleration features of the different gaits (Supplementary Figure S2) were determined based on 77 epochs from the identified sequences, that is, 26, 24 and 27 epochs for walking, trotting and galloping, respectively. The mean values of the RFACs for the vertical and horizontal axes and TA for each gait are presented in Table 2. Inter-individual differences between the RFACs of the x and y axes and TA were found only on the x-axis for ACs (−4, −3] and (1, 2] (P<0.01).
Relative frequencies per acceleration category (AC), based on vertical and horizontal axes (VA and HA) of an accelerometer and total acceleration (TA) for each gait of sheep

Values represent mean±SD.
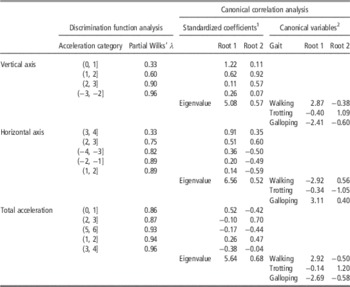
Considering the differences between RFACs of the various gaits for the x and y axes and TA, the discriminant function analysis revealed the significant ACs that discriminate walking, trotting and galloping (Table 3). According to Table 3 and Supplementary Table S1, the relative frequency values with highest discriminatory power for gait determination in one epoch belong to the following ACs: (0, 1], partial Wilks’ λ=0.33, on the vertical axis; (3, 4], partial Wilks’ λ=0.33, on the horizontal axis; and (0, 1] and (1, 2], partial Wilks’ λ of 0.86 and 0.87, on the TA.
Significant acceleration categories, identified by discriminant function analysis and canonical correlation analysis, with levels of discriminatory power for gait type determination in sheep

1 Weight of significant acceleration categories in each root with corresponding eigenvalues.
2 Means of canonical variables for gait type by each root.
The two discriminant functions for each axis and TA showed high discriminant power for gait determination, owing to their highly significant eigenvalues calculated by canonical analysis (Table 3). The first function (root) showed 90%, 93% and 89% of the overall discriminatory power for the vertical and horizontal axes and TA, respectively. The results of the standardized coefficients for canonical variables and the means of canonical variables (Table 3) on the vertical axis in the first discriminatory function showed that gait determination was most heavily weighted by the AC (0, 1], which discriminated walking from trotting and galloping, whereas the second function was mostly influenced by ACs (1, 2] and (2, 3], which discriminated trotting from galloping. Similarly, for the TA in the first discriminant function, the AC (0, 1] was dominant for discrimination of walking from trotting and galloping, whereas the second function was influenced by ACs (2, 3] and (1, 2], which discriminated trotting from galloping. The first function on the horizontal axis was heavily weighted by AC (3, 4], which discriminated galloping from walking and trotting; and the second function was mostly influenced by AC (2, 3], which discriminated trotting from walking. Based on these results, higher values of the RFAC (0, 1] on the vertical axis and on the TA in one epoch indicated a high probability of the walking gait, whereas higher values of the RFAC (3, 4] on the horizontal axis in one epoch indicated the galloping gait.
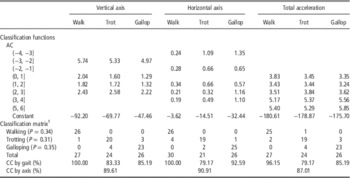
The classification functions data, weights calculated for the significant ACs and constant values for each corresponding gait are presented in Table 4. Furthermore, Table 4 presents the accuracy (%) of the classification functions in the classification matrix. The accuracy of the classification functions was highest for walking, whereas trotting exhibited the lowest accuracy on the two axes and TA. The horizontal and vertical axes showed the highest total accuracy, 90.91% and 89.61%, respectively, for all gaits. Regarding incorrect classifications of the respective gaits, trotting was misclassified as walking and galloping, and vice versa; however, there were no misclassifications between walking and galloping. According to the Mahalanobis distances in the misclassified cases, the centroid of the true gait type was close to the false gait classification. For such cases (with two exceptions), the true gait was the second choice in the classification process (Supplementary Table S2).
Classification functions, weights of the significant acceleration categories (ACs) and constant values used to calculate the classification score for each gait on the vertical and horizontal axes and total acceleration, and post hoc classification matrix and comparison of classification function findings with the true gait of sheep

P=a priori group probability set up (proportional to the group size); CC=correct cases.
1 Comparison of gait classification with classification functions and the true gait.
Standing and lying study
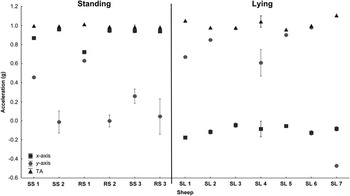
The acceleration values in different postures (standing and lying) were distributed among only a few ACs (Supplementary Figure S2). The acceleration values of the vertical axis in the standing posture were in AC (0, 1], with a mean acceleration of 0.93±0.04×g, 95% CI 0.93×g and RFAC (0, 1]=99.95%, whereas in the lying posture, the values were in AC (−1, 0], RFAC=99.50%, mean −0.09±0.05×g and 95% CI −0.09×g. The horizontal axis for the standing posture detected acceleration values in ACs (0, 1] and (−1, 0], with RFACs=76.93% and 23.07%, respectively, mean acceleration of 0.16±0.22×g, 95% CI 0.16×g; and in the lying posture the RFAC (0, 1]=79.82% was dominant over the RFAC (−1, 0]=17.91%, with a mean acceleration of 0.61±0.52×g, 95% CI 0.60×g. The acceleration values of the TA for standing were categorized in AC (0, 1] with RFAC=79.49%, and AC (1, 2] with RFAC=20.51%, with a mean acceleration of 0.99±0.02×g, 95% CI 0.99×g; and the mean acceleration for lying was 1.02±0.06×g, 95% CI 1.01×g, with more equally distributed RFAC values for ACs (0, 1] and (1, 2] of 56.01% and 43.98%, respectively.
The mean accelerations of the vertical and horizontal axes and TA showed differences between standing and lying postures (P<0.001). The largest observable difference in mean acceleration values between the two postures was evident on the vertical axis (Figure 1). In addition, significant differences between individuals within respective groups were observed in mean acceleration values of the standing and lying postures on all vectors (P<0.01). All animals were lying on their left sides (the leg on which the logger was mounted) during observation and all acceleration values were in AC (0, 1], with the exception of sheep SL 7, which was lying on its right side. Consequently, the horizontal axis showed a negative mean acceleration with values in AC (−1, 0] (Figure 1).
Acceleration values for standing and lying measured by a tri-axial accelerometer mounted on the left hind leg of sheep. The figure shows the acceleration values (mean±SD) on the vertical (x) and horizontal (y) axes, and the total acceleration (TA) for each sheep (ewes SS 1 to SS 3 and rams RS 1 to RS 3 for standing; ewes SL 1 to SL 7 for lying).

Discussion
The method described for gait and posture discrimination represents a unified, precise approach in data analysis that is presently an imperative in motion sensor technology for animals. This non-invasive technique facilitates detailed, accurate data collection on animal locomotion. Discriminant analysis revealed that the type of gait could be determined by RFACs from several significant ACs per axis and vector. More specifically, four ACs for the vertical axis and five ACs for the horizontal axis or the TA vector are sufficient to determine the gait.
Regarding the accuracy of the method in gait discrimination, the predictions made for walking showed the highest accuracy, whereas those made for trotting showed the lowest accuracy. These findings are consistent with those of other studies that report that trotting is generally the most difficult gait to determine (Alexander, Reference Alexander1989; de Passille et al., Reference de Passille, Jensen, Chapinal and Rushen2010). The a priori probability setup can influence the incorrect classification of gaits. For example, in one epoch of the present study, trotting was misclassified as walking on the horizontal axis, although the Mahalanobis distance indicated trotting (Supplementary Table S2). Overall, the gait can be determined with high accuracy, by calculating the classification scores using only one axis or vector and the RFACs of the appropriate ACs in a 3-s epoch (equation (3)).
A strongly distinctive acceleration pattern was observed on the vertical axis for standing and lying, where the acceleration values occurred in two different ACs. These findings, including the mean acceleration values on the vertical axis, are consistent with those of Robert et al. (Reference Robert, White, Renter and Larson2009). Our findings are also consistent with the cut-off values for standing and lying reported by Ledgerwood et al. (Reference Ledgerwood, Winckler and Tucker2010) in cattle and DuBois et al. (Reference DuBois, Zakrajsek, Haley and Merkies2015) in domestic horses. Because of the considerable change in the angle of the accelerometer (from 180° while standing to <90° while lying, in the present study) and the influence of gravitational force, the vertical axis exhibited strong distinction between these two postures of the animal. Nevertheless, this axis probably cannot be used to determine whether the animal is lying on the right or left side. Therefore, Ledgerwood et al. (Reference Ledgerwood, Winckler and Tucker2010) relied on the lateral axis (z-axis) to detect the side of lying. The horizontal axis showed no strong discrimination between standing and lying with considerable variation within groups, which is consistent with the findings of previous studies (Robert et al., Reference Robert, White, Renter and Larson2009; Ledgerwood et al., Reference Ledgerwood, Winckler and Tucker2010). Nevertheless, we found considerable distinction on the horizontal axis with respect to the lying side. If the accelerometer is mounted on the leg as described in the present study, the horizontal axis will show higher values of acceleration, because the angle of the leg would be close to 180° on this axis, while the animal is lying on the same side on which the accelerometer is mounted. In contrast, if the angle of the leg is <90°, lower values of acceleration and AC would be observed. Owing to the static position of the leg while lying and standing, the TA showed similar acceleration values for both postures; therefore, the TA should not be considered as an indicator for posture determination. The posture analysis suggests that the RFACs on the two axes and TA are associated with only a few ACs ((−1, 0], (0, 1] and (1, 2]), in contrast to the RFAC distribution for the respective gaits that provide appropriate distinction between moving and static postures of the animal. The acceleration values for the gait of the animal are generally widely distributed along the appropriate axis or TA vector, depending on the duration of contact between the leg of the animal and the ground within one epoch. This duration strongly influences the selection of significant ACs and gait discrimination.
The mathematical approach using the relative frequencies of acceleration values distributed within ACs in a time-dependent period of 3 s (one epoch) facilitates (i) compression of a substantial amount of data recorded by the accelerometer into a relatively small number of class intervals for easier interpretation and processing; and (ii) higher accuracy of gait and posture classification, because of a disregard for the minor variations in acceleration values, due to different temporo-spatial sampling points within an epoch. The use of relative frequencies, instead of absolute acceleration values, has been suggested by Scheibe and Gromann (Reference Scheibe and Gromann2006). Moreover, application of the short-time Fourier transform (Watanabe et al., Reference Watanabe, Izawa, Kato, Ropert-Coudert and Naito2005) and wavelet analysis (Pastell et al., Reference Pastell, Tiusanen, Hakojärvi and Hänninen2009) by other authors confirms the approach of disregarding single absolute acceleration values in data interpretation. Our results also confirmed that the use of RFACs instead of absolute acceleration values within a given time interval is a reliable approach to create an algorithm for gait and posture detection in animal. Thus, based on the RFACs within one epoch, the first step in the decision tree will be to make the distinction between mobile and static states of the animal, followed by gait or posture discrimination.
One of the major challenges in accelerometer applications and data interpretation is devising a method to reduce the amount of recorded data, without compromising the accuracy of the results, particularly in portable devices with limited memory (Wilson et al., Reference Wilson, Shepard and Liebsch2008). Therefore, the sampling rate of the accelerometer should be optimized. Very high sampling frequencies that produce large amount of data will not necessarily increase the accuracy of the results (Robert et al., Reference Robert, White, Renter and Larson2009). In contrast, lower sampling rates might fail to identify certain gaits (Trenel et al., Reference Trenel, Jensen, Decker and Skjoth2009). Thus, compliance with the Nyquist–Shannon sampling theorem, that is, the sampling rate should be at least twice that of the highest frequency contained in the signal (Nyquist, Reference Nyquist1928; Shannon, Reference Shannon1949), is critical for the accuracy of data interpretation. In the present study, we used a sampling rate of 33 Hz, which has also been suggested by de Passille et al. (Reference de Passille, Jensen, Chapinal and Rushen2010).
The amount of data recorded by the accelerometer is also influenced by the number of axes involved in the sampling, which justifies the need to select the most reliable axis for identification of specific behaviours. The approach of sampling from a single axis has been suggested by de Passille et al. (Reference de Passille, Jensen, Chapinal and Rushen2010), who proposed that the horizontal (forward) axis was the most reliable. The duration of the time interval (epoch) is of equal importance in optimizing the amount of data and accuracy of classification. In the method of the present study, we used epochs of 3 s, which is considered a minimal time interval with the lowest levels of misclassification during walking (Robert et al., Reference Robert, White, Renter and Larson2009; Nielsen et al., Reference Nielsen, Pedersen, Herskin and Munksgaard2010). The present method was guided by the aforementioned aspects to optimize the amount of data recorded by the accelerometer. Integration within the accelerometer of an algorithm based on this method could substantially resolve the challenges posed by large amounts of data. In addition, where the circumstances permit, this method could be integrated into accelerometers that use wireless data transfer. Nevertheless, the battery life of the accelerometer would remain a challenge for longer, more practical durations in animal studies.
A relatively small number of animals was used in the present study, merely to develop the proposed method for data interpretation. Further study on a larger number of subjects should be performed for cross-validation of the classification functions, using the a priori predictions proposed by the present study. Furthermore, validation of this method in various quadruped species would contribute to the development of a unified approach for gait and posture discrimination that would facilitate wider practical usage of sensor technology.
Conclusion
Tri-axial accelerometers provide real-time gait and posture discrimination, based on the temporo-spatial position of the specific leg of the animal under observation. The RFACs can be used to determine specific gaits and postures. The vertical axis of the accelerometer discriminates walking, trotting and galloping by the four RFACs (0, 1], (1, 2], (2, 3] and (−3, −2], and distinguishes between standing and lying. This axis also exhibits high accuracy in the determination of gait, with the smallest number of RFACs. The horizontal axis with the RFACs (3, 4], (−4, −3], (2, 3], (−2, −1] and (1, 2] discriminates gait, and even though it is not reliable for posture determination, this axis identifies lying on the left and right side. The TA can be used for gait discrimination, but is insufficient for posture determination. The classification functions in the present study are reliable for gait determination, although further cross-validation should be conducted. To our knowledge, the present study establishes for the first time, an optimized method for the use of accelerometer data in gait and posture discrimination in sheep as the animal model.
Acknowledgements
The authors are deeply grateful to the associates Aleksandar Janevski and Martin Nikolovski for their help in sample collection. This study was fully supported by the Faculty of Veterinary Medicine, Skopje, Macedonia.
Supplementary material
To view supplementary material for this article, please visit https://doi.org/10.1017/S175173111600255X