


Introduction
The mass balance and extent of mountain glaciers are very sensitive to climate change (temperature and precipitation). From the end of the Little Ice Age (LIA), approximately dated to the mid-19th century, glacier extents in many regions of the Earth decreased due to a pronounced global increase in air temperature, especially since the mid-20th century (so-called ‘global warming’). Recent glacier recession has not been linear: maximal wastage was recorded in the first half of the 20th century and since the 1970s (Reference OerlemansOerlemans, 2005). The precise causes of the climate amelioration during the 20th century are not yet completely understood, but human activity and some natural changes (e.g. greenhouse gases, solar variations) are most often referred to.
Recent (past 150 years) glacier variations have been most thoroughly investigated in the ‘classical’ glacierized regions of Europe and North America. In continental Siberia, recent glacier changes have been quantified in Altai and northeast Siberia (Reference SolominaSolomina, 2000; Reference Ananicheva, Kapustin and KoreishaAnanicheva and others, 2006; Reference Surazakov, Aizen, Aizen and NikitinSurazakov and others, 2007; Reference Gurney, Popovnin, Shahgedanova and StokesGurney and others, 2008). However, little is known about changes of the more continental Kodar glaciers since the end of the LIA. Reference SolominaSolomina (2000) evaluated changes in glacier length and terminus height for northern Eurasia (including the Kodar range) from the LIA to the 1950–80s. In this study, we quantify the changes of glaciers of three mountain areas from the end of the LIA to the present, based on mapping of glacier outlines using high-resolution satellite imagery as well as analysis of the last glacier inventory.
The east Sayan glaciers were the first in East Siberia to be studied. Glaciers on the southern (Mongolian) slope of Munku-Sardyk were revealed in the 1850–70s during expeditions by G.I. Radde and A.L. Chekanovsky. However, the first regular studies of four glaciers on the southern and northern slopes of Munku-Sardyk (total area 1.68 km2) were performed by S. Peretolchin in 1896-1903 (Reference PeretolchinPeretolchin, 1908). Later, observations of Munku-Sardyk glaciers and their recent moraines were made by Reference MaksimovMaksimov (1965) and researchers of the Irkutsk Institute of Geography (Reference Kitov, Kovalenko and PlusninKitov and others, 2009). According to the glacier inventory of the USSR (Reference Sil’nitskaya and ChernovaSil’nitskaya and Chernova, 1973) based on aerial photographs of 1953-58, there are 12 glaciers with a total area of 7.7 km2 on the two studied massifs.
Glaciers of the Baikalsky ridge (BR) were discovered recently and studied by researchers of the Irkutsk Institute of Geography in the 1970-80s. Two small glaciers with a total area of - 0 .6 km2 and their moraines were first described in the field by Reference AleshinAleshin (1982) although they were not mentioned afterwards in the glacier inventory of the USSR or the World Glacier Inventory (WGI). Since that time they have not been studied.
Mountain glaciers of Kodar ridge (KR) were discovered recently and studied during 1958-59 fieldwork by Preobrazhensky (1960). A total of 31 glaciers with a total area of ~15 km2 were described. Later, based on these field data and 1948-63 aerial photographs, the Glaciology Department of the Moscow Institute of Geography compiled a glacier inventory including 30 glaciers with a total area of ~18.8 km2 (Reference Novikova, Grinberg, Novikova, Grinberg and BashlavinNovikova and Grinberg, 1972). Subsequently the list of glaciers and their parameters was corrected by Plastitin (1998) based on 1963 aerial photographs and field observations. A total of 39 glaciers with a total area of 15.25 km2 (including an exposed ice area of 11.25 km2) were presented. Recent studies of Kodar glaciers include their chemical composition (Reference Chebykin and OsipovChebykin and Osipov, 2010), mass balance (Reference Shahgedanova, Popovnin, Aleynikov and StokesShahgedanova and others, 2011), morphology and changes over recent decades (Reference OsipovOsipov, 2010; Reference Osipov, Osipova and GolobokovaOsipov and others, 2012). According to the latest study, based on 2010 Landsat imagery (Reference Stokes, Shahgedanova, Evans and PopovninStokes and others, 2013), there are 34 glaciers with a total debris-free ice area of 11.72 km2.
Study Area
In the east Sayan ridge area we studied only glaciers located on two high-mountain massifs of the southeastern edge (51.7-52.5° N, 98.8-100.6° E), Topografov peak (PT) and the Munku-Sardyk (MS) (Fig. 1). The MS (3491 m), located on the Russia-Mongolia border, is the highest peak of east Sayan. PT (3089 m) is the highest massif of meridional axis of the Bolshoy Sayan ridge.
The study area. Highest summits are shown by triangles, and weather stations by circles.
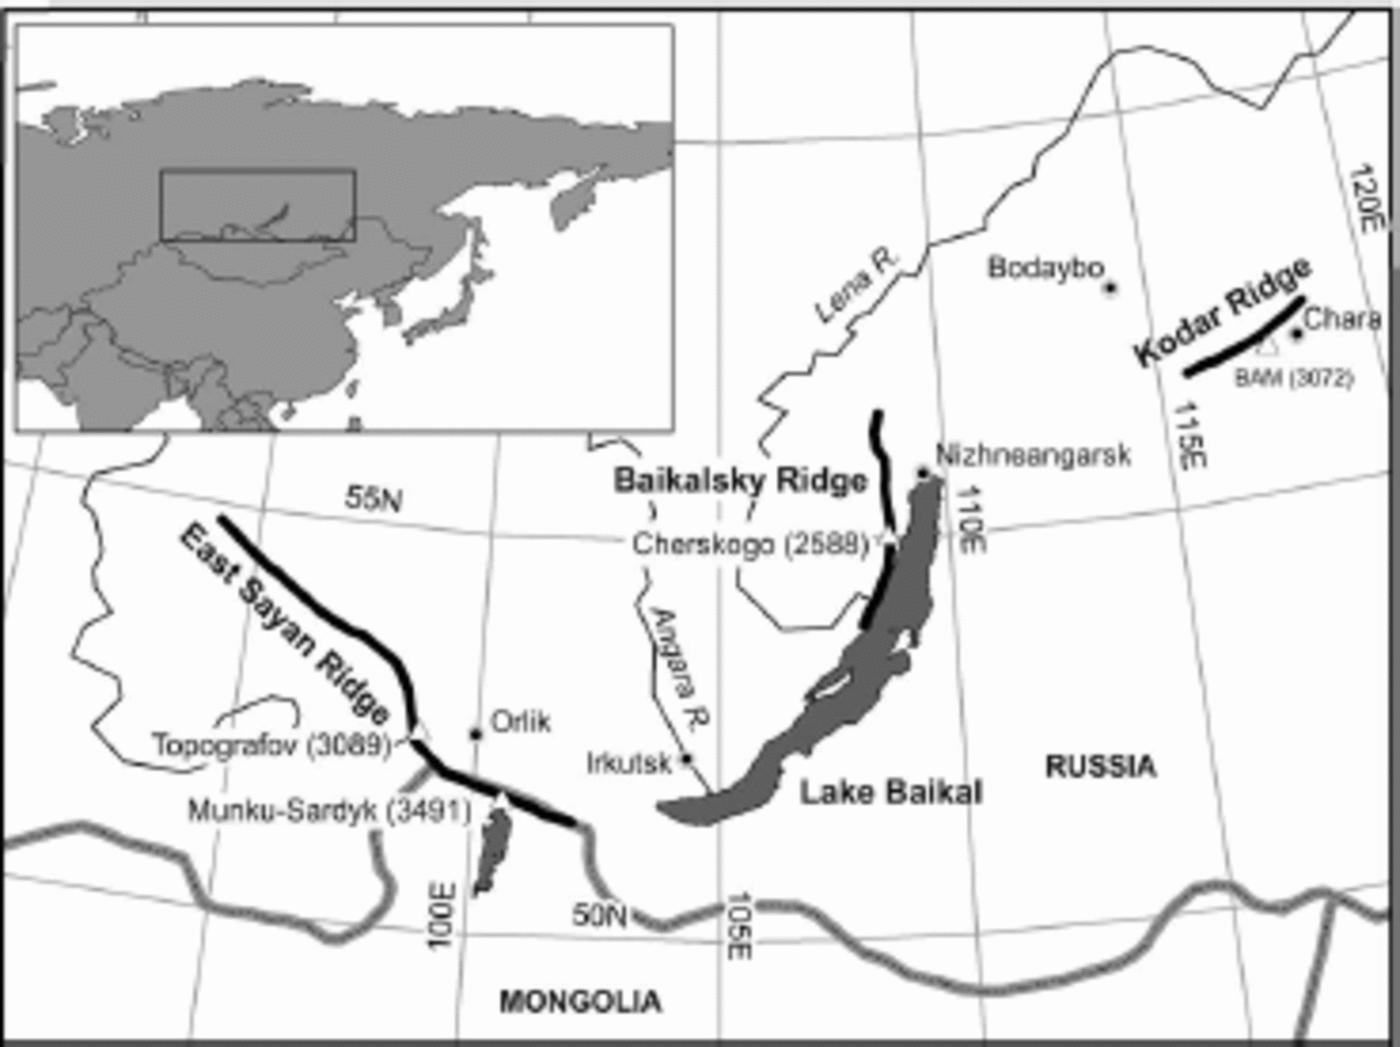
Narrow BR, with summits up to 1900-2200 m, stretches along the western coast of Lake Baikal (Fig. 1). The highest peak is Chersky mountain (2588 m) located in the central part of the ridge. There are two small glaciers on the southeast slope of Chersky mountain, in the upper reaches of the Kurkula river (55.0-55.1 0N, 108.7°E).
KR is the high mountain ridge on the northeast edge of the Baikal rift zone (Fig. 1). Some of its peaks reach 2900 m a.s.l., the highest summit being Bam peak (3072 m). Contemporary glaciers are restricted to a ~30 km x 33 km area (56.8-57.1 °N, 117.2-117.70 E).
Regional atmospheric circulation is characterized by the strong influence of the Siberian high in winter, zonal atmospheric transfer in spring and fall, and a low-gradient baric field with weak winds in summer. At Orlik station, east Sayan (Fig. 1), mean annual temperature is -4.7°C, mean winter temperature is -22.3°C and mean summer temperature is +11.7°C. Maximum precipitation (~70% of the total) occurs during the summer. At altitudes >2000m a.s.l., solid precipitation occurs from September to June, although snow flurries can occur at any time. At the Chara, Kodar (Fig. 1), the climate has prominent continental features and is characterized by cold, dry winters (-30.9°C and 11 mm precipitation) and warm, humid summers (+14.2°C and 216 mm). Mean annual air temperature is -7.5°C, and annual precipitation is 350mm. Climate conditions in the high-mountain (glacierized) area are colder and wetter, with mean annual air temperature of -15.0°C and annual precipitation of 950 mm (Reference Osipova and OsipovOsipova and Osipov, 2012).
Materials and Methods
Satellite images
For mapping of contemporary glacier outlines and moraines we used summer scenes of WorldView-1, Quick Bird-2, Cartosat-1 (IRS-P5) and Landsat-7 (Enhanced Thematic Mapper Plus (ETM+) sensor) with spatial resolution 0.5-30 m acquired from 2001 to 2011 (Table 1). All scenes were transformed to Universal Transverse Mercator (UTM) projection (World Geodetic System 1984 ellipsoidal elevation (WGS84)) and orthorectified with the Shuttle Radar Topography Mission (SRTM) digital elevation model (DEM) and GPS ground control points (up to ten points per scene) in ENVI 3.4 software. For Landsat the multispectral images were obtained from 7-5-3 band combination as this mixture allows better identification of glacier margins (Reference Gurney, Popovnin, Shahgedanova and StokesGurney and others, 2008). Panchromatic band 8 of Landsat images (15 m spatial resolution) was also used. Additionally, we applied different filters to images in ENVI 3.4 software to archive the best ‘readability’.
Satellite imagery used in this study

Mapping of glaciers
Glacier outlines were manually digitized from satellite images using GIS ArcView 3.2 software. As the lower parts of glaciers are often covered by debris, it is difficult to distinguish glacier bodies from moraine deposits and perennial snow without detailed field observations. We used the results of field companies from 2006 to 2012 and available archive pictures. During the fieldwork, glacier termini and adjacent moraines were mapped and their spatial positions were measured with portable GPS Garmin (positioning precision ±5 m). Errors in determining glacier boundaries can be quite large, so here we present the outlines of debris-free surface areas. Perennial snowpatches and icings connected with glacier bodies in the upper parts were included in the glacier geometry. As the satellite images used were obtained at the end of the summer, we also mapped snowlines as reflecting glaciological relevance.
Glacier boundaries for the LIA (-1550-1850) maximum were reconstructed from moraine deposits. There is much evidence of similar fresh-looking and unvegetated moraines bordering modern glaciers in many mountain regions of Siberia. In some areas (e.g. Altai) the moraines have been dated by 14C (Reference SolominaSolomina, 2000). In the study area the recent glacier limits are well marked by unvegetated moraines near glacier termini. To quantify the moraine ages, we measured lichen thalli diameters (Rhizocarpon Geographicum) on glacier boulders located on the tops of moraine ridges and roches moutonnees in some key sites (e.g. glaciers No. 5, No. 12 and No. 26 in Kodar and glacier No. 31 in east Sayan). Here we assign the above-mentioned moraines as maximal LIA moraines.
Spatial parameters of glaciers (latitude and longitude, exposed (debris-free) surface area, length, perimeter, maximum, minimum and mean altitude, mean slope and aspect, snowline elevation) were measured in ArcView 3.2 software (Spatial Analyst and Zonal Statistic extensions) using glacier outlines, SRTM DEM (with 60mx90m cell size) and field GPS measurements and further converted to database format.
The main errors of glacier mapping are linked to image resolution and its quality. Firstly, the error sourced from image spatial resolution was assumed equal to one image pixel for a Landsat scene (±15-30 m) and two pixels for other scenes (±1-5 m). Secondly, the presence of clouds, seasonal snowpatches, debris cover and shadows from high rock walls on satellite imagery hinders the recognition of glacier boundaries and is the source of potential errors. To estimate this kind of uncertainty, we performed a few independent glacier delineations (not less than six times) by calculating the root-mean-square error (RMSE). The final glacier mapping uncertainty, calculated as the square root of the sum of the squares of the two potential errors, was within 10%.
The error of altitude measurements is defined by resolution of the SRTM DEM (±16m) (Reference RodriguezRodriguez and others, 2005). However, real errors measured for the key polygons of studied regions using GPS ground control points and topographic maps (with resolution of 500mcm–1 and better) do not exceed 6-9 m. Here we estimated the accuracy of altitude measurements with the SRTM DEM by a value of 10 m.
Climate change analysis
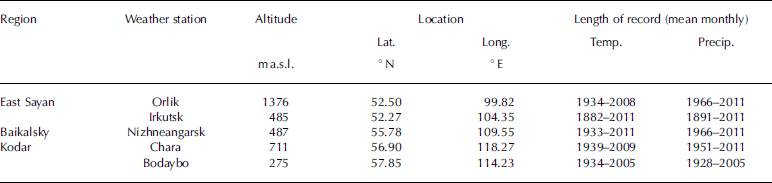
To study climatic changes in the study area, we used the mean monthly data of temperature and precipitation from the five nearest weather stations (Table 2). Mean monthly data were averaged and grouped into annual, winter (December–February), spring (March–May), summer (June–August) and fall (September–November) categories. Additionally we averaged precipitation data for accumulation (September–June) and ablation (July–August) seasons. Changes in temperature and precipitation were calculated from linear trends using a regression model.
Characteristics of weather stations used in this study. Locations are shown in Figure 1
Results
Inventory of contemporary glaciers
In total, 51 contemporary glaciers were inventoried in the study area (Table 3; Fig. 2). On two studied massifs of east Sayan we remapped 13 glaciers with a total debris-free area of 5.15 km2, 10 of which are located on PT (4.51 km2) and 3 on the MS (0.64 km2). All but one of these glaciers were included in the previous inventory of the USSR (Silnitskaya and Chernova, 1973). The glacier on the southern slope of the MS (assigned No. 31) was not included in the previous glacier inventory because it is located in Mongolia. Glacier surface altitudes vary from 2330 to 2908 m at PT and from 2804 to 3490 m at the MS. The mean altitude of the MS glaciers is 560 m higher than that of the PT glaciers. Cirque (five) and cirque-valley (four) glaciers predominate, as do glaciers with northeasterly (four) and northwesterly (three) aspects. There are nine glaciers with area <0.5 km2, three with area 0.5-1.0 km2 and only one (No. 3) with area >1 km2. Nine glaciers are <1 km long, and only one (No. 18, PT) is >2 km long.
Spatial characteristics of contemporary glaciers in the study area

Contemporary and LIA glaciers of four studied sub-regions: (a) Topografov peak, (b) Munku-Sardyk, (c) Baikalsky ridge and (d) Kodar ridge. All mapped glaciers are numbered and listed in Table 3.
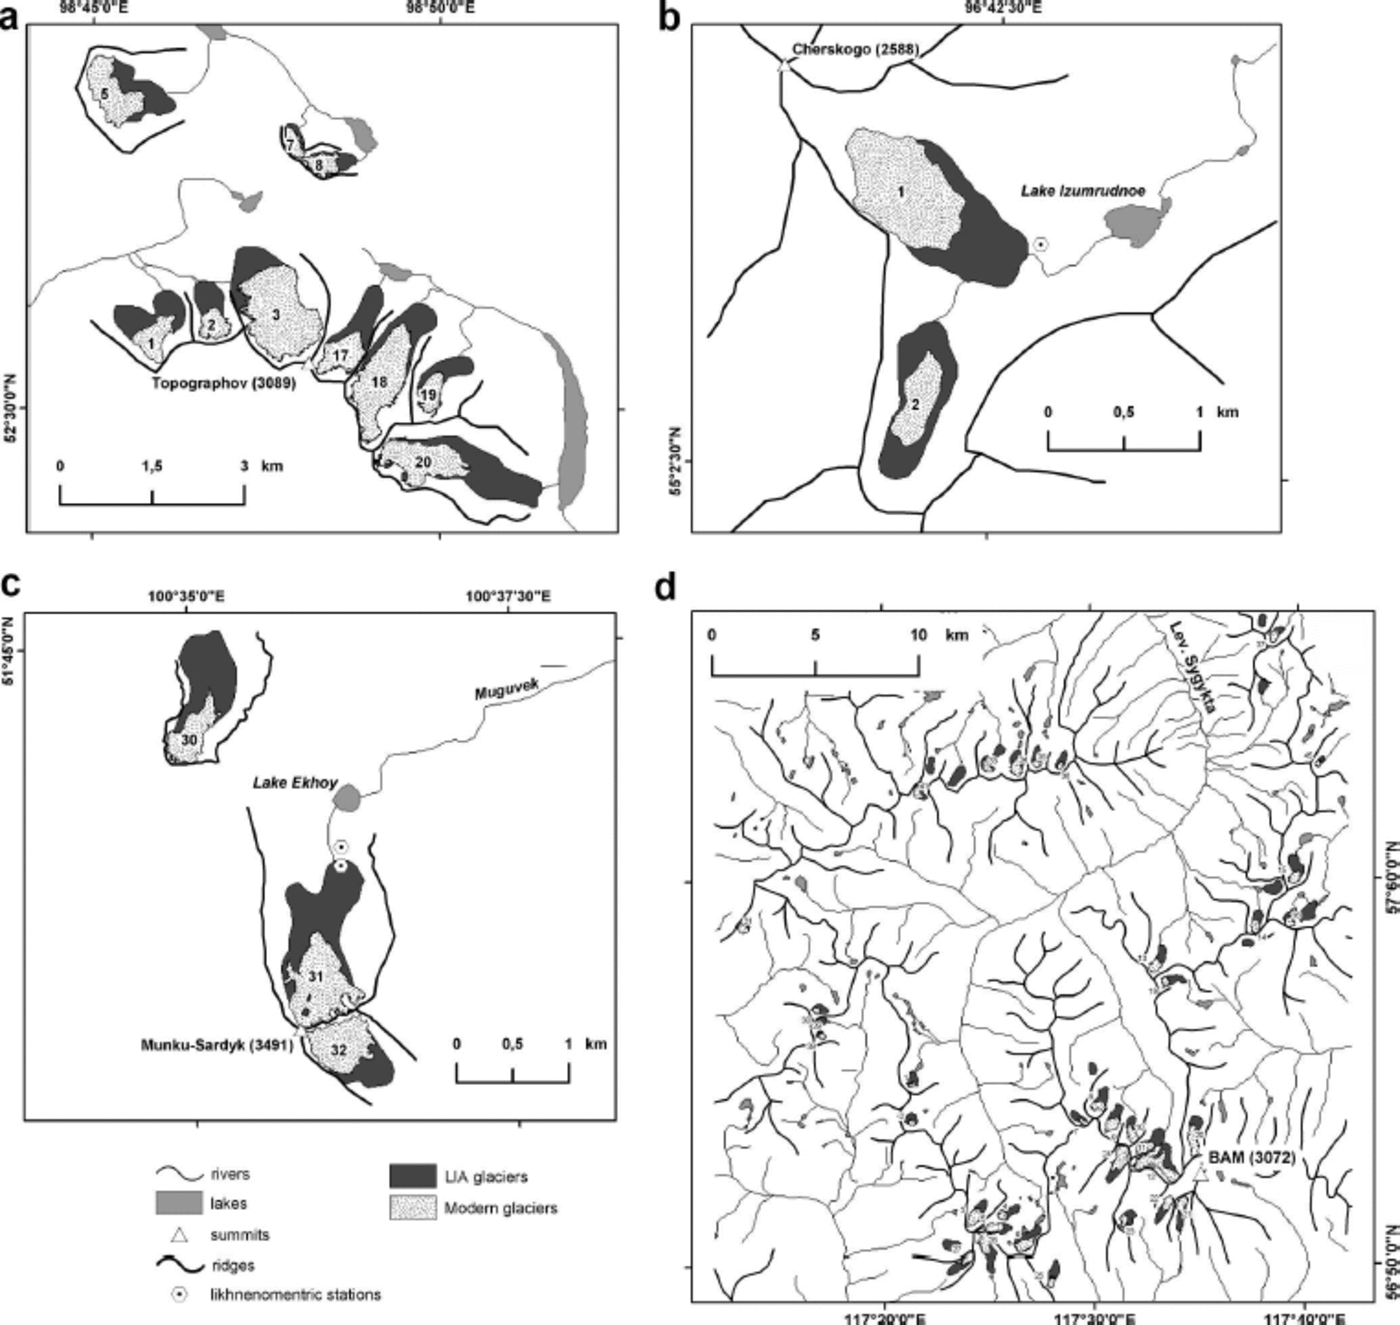
Two small cirque glaciers in the Kurkula river watershed (BR) are the lowest in the study area and in the whole of East Siberia (Table 3; Fig. 2). They have not been included in any previous inventory. However, given their unique location for the Siberian region we propose to include them in the WGI. We assigned them Nos. 1 and 2. Glacier surfaces are located at altitudes of 1796-2138 m. In 2011 the areas of debris-free surfaces were 0.40 and 0.11 km2, with lengths of 0.93 and 0.64 m, respectively.
At KR, 42 glaciers covered an area of 11.68 km2 in 2001/02. We remapped 36 of them with a total area of 9.12 km2 in 2009 (Fig. 2; Table 3). Of 30 glaciers from the previous inventory (Reference Novikova, Grinberg, Novikova, Grinberg and BashlavinNovikova and Grinberg, 1972), 3 had disappeared (Nos. 17, 18 and 28), and of 40 glaciers from the corrected inventory (Reference PlastininPlastinin, 1998), 2 had disappeared (Nos. 38 and 40). We included in our inventory two newly discovered glaciers, assigned Nos. 41 and 45. Kodar glaciers are located at elevations of 1875-2792 m (mean glacier altitude 2326 ± 162 m). Mean snowline altitude is 2287±164m (n = 30). Cirque (23) and cirque-valley (8) glaciers predominate. There are 32 glaciers with debris-free surface area <0.5 km2 (-70% of total glacier area), 3 with area 0.5-1.0 km2 and only 1 (No. 12) with area >1 km2. Most of the glaciers are north- (14) and northeast-facing (11).
Glacier changes since the LIA maximum
The geomorphology of the terminal moraines of glaciers No. 31 (Munku-Sardyk), No. 1 (BR) and No. 26 (Kodar) was investigated in the field (Fig. 2). Lichen thalli diameters on moraine boulders in the glacier forelands yielded an average size of 25.7mm (KR) to 41.4mm (MS). Due to lack of absolute dates of the moraines, we cannot accurately build lichen growth curves to estimate the time of moraine formation. However, when using the growth curve obtained for the Altai mountains (Reference SolominaSolomina, 1999), the moraine ages are within the period 1680–1820, and thus within the LIA. Using geomorphic similarities between the measured and unmeasured moraines, we believe that the mapped moraine ridges are of the recent LIA maximum. In this study, we reconstructed the LIA extents of 6 1 glaciers with a total area of 31.65 km2. It should be noted that this value underestimates the total LIA glaciation area, as we consider only glaciers later included in the inventories.
Between 1850 and 2006/11, mean debris-free area loss in the study area was 5 9% (0.37% a–1). Glaciers of PT lost 4 5% (0.29%a–1), glaciers of the MS and BR 5 3% (0.34%a–1) and glaciers of KR 62% (0.39% a–1) (Table 4). Shrinkage of individual glaciers of east Sayan ranged from 22% (glacier No. 3; 0.14% a–1) to 67% (glacier No. 20; 0.42% a–1). Kodar glaciers lost between 31% (glacier No. 24; 0.20% a–1) and 100% of their area.
Average change in debris-free glacier area since the LIA

The mean change in glacier length for the period 1850-2006/11 was ∽—550m (3.5 ma–1) in the entire study area, and ranged from -330m (2.1 ma–1) on BR to ∽—610m (3.9ma–1) on east Sayan (Table 5). Minimal glacier elevations increased by - 5 0m (BR, 0.3 ma–1) to ∽120m (east Sayan, 0.8ma–1).
Average changes in glacier length and minimal elevation since the LIA

A ∽44% glacier area decrease was revealed between 1850 and 2001/02, and a ∽27% decrease between 2001/02 and 2006/11 for the entire study area. In all regions, we observed a 5- (PT) to 13-fold (KR) increase in area shrinkage rate between the two sampled periods. Reference Stokes, Shahgedanova, Evans and PopovninStokes and others (2013) reported a similar drastic rate shift (28-fold) between the periods 1974-95 (0.11% a–1) and 1995-2001 (3.12% a–1). Our data also indicate that glacier shrinkage dramatically increased in the late 20th century and continued during the first decade of the 21st century. While before 2001/02 it was almost uniform for all regions (40–45% (0.27–0.30% a–1)), since 2001/02 we observe spatial differences in glacier responses (9–32% (1.27–3.98% a–1)), with the greatest increase on KR and the lowest on PT. From 2001/02 to 2009, six Kodar glaciers (Nos. 17, 18, 28, 43, 44 and 46) disappeared.
Comparison of debris-free areas of glaciers of PT and KR with those measured from vertical aerial pictures of 1953–63 (Reference Novikova, Grinberg, Novikova, Grinberg and BashlavinNovikova and Grinberg, 1972; Reference Sil’nitskaya and ChernovaSil’nitskaya and Chernova, 1973) showed, respectively, average area losses of 8% (0.17%a–1) and 2 3% (0.55% a–1) between 1953/63 and 2001/02. If we rely on the previous inventory data, this estimate suggests more moderate glacier shrinkage from the 1960s to 2000/01 than in the following decade (2000/01–2008/09).
Discussion
Climatic and topographic controls of glacier changes
A primary control of glacier changes is the mass-balance variability, defined by winter accumulation and summer melting. These parameters can be approximated by precipitation in the accumulation season (September–June) and mean summer (June–July) temperature, respectively. Time series of mean summer temperature and precipitation in the accumulation season from five stations are presented in Figure 3.
Time series of mean summer (left; June–August) air temperature, and total precipitation of accumulation season (right; September–June) for the period 1950–2010. Solid horizontal lines represent the 1961–90 mean; dashed lines show trends for the period 1970–2010. Locations and characteristics of the weather stations are shown in Figure 1 and Table 2.

The longest temperature record, from Irkutsk (since 1882), has significant cross-correlation with other stations (correlation coefficients 0.5-0.9) and can therefore be considered as a regional ∽130year record (almost from the end of the LIA). Temperatures in all seasons demonstrate significant positive trends. Between 1882 and 2010, mean winter, spring, summer and fall temperatures increased by 1.4, 1.0, 0.4 and 0.8°C, respectively. There is a weak signal of decreasing winter precipitation between 1891 and 2010 (-3 mm), while the summer and ablation season (July-August) precipitation demonstrate positive trends (+19 and +15 mm, respectively). In general, changes in summer temperature and winter precipitation over the past 130 years have favored glacier mass loss in the region.
To assess spatial differences in climate change, we compared temperature and precipitation records for the same time period (1970-2010; Table 6). Mean annual, spring and summer temperatures show significant positive trends at all stations (+1.7 to +3.0°C), with the largest increase during spring (+2.4 to +3.0°C). Mean fall temperature demonstrates a significant positive trend only at Irkutsk (+1.4°C). Mean summer temperature, a main predictor of glacier melting, increased by 1.7°C (Irkutsk) to 2.6°C (Nizhneangarsk).
Summary of temperature and precipitation change at the weather stations during the period 1970–2010. Significant values at the 95% confidence level (p< 0.05) are marked in bold

Summer temperatures at all stations increased between the mid-1970s and mid-2000s. The warming started on BR (since the mid-1970s) and afterwards on east Sayan (since the mid-1980s). The overall temperature maximum was registered in 2001/02. The largest temperature increase occurred at Orlik (1986-2005; +1.7°C) and the smallest at Chara (1981-2005; +2.4°C). In general, 2001-05 was the warmest period during the past ∽130 years. The next 5 year period (2006-10) was colder by 0.6-1.2°C, with maximal difference at Orlik. During the period 2006-10, there were favorable thermal conditions for the subsequent recovery of glacier mass balance. It is likely the accelerated glacier shrinkage during 2001/02 and 2006/11 was due to summer temperature increase between the mid-1970s and mid-2000s.
Unlike temperature, precipitation demonstrates weak or no correlation between the stations. Significant correlation (p<0.05) is available only between summer precipitation at Irkutsk and Orlik (r=0.35) and Irkutsk and Nizhneangarsk (r=0.45) and between accumulation season precipitation at Irkutsk and Orlik (r=0.52). This suggests the spatial differences in snow accumulation on glaciers are defined by local conditions (elevation, topography, etc.). Over the same period (1970-2010; Table 6) significant increase in precipitation occurred only at Nizhneangarsk for fall and the accumulation season (+43 and +57 mm, respectively). Preobrazhensky (1960) observed that rainfall during the ablation season increased snow and ice melting on the Kodar glaciers. However, ablation season precipitation, as an index of rainfall, demonstrates no significant trends for the period 1970-2010 (Table 6), although a slight decrease is noted for Nizhneangarsk station. We suppose the increase in snow precipitation over recent decades (especially since the early 1990s) is a likely explanation of more moderate glacier shrinkage on BR.
To establish a link between the scale of glacier shrinkage and local topography, we applied a multiple regression model (Table 7). Absolute and relative area changes for the period 1850-2010 were compared with glacier parameters such as area, minimum, maximum and mean elevation, vertical range, and mean surface slope. Significant negative relationships were revealed between the initial glacier area and its absolute and relative changes. This suggests the larger (smaller) glaciers lost smaller (larger) areas. Reference Stokes, Shahgedanova, Evans and PopovninStokes and others (2013) reported a similar relationship between the areal loss of debris-free ice from 1995 to 2010 and original area in 1995 for Kodar glaciers. However, they found a statistically significant positive relationship only for absolute areal change. We detected significant negative relationships both for relative ice change in Kodar (r 2=0.19, p = 0.003) and absolute ice change in east Sayan (r 2 =0.53, p = 0.011) and Kodar (r 2 = 0.63, p< 0.0001). Significant relationships between relative areal changes and minimal, maximal and mean glacier altitudes suggest the glaciers with lower elevations tend to shrink more intensively. Similarly, glaciers with less steep surface slopes had larger relative area changes. There is also a negative relationship between relative area changes and vertical altitude ranges for Kodar glaciers. No significant link was found between ice shrinkage and glacier aspect.
Summary of multiple regression analysis of the glacier area loss for the period 1850–2006/11. Model values significant at p < 0.05 are marked in bold. Dataset includes all glaciers listed in Table 3

As most glaciers in the study area are small (85% of glaciers are <0.5 km2) and mainly fed by avalanches, local morphologic controls of glacier responses are predictable (e.g. darkening, etc.). Moreover the study region is located in a high seismic activity zone (the Baikal rift zone), and large volumes of debris can come from surrounding walls on glacier surfaces during earthquakes (especially on Kodar). In conditions of negative mass balance and low ice dynamics, this stimulates transformation of the glaciers into buried ice (rock glaciers). Such a deglaciation mechanism is typical of small Kodar glaciers, many of which are covered by surface moraine (‘dead glacier snouts’).
Comparison with other Siberian regions
Reference SolominaSolomina (2000) reported that the scale of glacier shrinkage, measured by length and terminus-height changes between the LIA and the 1950-80s, was much smaller in continental Siberia than in central Asia and along Pacific margins. Reference Gurney, Popovnin, Shahgedanova and StokesGurney and others (2008) estimated an area decrease of 17% (0.1% a–1) between the end of the LIA and 2001 for Buordakh massif in the Chersky range, northeast Siberia. During the same period we estimated the glacier area lost on KR was 43% (0.3% a–1). However, our data suggest greater glacier shrinkage in the southeast Siberian mountains between the LIA and the first decade of the 21st century (45-62%, average 58%). The Kodar glaciers appear to have been the most sensitive to climatic change in recent decades in the study area and, likely, across the Siberia region. Reference Stokes, Shahgedanova, Evans and PopovninStokes and others (2013) found a -40% reduction in the total area of exposed ice from 1995 to 2010 for Kodar glaciers. There are many data from different regions of more moderate glacier wastage over recent decades. For example, Reference Ananicheva, Kapustin and KoreishaAnanicheva and others (2006) reported a 28% area decrease (0.9% a–1) between 1970 and 2001 in the Chersky range and a 19% decrease (0.3% a–1) in the Suntar-Khayata range, both in northeast Siberia. Minor glacier shrinkage between 1945 and 2003 (7% (0.1% a–1)) was noted by Reference Surazakov, Aizen, Aizen and NikitinSurazakov and others (2007) for the Aktru basin, Altai mountains. Thus the studied regions experienced more significant shrinkage than other Siberian regions. Higher deglaciation rates seem to reflect specific climatic background change (mainly, summer temperature rise) combined with local topographic features.
Conclusions
Most of the southeast Siberian glaciers, studied as early as the 1950-60s mainly based on aerial vertical photographs and glaciological data, required an updated study. Remapping of the mountain glaciers and moraine deposits of southeast Siberia based on high- to middle-resolution satellite images of 2001-11 and field investigations allowed us to estimate the glacier change since the LIA maximum. On average, debris-free surface area decreased by 59% between 1850 and 2006/11. In different glacierized regions the area loss for this period ranges from 45% (BR) to 62% (KR). An abrupt (order-of-magnitude, average 0.3-3.4% a–1) increase in relative shrinkage rates was found between two sampled periods, 1850-2001/02 and 2001/02-2006/11.
The likely main cause of the increased glacier shrinkage in 2001/02-2006/11 is a ~2.5°C summer temperature increase between the mid-1970s and mid-2000s in the study area, recorded by many stations. However, some differences in glacier response are smoothed by spatial heterogeneities in snow accumulation, local topography (e.g. glacier elevation, slope) and geological (seismic) activity. The data obtained suggest the studied glaciers are the most sensitive in Siberia to climate change since the late 20th century.
Acknowledgements
This study was supported by the Russian Foundation for Basic Research (projects No. 11-05-00713 and No. 13-05-00022) and the Department of Earth Sciences of the Russian Academy of Sciences (project No. 12.11). We thank two anonymous reviewers for valuable comments and suggestions.



