I. INTRODUCTION
With the increase of the burning of fossil fuels in recent years, thermal power plants and internal combustion engines produce large amounts of nitrogen oxides (NOx). The emissions of NOx will contribute to greenhouse effect, acid rain, ozone hole, and so on,Reference Blanco, Avila, Suárez, Yates, Martin, Marzo and Knapp1,Reference Li, Chang, Ma, Hao and Yang2 which has a serious effect on human life and ecosystem on human life and ecosystem. Therefore, it is urgent to control NOx emission. At present, the technology of selective catalytic reduction of NOx with NH3 (NH3-SCR)Reference Forzatti, Nova and Tronconi3–Reference Zhang, Shi, Huang, Zhang, Gao and Zhang5 is extensively used in industry. The most used commercial catalysts for NH3-SCR is vanadium–titanium class such as V2O5–WO3(MoO3)/TiO2 catalysts,Reference Dahlin, Nilsson, Bäckström and Bergman6,Reference Song, Chao, Fang and He7 which showed excellent NOx conversion. However, some inescapable weaknesses of the V-based catalysts still retained, such as toxicity of VOx, poor N2 selectivity, narrow operation temperature window, and especially the poor low-temperature catalytic activity.Reference Yang, Huang, Chen, Zhang and Lu8 Hence developing low temperature SCR catalysts have become a research hotspot.
In recent years, Mn-based catalysts have been successfully attracted the attention due to their excellent low temperature activity and inherent environmental protection characteristics. However, the single Mn-based catalyst had the disadvantages of lower N2 selectivity and thermal stability.Reference Zhang, Zhang, Liu and Sun9 The addition of another metal oxide to Mn-based catalysts is considered one of the most promising and effective methods to make up for these defects, such as Fe2O3,Reference Deng, Zhuang, Xu, Ding and Yu10,Reference Jiang, Wu, Liu and Lee11 WOx,Reference Liu, Shan, Lian and Xie12 NiOx,Reference Wan, Zhao, Tang and Li13 and SnO2.Reference Chang, Li, Chen and Ma14 Putluru et al.Reference Putluru, Schill, Jensen and Siret15 developed MnOx/TiO2 catalysts with nearly 90% NOx conversion below 300 °C and better N2 selectivity. Unfortunately, these two metal composites have narrow temperature window and weak resistance against SO2 & H2O. Therefore, for the purpose of overcoming these deficiencies, ternary complex metal oxides such as LaFe1−xMnxO3,Reference Li, Yan, Zuo and Lu16 and Ce(y)–FeMnOxReference France, Yang, Li and Chen17 with larger specific surface area and better porosity have been improved. Nowadays, ceria has been extensively studied because of its high oxygen storage capacity and unique redox properties, which are used as accelerants to enhance the activity for SO2 and H2O durability of various catalysts.Reference Zhang, Du, Shi and Gao18 Zhao et al.Reference Zhao, Huang, Li and Hu19 used the Ce(NO3)3 6H2O, NH4VO3, and Zr(NO3)4 5H2O as raw materials to prepare the Ce–Zr–V ternary compound metal oxide nanoparticles with ammonia water as the precipitant. Although these compound oxides exhibited the high NOx conversion, they are difficult to be molded and easy to aggregate during the preparation process at high temperature, and thus affecting the surface acidity and activity. Hence, the practical applications of these ternary compound metal oxide catalysts are very restrictive. The solution to these problems is to use some carriers, which can effectively affect the physical and chemical properties of the surface active component and thus overcome these shortcomings. The different carriers based on cerium-loaded catalysts showed excellent SCR performance and SO2 tolerance,Reference Wang, Sun, Quan and Chen20,Reference Wang, Guo, Pan and Chen21 and so it attracted wide attention.
Attapulgite (ATP) is a silicate clay mineral with a chain layer structure and large surface area, excellent adsorption performance, and high mechanical strength.Reference Xie, Zhou, Huang and Ji22,Reference Zhou, Huang, Xie and Luo23 It is a good environmentally friendly material and so is a promising alternative catalyst carrier to improve the disadvantages of the composite metal oxide.
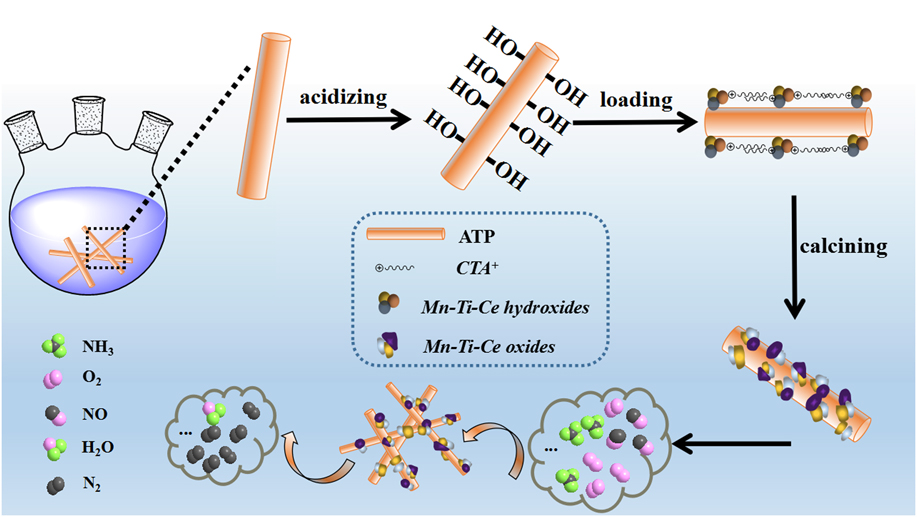
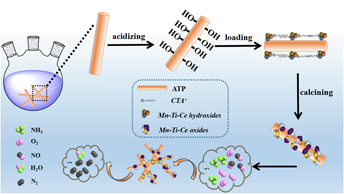
Therefore, in this work, first, MnTiOx was acquired by the co-precipitation method and it was then loaded on the ATP (denoted as MnTiOx/ATP). Second, cerium oxide, as an accelerant, was studied through two modified pathways for MnTiOx/ATP including Ce-loaded and doped (denoted as Ce/MnTiOx/ATP and Ce–MnTiOx/ATP), respectively. The whole preparation and catalytic process of the Ce–MnTiOx/ATP catalyst was illustrated in Scheme 1. A series of characterizations such as morphology characterization and performance testing were implemented to further verify the performance of the two catalysts.
Schematic illustration for the synthesis of Ce–MnTiOx/ATP.

II. EXPERIMENTAL
A. Preparation of Ce/MnTiOx/ATP and Ce–MnTiOx/ATP catalysts
As the raw material, the used ATP was supplied by Nanda Zijin Technology Group Co., Ltd. (Changzhou, China). All the other chemicals were of analytical grade, provided by Sinopharm Chemical Reagent Co., Ltd. (Shanghai, China). ATP supports were prepared by the acid treatment. It was completely dispersed with deionized water under stirring and ultrasonic treatment for 0.5 h to acquire dispersed slurry. ATP acid treatment was performed with mixed acid (volume ratio of HNO3/H2SO4 was 1:3) so as to introduce –OH and eliminate impurities of the ATP surface.
The Ce/MnTiOx/ATP catalyst was acquired by two-step synthesis. First, 2.0 g of cetyltrimethyl ammonium bromide (CTAB) was put in a 500 mL three-flask and dispersed in 300 mL deionized water. Then Mn(NO3)2 and Ti(SO4)2 were mixed in 50 mL of deionized water with continuous stirring (the mole ratio of Mn and Ti was 1:1). The resulting solution and ATP dispersed slurry were all dissolved in CTAB solution with stirring at 300 rpm for 30 min. Subsequently, the ammonia solution was added dropwise to the mixture, and the pH value of final solution was maintained over 10. During the reaction process, the whole mixed liquor was constantly stirred at 80 °C for 4 h. Finally, the sediment was separated by filtrating and washed with deionized water or ethanol solution till the value of pH became 7, then dried at 100 °C for 12 h followed by calcining at 400 °C for 4 h in a muffle furnace to obtain a series of (y) MnTiOx/ATP [where (y) represented the molar ratio of MnTiOx to ATP]. Second, MnTiOx/ATP was crushed and sieved through a 120 mesh screen before being used. 0.61 g of Ce(NO3)3 6H2O was mixed with 2.0 g of MnTiOx/ATP and then dissolved in 200 mL deionized water, followed by the same process as the above steps such as adjusting pH, filtering, washing, and drying. The resulting catalyst was acquired after calcining below 400 °C for 4 h. Here cerium was loaded on the surface of MnTiOx/ATP in the form of CeO2 particles and it can be verified by using X-ray diffraction (XRD) and TEM images.
The Ce–MnTiOx/ATP catalyst was prepared through one-pot synthesis. Manganese nitrate, titanium sulfate, cerium nitrate, CTAB, and ATP dispersed slurry, where all the quantities were the same as above, were mixed under vigorous stirring at 300 rpm for 30 min, followed by the same process as the above steps such as adjusting pH, filtering, washing, drying, and calcining.
B. Catalyst characterization
XRD patterns were obtained using a D/max 2500 PC diffractometer (Rigaku, Akishima City, Tokyo, Japan) running at 60 kV and 30 mA. Intensity data were collected over a 2θ range of 0–80° with an accumulation time of 3° min−1. The nitrogen adsorption–desorption curve was detected through the type ASAP2010C surface pore size adsorption instrument. All samples were dried at 120 °C for more than 3 h before testing. The specific surface area and pore volume of the samples were measured using a surface pore size adsorption instrument (ASAP2010C, Micromeritics manufacturers, Norcross, Georgia), and the specific surface area of the samples was calculated by the Brunauer–Emmett–Teller (BET) method. Correspondingly, the pore size distribution was calculated through the Barrett–Joyner–Halenda way. The TEM pictures were obtained on an electron microscope (TEM, JEOLJEM-2100, JEOL, Tokyo, Japan) and accelerating voltage at 200 kV. Temperature-programmed desorption by ammonia (NH3-TPD) was conducted on a TP5080 auto-adsorption apparatus (XQ, Tianjin, China). The samples were pretreated at 300 °C for 1 h in high purity Ar (35 mL/min) and then cooled to 100 °C, then saturated with NH3 for 30 min at a flow rate of 30 mL/min and purged with pure Ar for 1 h. Finally, the samples were heated from room temperature to 800 °C (rate at 10 °C/min). The temperature-programmed reaction of hydrogen (H2-TPR) was also performed on a TP5080 auto-adsorption apparatus (XQ, Tianjin, China). 500 mg of the calcined catalysts were outgassed under high purity N2 atmosphere at 300 °C for 1 h and then cooled to room temperature, the flowing gas was switched to H2–Ar mixed gas (H2 volume ratio 7 vol%), and the catalysts were heated from room temperature to 800 °C at a flow rate of 30 mL/min using a thermal conductivity detector. X-ray photoelectron spectroscopy (XPS) was performed on a Thermo Fisher-250XI spectrometer (Thermo Fisher Scientific, Waltham, Massachusetts) with Al Kα radiation source, and the binding energy was corrected using the C 1s spectrum at 284.6 eV.
C. Catalytic performance test
The NH3-SCR activity was evaluated in a fixed-bed reactor including a vertical stainless steel tube (10.0 mm in inner diameter) enclosed in a tubular temperature-programmed furnace. The SCR activity measurement of the catalysts was evaluated in a stainless steel fixed-bed reactor (i.d. 10.0 mm) that provided with Huasi Instrument Co., Ltd. (Hunan, China). The reaction system was carried out with 2 L/min total flow rate, which contained 1000 ppm NO, 1000 ppm NH3, 200 ppm SO2 (when used), 5 vol% O2, 10 vol% H2O (when used), and N2 as balance. The gas hourly space velocity was about 40,000 h−1. The amount of catalyst is about 0.8 g (40–80 mesh). Before the test, continued aerating for 30 min to make the catalyst adsorption saturation. The inlet and outlet concentrations of NOx were continually monitored by using an NO/NO2/NOx analyzer (KM9106, Kane International Ltd., Welwyn Garden City, U.K.), and N2O gas analyzer supplied by Shenzhen Beit Analytical Instruments Co., Ltd. (Shenzhen, China). The NOx conversion and N2 selectivity were calculated according to the following formulae:
 $${\rm{N}}{{\rm{O}}_x}\;{\rm{conversion}}\;\left( \% \right) = \left( {1-{{{{\left[ {{\rm{N}}{{\rm{O}}_x}} \right]}_{{\rm{out}}}}} \over {{{\left[ {{\rm{N}}{{\rm{O}}_x}} \right]}_{{\rm{in}}}}}}} \right) \times 100\% \quad ,$$
 $${{\rm{N}}_2}\;{\rm{selectivity}}\;\left( \% \right) = \left\{ {1 - {{{{\left[ {{\rm{N}}{{\rm{O}}_2}} \right]}_{{\rm{out}}}} + 2{{\left[ {{{\rm{N}}_2}{\rm{O}}} \right]}_{{\rm{out}}}}} \over {{{\left[ {{\rm{NO}}} \right]}_{{\rm{in}}}} + {{\left[ {{\rm{N}}{{\rm{H}}_3}} \right]}_{{\rm{in}}}} - {{\left[ {{\rm{NO}}} \right]}_{{\rm{out}}}} - {{\left[ {{\rm{N}}{{\rm{H}}_3}} \right]}_{{\rm{out}}}}}}} \right\} \times 100\% \quad ,$$
where formula (1) represents the calculation of nitrogen oxide conversion rate, formula (2) represents the calculation of nitrogen selectivity, and subscripts in and out indicate the inlet concentration and outlet concentration at steady state, respectively.
III. RESULTS AND DISCUSSION
A. Characterization analysis
1. XRD patterns
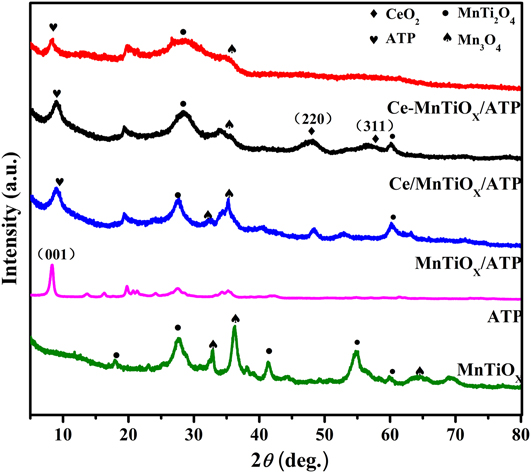
To analyze the crystalline structure of different samples, XRD patterns of ATP, MnTiOx, MnTiOx/ATP, Ce/MnTiOx/ATP, and Ce–MnTiOx/ATP were obtained and the results are presented in Fig. 1. The XRD spectrum of MnTiOx reveals the main crystalline structure with the combination of MnTi2O4 and Mn3O4, which are (103), (211), and (400) planes of Mn2O3 (JCPDS No. 80-0382) and (111), (220), (400), and (333) planes of MnTi2O4 (JCPDS No. 74-2290). After the surface of ATP has been loaded by MnTiOx, characteristic peaks at 2θ = 27.06°, 34.89°, 36.11°, and 60.08° can correspond to the planes of Mn2O3 or MnTi2O4, respectively, illustrating that MnTiOx is successfully introduced. For the Ce/MnTiOx/ATP, when cerium oxide particles are scattered on the surface of MnTiOx/ATP, some new diffraction peaks ascribed to CeO2 are visible clearly, and the faint peaks appeared at 47.5° and 65.5° are in agreement with (220) and (311) planes of CeO2,Reference Xie, Zhou, Huang and Ji22 indicating that CeO2 has not form a ternary complex with Mn–Ti instead CeO2 particles evenly disperse in the catalyst surface, which can be further confirmed by TEM analysis in Fig. 3. Beyond that, the Ce-doped catalyst cannot present the peak of CeO2, and the diffraction peak has obviously weakened, implying that a certain amount of Ce species has been doped into the Mn–Ti lattice.Reference Das, Sharma, Kumar and De24 In addition, the diffraction peak of 2θ = 7.98° brought from ATP can also be observed in all curves except in MnTiOx. It is fully proved that MnTiOx and CeO2 have been combined successfully with ATP.
XRD patterns of the different catalysts.

2. BET analysis
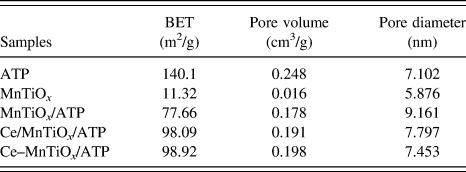
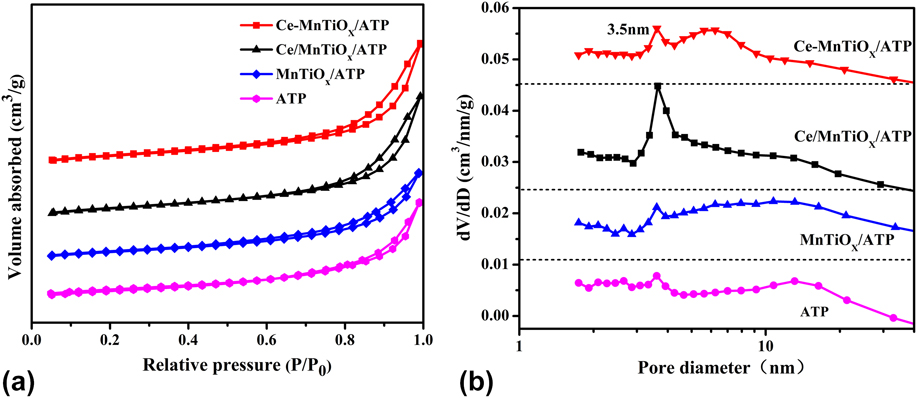
The specific surface area, pore volume, and pore diameter were summarized in Table I. It can be found from Table I that ATP has the largest specific surface area (S BET = 140.1 m2/g) among the five samples, while that of MnTiOx is smallest only with 11.32 m2/g. When MnTiOx are supported on the surface of ATP, the specific surface area of MnTiOx is obviously increased due to the ATP with large specific surface area. After loading with Ce, the specific surface area of the catalyst continues to increase till up to 98.09 m2/g. Combined with TEM results, it may be attributed to the accumulation of metal oxides and the formation of pores.Reference Andersen, Serov and Atanassov25 Furthermore, the specific surface area and pore volume of Ce–MnTiOx/ATP are improved to some extent after doping Ce, while the pore diameter correspondingly decreases. It is concluded that the addition of Ce can enhance the specific surface area and pore volume of the catalyst during the roasting, and thus reducing the collapse of catalyst pores. This phenomenon can make the catalyst particles more evenly distribute, which is beneficial to full contact between the reactive gas and the active sites on the catalyst surface, and thus improving the reaction rate. Furthermore, for the purpose to compare the specific surface area and pore structure of different samples, N2 adsorption–desorption isotherms of catalysts are presented in Fig. 2(a). According to the definition of IUPAC, all catalysts exhibit typical IV-type isothermal and H3-type hysteresis loop, indicating that all catalysts are the mesoporous structure.Reference Cai, Hu, Li and Shi26 As shown in Fig. 2(b), the pore size of all samples is centered at around 3.5 nm, which is the typical absorption aperture of the ATP itself. Meanwhile, the pore diameter around 10.5 nm belongs to the large pore formed by staggered accumulation of ATP. When MnTiOx is added, the quantity of pore size at 3.5 nm is slightly increased due to the accumulation of metal particles. Moreover, the deposition of Ce particles on the catalyst surface enables the aperture of ATP at 10.5 nm to be covered partially, resulting in weakening of the peak shape at 10.5 nm while strengthening at 3.5 nm.Reference Zhou, Huang, Xie and Luo23 In addition, after doping Ce, Ce combines with the other two metals to generate a co-melt by one-step deposition, the pore size between the particles further increases to form a new pore size ranges at around 4–8 nm, which is favorable for the absorption of reducing gas, and thus the catalytic activity can also be enhanced.Reference Boningari, Ettireddy, Somogyvari and Liu27
BET specific area, pore volume, and pore diameter of catalysts.

(a) Nitrogen adsorption–desorption isotherms and (b) pore size distributions of ATP, MnTiOx/ATP, Ce/MnTiOx/ATP, and Ce–MnTiOx/ATP.

3. TEM analysis
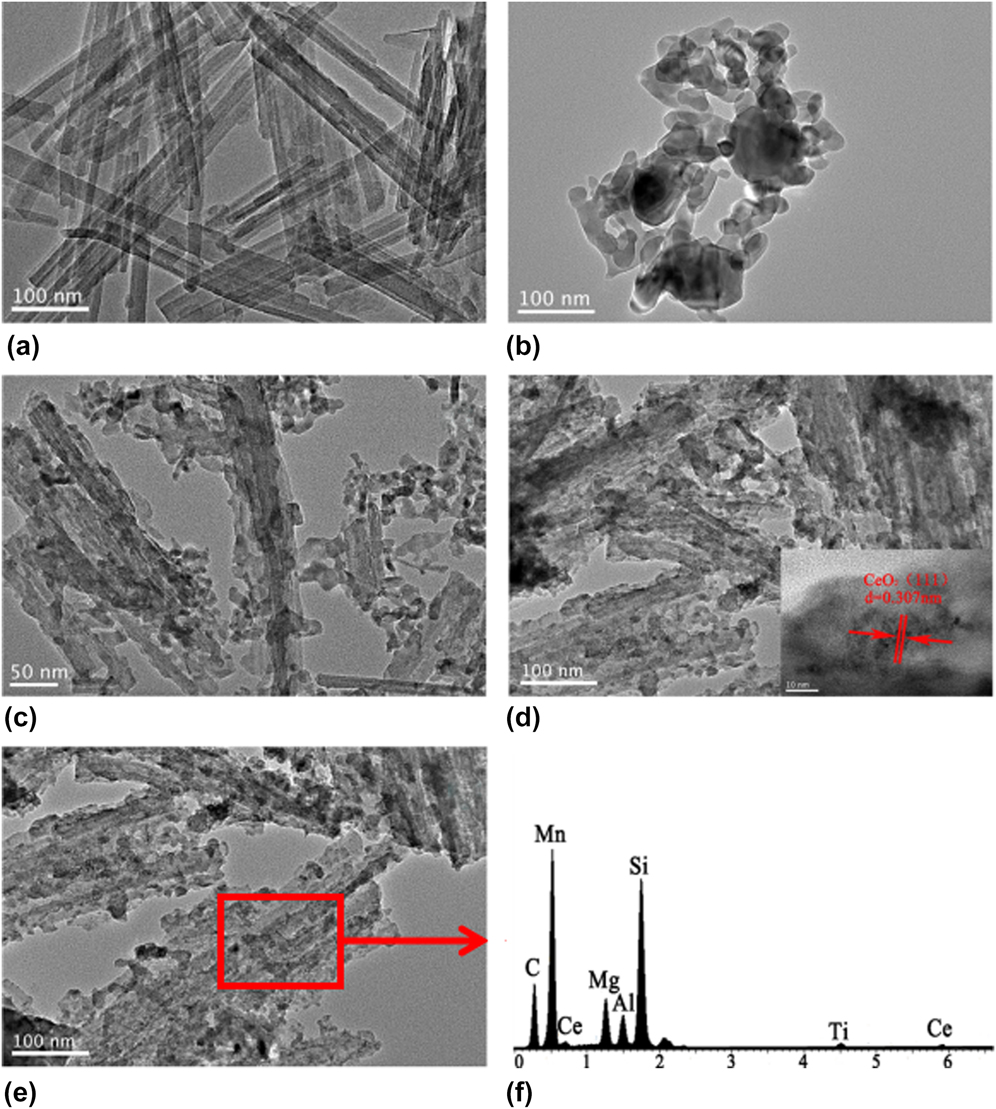
The TEM image was used to characterize the microstructure of the catalysts. Figure 3(a) is a typical TEM image of pure ATP, a rod-like ATP with diameters ranging from 20 to 70 nm and a length about 300 nm are easy to distinguish. The rod-shaped ATP surface is smooth and clear before loading the active ingredient. Figure 3(b) displays the TEM graph of MnTiOx. As can be seen, MnTiOx presents ellipses with different sizes, the adjacent particles intersect to form part of aggregation. Figure 3(c) shows a TEM image of ATP loaded with MnTiOx. It can be clearly seen that many small black particles adhere to the fibrous ATP surface, illustrating MnTiOx has well dispersed evenly over the surface ATP. Besides, in Fig. 3(d), Ce particles are uniformly dispersed on the surface of MnTiOx/ATP, and one interplanar spacing around 0.307 nm can be observed under high-resolution transmission electron microscopy, which is well matched with CeO2 in plane (111).Reference Xie, Zhou, Huang and Ji22 However, no lattice of cerium oxide is found when Ce is doped into MnTiOx/ATP. The reason may be ascribed to the interaction between Mn and Ce. Moreover, the crystallinity is decreased during Mn and Ce coexisting with each other in the catalyst. Machida et al. reported that this phenomenon was due to the formation of solid solution between Mn and Ce in the catalyst, which has great influence on the physical and chemical properties of the catalyst body, especially on the electron and acid site distribution on the catalyst surface.Reference Machida, Uto and Daisuke Kurogi28 Meanwhile, the elements energy-dispersive X-ray spectroscopy (EDS) of the Ce–MnTiOx/ATP catalyst is shown in Fig. 3(f). As can be seen that the peaks attributed to Mn, Ti, and Ce elements are discovered clearly, other elements such as Mg and Al derived from ATP can also be clearly visible, implying the successful synthesis of the Ce–MnTiOx/ATP catalyst.
TEM images of the catalysts: (a) ATP, (b) MnTiOx, (c) MnTiOx/ATP, (d) Ce/MnTiOx/ATP, (e) Ce–MnTiOx/ATP, and (f) EDS pattern of Ce–MnTiOx/ATP.

4. XPS analysis
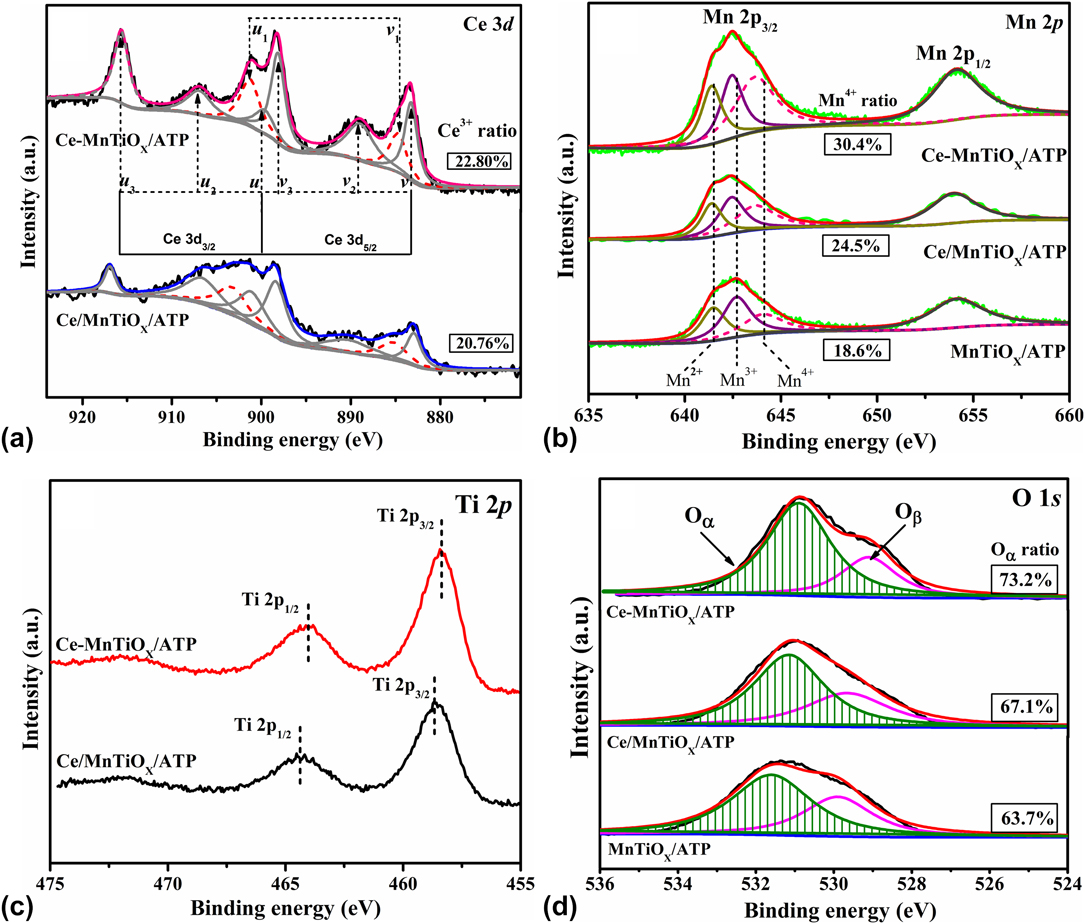
The surface elemental valence and content of the catalyst samples were measured by XPS. Figure 4 shows the XPS spectra of Ce 3d, Mn 2d, Ti 2p, and O 1s for different catalysts. And the surface atomic concentrations are also listed in Table II. Figure 4(a) displays the Ce 3d core level spectrum of catalysts Ce/MnTiOx/ATP and Ce–MnTiOx/ATP. Among them, the bands labeled with “u” and “v” represent Ce 3d 3/2 and Ce 3d 5/2 spin orbit components, respectively. In detail, the sub-bands labeled as v1 and u1 are assigned to the 3d 10f 1 initial electronic state, corresponding to the species Ce3+ on the surface. And those labeled v, v2, v3, u, u2, u3 are belong to the 3d 10f 0 initial electronic state, which is matched with the species Ce4+ on the surface.Reference Chen, Wang, Fang and Ren29 It is worth noting that Ce is predominately in the Ce4+ valence state in both catalyst species. In Table II, the Ce3+/Ce(total) ratio of the Ce–MnTiOx/ATP sample (22.80%) is much higher than that of the Ce/MnTiOx/ATP catalyst (20.76%), suggesting that more Ce elements are moved into the MnTiOx lattice than the Ce-loaded catalyst. According to previous reports,Reference Liu, Zhou, Wang and Wang30 the conversion of Ce4+ to Ce3+ can produce the corresponding oxygen vacancies and the relatively high mobility of bulk oxygen species (4Ce4+ + O2− → 4Ce4+ + 2e−/⊙ + 0.5O2 → 2Ce4+ + 2Ce3+ + ⊙ + 0.5O2, ⊙ represents an empty position), which can speed up the oxidation of NO to NO2. It can be seen from the “fast SCR” formula: 2NH3 + NO + NO2 → 2N2 + 3H2O.Reference Liu, He, Ding and Zhang31 This may be why the Ce–MnTiOx/ATP exhibits the better low temperature catalytic activity as compared with Ce/MnTiOx/ATP.
XPS spectra of (a) Ce 3d, (b) Mn 2p, (c) Ti 2p, and (d) O 1s.

XPS results of various catalysts.

The Mn 2p XPS spectra of the different catalysts are shown in Fig. 4(b), and the high binding energy can be identified as the Mn 2p 1/2 orbit and the low is defined as the Mn 2p 3/2 orbit, where the Mn 2p 1/2 peaks can be separated into three peaks, corresponding to Mn2+ (641.4 eV–641.7 eV), Mn3+ (642.4 eV–642.7 eV), and Mn4+ (643.9 ev–644.1 eV), respectively. The Mn4+/Mn(total) ratio of these catalysts can be sequenced as Ce–MnTiOx/ATP (30.4%) > Ce/MnTiOx/ATP (24.5%) > MnTiOx/ATP (18.6%). According to Wu et al.,Reference Wu, Lu, Song, Ma and Xing32 the higher oxidation state of manganese species was excellent for redox reactions in the Mn-based catalysts. Furthermore, the introduction of cerium enables the peak of Mn to shift toward low binding energy. This may be due to the fact that the interaction of manganese and cerium can make not only Mn ion electron cloud density increaseReference Zhu, Zeng, Zhang, Deng and Zhong33 but also the binding energy of O 1s slightly move toward a lower energy [Fig. 4(d)].
Figure 4(c) displays the Ti 2p spectrum of catalysts Ce/MnTiOx/ATP and Ce–MnTiOx/ATP. It is reported that the binding energy of 464.23 eV is vested in Ti 2p 1/2 and the binding energy of 458.75 eV might be in agreement with Ti 2p 3/2. Moreover, the peak position of Ce–MnTiOx/ATP is shifted to a lower energy, indicating that the electron density of Ti4+ increases due to the introduction of cerium ions.Reference Zhu, Zeng, Zhang, Deng and Zhong33
Additionally, the O 1s characteristic peak of the catalysts mainly contains two peaks [Fig. 4(d)]. The first one is corresponded to the surface lattice oxygen (denoted by Oβ), such as O2−, which is located at 529.2–530.0 eV. The second one is equivalent to chemically adsorbed oxygen (denoted by Oα), such as O22−, O−, OH−1, and carbonate (CO32−) in hydroxide form, which is located at 531.4–532.0 eV. The percentages of Oα and Oβ are obtained by integrating the peak areas (Table II). It can be seen from Table II that the atomic ratio of Oα/(Oα + Oβ) on the Ce–MnTiOx/ATP surface is 73.2%, which is higher than that of Ce/MnTiOx/ATP (67.1%) and MnTiOx/ATP (63.7%). These results imply that Ce doping promotes the formation of chemisorbed oxygen, which leads to the imbalance of the catalyst surface charge, and thus form oxygen holes and unsaturated bonds.Reference Yang, Zhu, Jiang, Chen and Wang34 The existence of more suitable adsorbed oxygen is advantageous for the NH3-SCR reaction.Reference Lian, Liu, He, Shi and Mo35
5. H2-TPR measurement
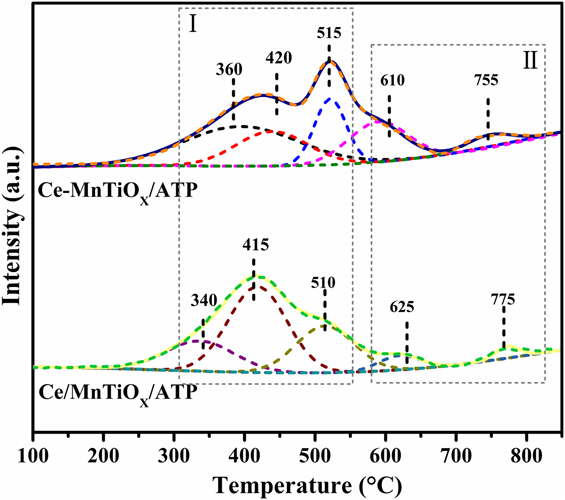
The H2-TPR test is used to detect the reducibility of the catalyst. It can be seen from the H2-TPR profiles (Fig. 5), the peaks of catalysts are divided into two large parts (I and II). Because of the heating rate or different H2 concentrations, the reduction temperature of the two catalysts is not completely consistent. The first three peaks (less than 600 °C) represent the reduction peak of Mn species,Reference Zhang, Zhang, Shi, Fang and Zhang36 which are designated as MnO2 → Mn2O3 → Mn3O4 → MnO in three different temperature segments, respectively.Reference Sultana, Sasaki and Hamada37 The remaining II peaks (more than 600 °C) are assigned as the reduction peak of cerium. Two peaks located at around 620 °C and 760 °C are attributed to the reduction of CeO2 to CeO and the reduction of bulk CeO2, respectively.Reference Zhang, Zhang, Shi, Fang and Zhang36,Reference Liu, Yi, Zhang, Zhu, Zhu and Wang38 In general, the size of the peak area can be used to compare reduction performance of catalysts. The related area ratio of the reduction peak is qualitatively evaluated in Table S1, where the serial numbers represent the reduction peak from low to high temperature, respectively. As can be seen from the table, the total peak area of the Ce-loaded MnTiOx/ATP catalyst (8.0 + 0.7) was less than that of the Ce-doped (8.1 + 2.6), which means that the Ce–MnTiOx/ATP has higher reducibility than Ce/MnTiOx/ATP. This illustrates that the Ce-doping can enhance the oxygen storage capacity and redox capacity of the catalyst.Reference Cai, Liu, Zha and Li39
H2-TPR profiles of Ce/MnTiOx/ATP and Ce–MnTiOx/ATP catalysts.

6. NH3-TPD analysis
NH3-TPD technique was used to investigate the surface acid types and strength over the catalysts. It is also the key factor for the deNOx performance of the catalyst.Reference Li, Li, Wang, Hu and Zhan40 The NH3-TPD curves of Ce/MnTiOx/ATP and Ce–MnTiOx/ATP are shown in Fig. S1. Both samples present a wide desorption peak in the temperature range of about 115–320 °C, which represent weak Brønsted acid sites. The other two large NH3 desorption peaks observed at temperatures 432 and 685 °C represent intermediate acid and strong Lewis acid site.Reference Tang, Li, Yi and Zhang41
In addition, the acidity of the catalyst can be qualitatively analyzed by the peak area and the temperature range. The catalyst desorption amounts of NH3 in different temperature ranges are listed in Table S2. It is obvious that the Ce–MnTiOx/ATP catalyst desorbs much more NH3 (0.48 mmol/g) than the Ce/MnTiOx/ATP catalyst (0.45 mmol/g), which indicates that Ce–MnTiOx/ATP had a higher NH3 adsorption capacity than Ce/MnTiOx/ATP. The reason may be due to the fact that Ce doping in MnTiOx can produce a higher concentration of chemisorbed oxygen, which is considered to contribute for the SCR reaction.Reference Sultana, Sasaki and Hamada37,Reference Zhang, Yang, Luo, Li, Lei and Chen42
B. Activity analysis
1. NH3-SCR activity
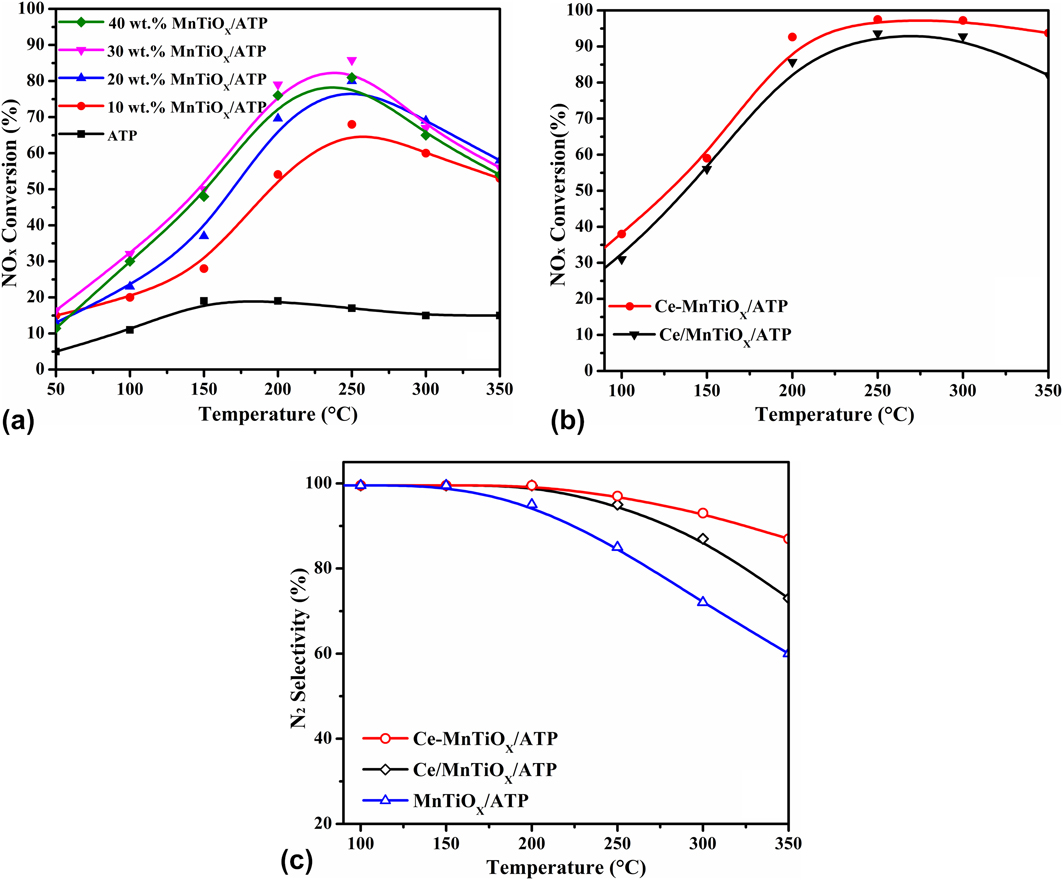
To confirm the optimum loaded amount, the different amounts (10 wt%, 20 wt%, 30 wt%, and 40 wt%) of MnTiOx loaded on ATP were investigated, respectively, at 50–350 °C. It can be noticed from Fig. 6a that pure ATP has little catalytic activity. Instead, as the loading of MnTiOx, the catalytic activity of MnTiOx/ATP increases to 30% and the NOx conversion rate reaches an optimal value of about 85.5% at 250 °C. However, when the loading of MnTiOx is further increased, the NOx conversion rate has no increase. This may be because excess loading results in excess of active components, which cannot be very well distributed during deposition. Next, the NOx conversions for Ce–MnTiOx/ATP and Ce/MnTiOx/ATP are presented in Fig. 6(b). From the overall trend, the catalyst of cerium doping is better than that of the loading on SCR activity, and the NOx conversion rate of both can achieve over 80% during 170–350 °C. In addition, the N2 selectively is presented in the inset of Fig. 6(c), as can be seen that the N2 selectively of MnTiOx/ATP has a sharp decline after 150 °C. By contrast, cerium-containing catalysts show the excellent N2 selectivity. The uniform decoration of CeO2 on the outer surface can effectively improve the N2 selectivity, and the Ce–MnTiOx/ATP catalyst exhibits over 80% N2 selectivity at 350 °C.
NH3-SCR performance of 10–40 wt% MnTiOx/ATP (a), Ce/MnTiOx/ATP and Ce–MnTiOx/ATP (b), and N2 selectivity of MnTiOx/ATP, Ce/MnTiOx/ATP, and Ce–MnTiOx/ATP (c).

2. SO2 & H2O resistance and stability test
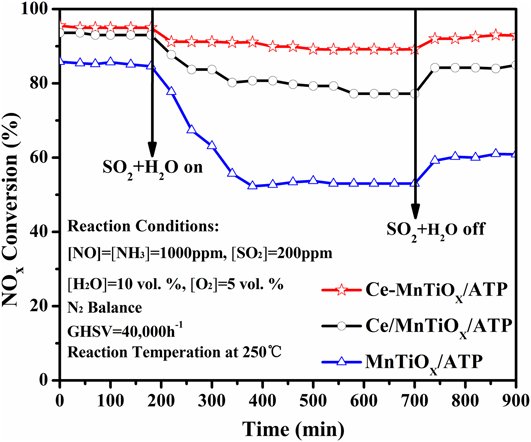
SCR has the advantage of low energy consumption and operating cost. However, the poor SO2 & H2O resistance of catalysts hampers its industrial application. Therefore, it is very necessary for investigating the effect of SO2 & H2O on low temperature catalyst activity. Figure 7 shows the influence of SO2 & H2O on the NOx conservation over three catalysts at a function of temperature (250 °C). Before injection of SO2 & H2O gas, the three catalysts exhibit high conversion rates of 85.8%, 93.6%, and 97.5%, respectively. When 200 ppm SO2 & 10 vol% H2O vapor is opened, NOx conversion has only a slight decrease in the case of Ce–MnTiOx/ATP catalyst and maintains about 90%. While the deNOx rate of Ce/MnTiOx/ATP decreases to 77.7% and then almost keeps the same, the deNOx rate of 30% MnTiOx/ATP drops to 53.0% dramatically during the test period. As stopping the SO2 & H2O gas, the catalytic activity of Ce–MnTiOx/ATP, Ce/MnTiOx/ATP, and MnTiOx/ATP catalysts restores to 92.5%, 84.5%, and 60.9%, respectively. Furthermore, the stability was evaluated in the presence of SO2 and H2O in Fig. S2. It could be noted from Fig. S2 that after the stability test of 12 h, the results revealed that the cerium-loaded/doped MnTiOx/ATP had a higher stability in comparison to MnTiOx/ATP. This indicated that the addition of Ce can store SO2 in the form of cerous sulfate in the catalyst, thus preventing the sulfuration and deactivation of active components of the catalyst. Additionally, the stability of Ce–MnTiOx/ATP and Ce/MnTiOx/ATP is investigated and the results are displayed in Fig. S3. It is evident that the stability of both catalysts is very high. Throughout the whole process, only 1.3% of activity lost within 30 h continuous lifetime test, indicating that both catalysts exhibit the remarkable high stability for NH3-SCR. By contrast, the stability of Ce–MnTiOx/ATP is superior to that of Ce/MnTiOx/ATP.
NOx conversions over Ce/MnTiOx/ATP and Ce–MnTiOx/ATP catalysts in the presence of SO2 (200 ppm) + 10 vol% H2O within 900 min.

IV. CONCLUSIONS
In summary, the catalyst of MnTiOx-loaded ATP (MnTiOx/ATP) was synthesized by the co-precipitation method. Then the different modification methods by cerium element were compared, and the results showed that the Ce–MnTiOx/ATP catalyst exhibited better catalytic activity than that of Ce/MnTiOx/ATP in low-temperature range. The excellent catalytic performance of the Ce–MnTiOx/ATP catalyst was mainly attributed to the increasing amount of oxygen vacancies and superoxide ions, which were improved by the introduction of cerium species. Moreover, the cerium doping in MnTiOx/ATP has a great improvement not only on N2 selectivity and SO2 & H2O resistance but also on stability. Therefore, it can be deduced that Ce–MnTiOx/ATP is a potential catalyst for the high NH3-SCR activity.
Supplementary Material
To view supplementary material for this article, please visit https://doi.org/10.1557/jmr.2018.242.
ACKNOWLEDGMENTS
This work was financially supported by National Natural Science Foundation of China (51674043); Development Fund of Jiangsu Province (BE2016654); Social development Fund of Changzhou City (CE20165022); Key R & D Programs of Jiangsu Province (BE2015103).