INTRODUCTION
Paleohydroclimate studies in the southwestern United States have greatly improved our understanding of the frequency and duration of past episodes of hot, drought conditions in the Great Basin (e.g., Cook et al., Reference Cook, Smerdon, Seager and Cook2014). That knowledge is particularly relevant as declining water supplies and growing populations present increasing water-management challenges (U.S. Department of the Interior, 2012). Many of the watersheds across this large region are supplied by groundwater coming from large, deep aquifers that are of growing interest to the metropolitan areas that draw from them (e.g., Welsh and Endter-Wada, Reference Welsh and Endter-Wada2017). Growing demands for water resources in Las Vegas, Nevada, resulted in proposals to withdraw groundwater from basins upgradient of the Pahranagat Valley north of the Las Vegas metropolitan area (Deacon et al., Reference Deacon, Williams, Deacon Williams and Williams2007; Southern Nevada Water Authority, 2011). Given the significant effect this would have on the water resources of the Pahranagat Valley and the Pahranagat National Wildlife Refuge (PNWR), the U.S. Fish and Wildlife Service completed significant hydrological studies between 2007–2009 (Wurster, Reference Wurster2010). As part of this effort, Sr and U isotopic and other geochemical data were collected from surface waters and groundwater in an effort to evaluate the hydrologic inputs from regional and local groundwater sources to the PNWR (Paces and Wurster, Reference Paces and Wurster2014).
The development and application of geologic tracers that allow identification of different groundwater sources as well as their mixtures, flow paths, and evolution through time can help elucidate paleohydrologic responses to climate shifts. This study uses geochemical tracers in Holocene lacustrine carbonates from a groundwater-fed, shallow, alkaline lake system in the PNWR that sits in an arid, Great Basin watershed. We build on the results of previous studies that established the utility of radiogenic isotopes of Sr and U tracers in modern sources of water in this same arid wetland setting (Paces and Wurster, Reference Paces and Wurster2014), and show that this tool also can be applied effectively to better understand paleohydrology and paleohydroclimate using these isotopes and other geochemical data obtained from authigenic carbonates.
Ratios of natural radiogenic isotopes of strontium (87Sr/86Sr) and uranium (234U/238U) have been used effectively to track modern groundwater sources and evaluate their evolution (Roback et al., Reference Roback, Johnson, McLing, Murrell, Luo and Ku2001; Ryu et al., Reference Ryu, Lee, Chang and Cheong2009; Pierret et al., Reference Pierret, Stille, Prunier, Viville and Chabaux2014; Paces et al., Reference Paces, Palmer, Palmer, Long and Emmons2020). The water-rock interactions of the various materials in an aquifer or varying flow paths in a watershed can impart distinct 87Sr/86Sr and 234U/238U fingerprints to the groundwater therein. Rocks and associated soils can exhibit a huge range of Sr compositions depending on their age and Rb/Sr ratio. The degree of 234U/238U disequilibrium can vary substantially due to water/rock ratios and the chemical aggressiveness of that interaction (Paces et al., Reference Paces, Ludwig, Peterman and Neymark2002). Thus, potential isotopic variability requires characterization of sources contributing to the water body of interest. However, once incorporated, dissolved Sr and U in most oxygenated groundwater systems tend to behave conservatively at their discharge points relative to compositional changes that occur through mixing processes.
Thus, Sr- and U-isotope measurements have been used together and effectively applied to identify multiple sources and mixing relationships among end members in waters from a variety of settings (Drexler et al., Reference Drexler, Paces, Alpers, Windham-Myers, Neymark, Bullen and Taylor2014; Paces and Wurster, Reference Paces and Wurster2014; Neymark et al., Reference Neymark, Premo and Emsbo2018; Miller et al., Reference Miller, Ewing, Payn, Paces, Leuthold and Custer2021; Garcia et al., Reference Garcia, Louvat, Gaillardet, Nyachoti and Ma2021). In arid settings, Sr and U isotopes have the advantage of retaining their distinct signatures when exposed to evaporation, transpiration, and other near-surface processes that are especially significant for other chemical tracers (Drexler et al., Reference Drexler, Paces, Alpers, Windham-Myers, Neymark, Bullen and Taylor2014; Paces and Wurster, Reference Paces and Wurster2014). Accordingly, measurements of Sr (Benson and Peterman, Reference Benson and Peterman1995; Bouchard et al., Reference Bouchard, Kaufman, Hochberg and Quade1998; Hart et al., Reference Hart, Quade, Madsen, Kaufman and Oviatt2004; Paces et al., Reference Paces, Peterman, Futa, Oliver and Marshall2007) and U (McGee et al., Reference McGee, Quade, Edwards, Broecker, Cheng, Reiners and Evenson2012) isotopes have been applied in arid-region carbonate sediments and rocks. Because Sr and U in pure carbonate precipitates are necessarily incorporated from dissolved constituents in the water column at the time of sediment deposition, one can apply these isotopic tracers to track the history of Sr- and U-isotope variation in lake water over the time represented in the record. Additionally, if the isotopic compositions of the primary water sources remain temporally invariant, one should be able to use the core data to suggest how water in the lake has responded to regional paleohydrological shifts over time.
We previously reported a sediment-based paleohydroclimate record spanning ca. 5.8 ka collected from a composite 12.4-m-long core from the Lower Pahranagat Lake (LPAH) in the Pahranagat National Wildlife Refuge of southern Nevada (Theissen et al., Reference Theissen, Hickson, Brundrett, Horns and Lachniet2019). Stable isotopic (δ18O and δ13C) and elemental proxies (TOC, C/N, and CaCO3) indicate that LPAH began to fill from a mid-Holocene lowstand at the earliest part of this core record, progressing from a marsh or peatland to a carbonate-rich shallow lake setting influenced by several distinct, century- and millennium-scale wet and dry periods. Microbial fabrics and other sedimentary facies characteristics in the core sediments align with and support this interpretation (Hickson et al., Reference Hickson, Theissen, Lamb and Frahm2018; Theissen et al., Reference Theissen, Hickson, Brundrett, Horns and Lachniet2019). The existence of LPAH and a series of associated wetlands within this highly evaporative region is only made possible and controlled by the strength of discharging groundwater sources that feed the Pahranagat Valley and PNWR.
Paces and Wurster (Reference Paces and Wurster2014) applied radiogenic Sr and U isotopes and concentrations to understand the modern water supply in the PNWR, establishing the utility of these isotopic proxies as tracers in this setting. They carried out a detailed hydrogeochemical investigation of the spring water sources and found that the primary spring sources have distinct combinations of 87Sr/86Sr and 234U/238U values. Paces and Wurster (Reference Paces and Wurster2014) further estimated the contributions of various water sources that constitute modern surface water sampled from various locations within the Pahranagat Valley and on the PNWR. The goal of this investigation is to extend the use of this approach to authigenic carbonates precipitated from LPAH lake water as a means of tracking variations in the mixture of regional and local groundwater sources supplying LPAH through the latter half of the Holocene. The LPAH core record is ideal for this investigation because it is both rich in authigenic carbonates (Hickson et al., Reference Hickson, Theissen, Lamb and Frahm2018) and has an excellent geochronological framework based on radiocarbon dating and Bayesian age-depth modeling (Theissen et al., Reference Theissen, Hickson, Brundrett, Horns and Lachniet2019). We reconstruct a nearly 6000-yr record of Sr- and U-isotope variation in LPAH waters. We apply a three-component mixing model with end members defined by their Sr and U concentrations and isotopic compositions of the three primary groundwater sources of modern groundwater discharge previously identified in the Pahranagat Valley (Paces and Wurster, Reference Paces and Wurster2014). Finally, we compare the resulting U-isotope time series record to our previously reported LPAH carbonate paleohydroclimate proxy (δ18O) record (Theissen et al., Reference Theissen, Hickson, Brundrett, Horns and Lachniet2019) and show how these combined proxies enhance our understanding of regional paleohydrology.
STUDY SITE HYDROLOGY, MATERIALS, AND METHODS
For this investigation, we sampled carbonate-rich sediments, fossil shells, and plant petrifactions (fossil plant matter formed by direct replacement of original cell structures) from an existing composite core record from LPAH. We measured these samples for both their Sr and U concentrations and isotopic values (87Sr/86Sr and 234U/238U). We also collected and made these same measurements on LPAH surface water samples. This approach allows us to trace and quantify the various sources of groundwater reaching LPAH since the mid-Holocene.
Modern hydrology and water chemistry of the study site
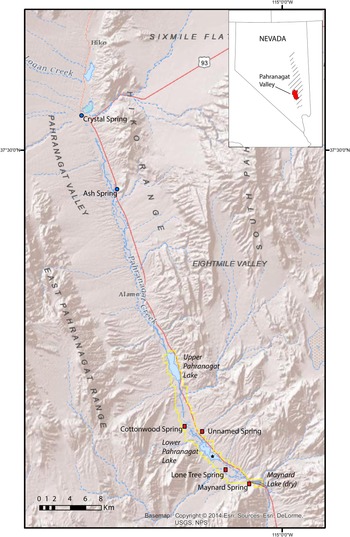
LPAH is a small (1.2 km2), shallow (average depth <1 m, maximum depth = 1.5 m), alkaline lake within the PNWR, a 17.7 km long, 21.8 km2 area that includes marshes, impoundments, and shallow lakes at the southern end of the Pahranagat Valley in southern Nevada (Fig. 1). Groundwater is the primary source of surface water that reaches LPAH; streamflow originates mostly from several large-volume springs (Crystal Spring and Ash Spring) discharging well north of the lake and flowing south through the Pahranagat Valley before entering the Refuge (Fig. 1). Most of this spring water comes from a deep regional carbonate aquifer, with springs in the Pahranagat Valley recharged in the White River groundwater flow system (Eakin Reference Eakin1963, Reference Eakin1966; Fig. 1). U.S. Geological Survey stream gages for the two springs with the highest discharge rates, Crystal and Ash, indicate average values of 340 L/s and 510 L/s, respectively, between 2004–2009, with little seasonable variability (Paces and Wurster, Reference Paces and Wurster2014). Springs located within the PNWR are distinct in terms of both discharge rates and source areas. The largest of these, Cottonwood Spring, had maximum discharge rates of 1.9–2.2 L/s and minimum rates of 0.9–1.1 L/s between 2007–2009 (Wurster, Reference Wurster2010). These springs and seeps are recharged in nearby mountain ranges and flow mostly through shallow, Tertiary volcanic rocks.
Site map of the Pahranagat Valley. Springs discharging from the regional carbonate aquifer are indicated with blue dots. Springs discharging from local volcanic aquifers are indicated with red squares. The PNWR boundary is indicated in yellow and the core site at LPAH is indicated with a star symbol. Inset map shows the boundaries of the Pahranagat Valley in Nevada highlighted in red. The area highlighted in diagonal lines indicates the boundaries of the regional carbonate aquifer as mapped by Eakin (Reference Eakin1966).

The PNWR and the greater Pahranagat Valley are areas of active tectonic extension and feature a series of ENE-trending strike-slip faults that play an important role in the hydrology, with the faults acting as conduits of the deep groundwater to the surface. Since the early 1930s, water supply to LPAH has been managed for irrigation of pastoral land by impounding water in Upper Pahranagat Lake (UPL), a reservoir on the northern end of the PNWR built in the 1930s by the Civilian Conservation Corps (Wurster, Reference Wurster2010). Prior to this time, groundwater discharged into the valley would have flowed to the southern end of the PNWR, pooling in LPAH and paleolake Maynard, which now is a drained and dry lakebed south of LPAH that represents the prehistoric terminus of the wetland system. The Pahranagat Valley is in a region with some of the highest evaporation rates in the United States. Wurster (Reference Wurster2010) calculated that open-water evaporation approaches 1676 mm/yr, which is >10 times the average annual precipitation.
Detailed water chemistry data for modern groundwater sources supplying the PNWR were reported previously (Paces and Wurster, Reference Paces and Wurster2014). Discharge from regional springs has compositions expected for groundwater in contact with carbonate rock. Stable O- and H-isotope data are consistent with recharge at higher latitudes under cooler conditions relative to modern precipitation that falls in the immediate vicinity of LPAH. Sr concentrations measured for Crystal and Ash springs ranged from 259–517 μg/L, with U concentrations ranging from 3.09–4.23 μg/L. Low-volume springs discharging into the Refuge from local, shallow aquifers have higher concentrations of both Sr (607–927 μg/L) and U (18.2–70.8 μg/L) relative to discharge from regional carbonate springs. In general, discharge from regional springs is rich in calcium and bicarbonate ions whereas water from local springs contain higher alkali and chloride contents reflecting the nature of their aquifer host rocks. Surface water in PNWR wetlands on its way to LPAH can become highly enriched in dissolved constituents with conductivities exceeding 5 mS/cm due to enrichment processes associated with evaporation and transpiration (Paces and Wurster, Reference Paces and Wurster2014). The previous study established that modern surface waters entering the PNWR are comprised of a 65:25:10 mixture of three primary spring sources (Crystal Spring, Ash Spring, local volcanic springs, respectively), with 90% ultimately derived as discharge from the deep regional carbonate aquifer and the remaining 10% from a shallow local volcanic aquifer (Paces and Wurster, Reference Paces and Wurster2014, fig. 5). Water from LPAH was not included in the previous study, but is contained within the same hydrologic system. Notably, modern LPAH water is especially alkaline, with concentrations of 558 mg/L of HCO3-at the northern end of the lake and increasing to 2364 mg/L at the southern end (Hickson et al., Reference Hickson, Theissen, Lamb and Frahm2018). For comparison, eight samples of modern surface water in Upper Pahranagat Lake have HCO3 concentrations of 347–540 mg/L with a median value of 449 mg/L (Paces and Wurster, Reference Paces and Wurster2014, supplementary material).
LPAH core sampling and preparation
Details of core collection from a platform floating on LPAH using a square-rod piston corer and winch-and-pulley system are described elsewhere (Theissen et al., Reference Theissen, Hickson, Brundrett, Horns and Lachniet2019). Sediment from the resulting 12.4-m-long composite sequence was sampled at 5- or 10-cm intervals for C and N elemental analyses and O and C stable-isotope analyses.
Samples from 30 of those same core intervals were used to obtain Sr- and U-isotope data for carbonate-rich material spanning the entire ca. 5800 cal yr section. We took care to select materials formed in the lake (e.g., mollusk shells, plant petrifactions, and bulk carbonate-rich sediment), which are characteristic throughout the composite core record. Where possible, intervals that contained multiple carbonate fractions were chosen. In two cases, peat samples were used. Where shells and plant petrifactions were present, bulk sediment from downcore intervals was washed through sieves ranging from 150–841-μm mesh sizes to concentrate materials that were then hand picking under liquid to avoid silicate detritus and organic matter as much as possible. Picked shells and plant petrifactions were vortex-mixed and sonicated repeatedly to remove fine-grained detritus as well. Although we cannot exclude the possibility of some detrital carbonate input, prior work (Theissen et al., Reference Theissen, Hickson, Brundrett, Horns and Lachniet2019) that included XRD mineralogy and magnetic susceptibility strongly suggests that the carbonate comprising core sediment is dominated by authigenic material with little or no detrital limestone.
LPAH sediment composition
The high carbonate alkalinity of LPAH waters is reflected in the composition of sediment in LPAH core samples, which have very high CaCO3 contents throughout (generally >50% and up to 86% by weight), primarily in the form of carbonate muds and silts with some intervals of microbial carbonate wavy laminations (Hickson et al., Reference Hickson, Theissen, Lamb and Frahm2018; Theissen et al., Reference Theissen, Hickson, Brundrett, Horns and Lachniet2019). Several intervals within the LPAH core also have well-preserved carbonate plant petrifactions and fossil gastropod shells. The plant petrifactions mostly appear as the remains of charophytes, which flourish in alkaline waters and occur in dense meadows in the modern lake (Theissen et al., Reference Theissen, Hickson, Brundrett, Horns and Lachniet2019). The oldest part of the LPAH core record contains two notably different sedimentary facies: a 12-cm-thick siliciclastic clay unit at the base of the record in sharp contact with an overlying 50-cm-thick peat layer.
Age-depth model
The chronology for the LPAH composite core record used in this study was previously developed and reported in Theissen et al. (Reference Theissen, Hickson, Brundrett, Horns and Lachniet2019). Those authors sampled the same core used here at 15 intervals for dating by 14C analysis. Seven of the dated samples were made up of a mixture of aquatic, emergent, and terrestrial plant materials. The remaining eight dated samples were composed of bulk organic matter. All samples were dated by accelerator mass spectrometry after removal of inorganic carbonate fractions through repeated acid washes. The possibility of incorporation of ancient carbon (radiocarbon dead) in groundwater discharging from the regional carbonate aquifer source in Pahranagat Valley, was evaluated by comparing dates determined from charred plant remains and bulk organic material. Evidence for a reservoir effect of 590 ± 30 14C years was established and used to adjust the resulting ages of 10 of the 15 radiocarbon dates. The resulting 14C dates were used to develop an age-depth model with Bacon v.2.2 Bayesian age-depth modeling software (Blaauw and Christeny, Reference Blaauw and Christeny2011), which uses the INTCAL13 database (Reimer et al., Reference Reimer, Bard, Bayliss, Beck, Blackwell, Ramsey and Buck2013) for age calibration. Numerical age estimates and associated uncertainties developed using that model for 1-cm depth internals are available elsewhere (Paces and Theissen, Reference Paces and Theissen2022) and shown graphically in Figure 2 along with core intervals sampled for Sr and U isotope studies.
Age-depth model for Lower Pahranagat Lake composite core record showing depths and resulting model ages for samples selected for isotope analysis in this study. The Bayesian depth-age model was developed using radiocarbon data reported in Theissen et al. (Reference Theissen, Hickson, Brundrett, Horns and Lachniet2019) using methodologies described therein. Solid red line indicates the best-fit depth-age relation with dashed blue lines representing 95% confidence bounds.

Pahranagat and LPAH water samples and preparation
Samples of water from springs, surface waters, shallow wells, and ditches from throughout the Pahranagat Valley and the PNWR were collected between 2007–2009 and analyzed as part of a previous study (Paces and Wurster, Reference Paces and Wurster2014). Seven surface-water samples from LPAH were collected as part of this study in 2015 and 2017 from shoreline and offshore locations in both the northern and southern parts of the lake. Samples were filtered in the field at 0.45 μm (2015 samples) or remained unfiltered until returned to the lab (2017 samples). In both cases, visible precipitates observed in the laboratory were the result of carbonate precipitation and dissolved completely after adding a small amount of high purity concentrated nitric acid in the lab to reliably obtain original dissolved Sr and U concentrations.
Methods used for Sr and U analysis
Carbonate-rich materials ranging between 0.003–0.140 g were weighed in 7-ml Teflon™ PFA vials and leached overnight at room temperature in ~1.5 ml of 5% acetic acid to minimize digestion of non-carbonate components. The supernatant was extracted after centrifugation at 10,000 rpm. Any remaining residue was discarded. The resulting leachate was spiked with a mixed 236U-233U-229Th tracer solution and allowed to equilibrate at elevated temperature (~100°C) overnight in capped vessels. Solutions were evaporated to dryness, refluxed with ultrapure concentrated 15N nitric acid, dried again, and then dissolved in 7N nitric acid prior to loading onto ion-exchange columns. Because residue weights were not quantified, concentrations of Sr or U were not determined by isotope dilution.
Sr and U isotopic compositions (87Sr/86Sr and 234U/238U) were determined on single aliquots of the acid leachates using separate ion chromatographic columns piggy-backed on top of each other so that the initial nitric-acid effluent from the upper columns (used to retain U with ~0.50 ml Biorad™ AG 1×8 resin) was fed directly onto lower columns (used to retain Sr with ~0.25 ml Eichrom™ Sr resin). Columns were separated after the first three resin volumes of nitric acid wash and processed separately to complete U and Sr purification following descriptions given elsewhere (Paces et al., Reference Paces, Palmer, Palmer, Long and Emmons2020, supplemental information).
Two separate splits of water samples were used to determine Sr concentrations and 87Sr/86Sr compositions. For Sr concentrations, small aliquots of water (~1 g) were weighed, acidified with an equal amount of concentrated nitric acid, spiked with an 84Sr-enriched tracer solution, and allowed to equilibrate overnight at elevated temperature. The resulting ~7N nitric solutions were loaded directly onto columns containing ~0.15 ml Eichrom™ Sr resin and processed independently. For 87Sr/86Sr compositions, separate, larger aliquots (6.4–11.5 g) were weighed into 15 ml vials, spiked with the mixed 236U-233U-229Th tracer solution, and equilibrated at elevated temperatures. After evaporation, samples were redissolved in 7N nitric acid. Any precipitates (typically silica) were dissolved in concentrated hydrofluoric acid, dried, redissolved in 7N nitric acid, and added to the first round of nitric-acid solutions. Sr and U salts were separated and purified following the same ion-exchange procedures described above for carbonate leachates.
All U- and Sr-isotope measurements were made on the Thermo Finnigan™ Triton thermal-ionization mass spectrometer (TIMS) at the USGS Radiogenic Isotope Lab in Denver. Purified Sr salts (both spiked and unspiked) were loaded onto single rhenium filaments along with a small amount of tantalum-oxide activator. For 84Sr-spiked water samples, values of 84Sr/86Sr were determined using a single MasCom™ discrete-dynode electron multiplier operating in peak jumping mode. Resulting data were used to determine Sr concentrations using isotope-dilution calculations (Faure and Mensing, Reference Faure and Mensing2005). Precision and accuracy of concentration determinations are better than 1%, as estimated by monitoring inter-laboratory comparison samples distributed as part of the Standard Reference Sample program administered by the USGS Branch of Quality systems (https://bqs.usgs.gov/srs/).
Measurements of unspiked Sr samples were run in dynamic triple-peak-jumping mode using static faraday cup measurements in each jump. Resulting 87Sr/86Sr ratios were normalized for instrumental fractionation using the accepted 86Sr/88Sr value of 0.1194. Data for 84Sr/86Sr were also collected during the same run to monitor the effectiveness of the fractionation correction. Total-process blank contributions for Sr varied between 50–100 pg, which is negligible compared to Sr abundances in processed samples (≥1 μg). The mean 87Sr/86Sr value obtained for the NIST international Sr-isotope standard, SRM987, collected over the period of analysis was 0.710251 ± 0.000007 (2σ: N = 272), which is within uncertainty of the accepted value of 0.710248 ± 0.000006 (McArthur et al., Reference McArthur, Howarth and Bailey2001). Fractionation-corrected 87Sr/86Sr values determined for unknown samples were corrected for instrument bias by applying the same normalization factor required to adjust the average measured SRM987 obtained for each batch of analyses to the accepted value. A secondary Sr-isotope standard, EN-1, analyzed as an unknown with each batch, yielded a mean 87Sr/86Sr value of 0.709174 ± 0.000009 (2σ; N = 191), which is identical to the accepted value of 0.709174 ± 0.000002 (± 2 × standard error; McArthur et al., Reference McArthur, Rio, Massari, Castradori, Bailey, Thirlwall and Houghton2006).
U salts were loaded onto the evaporation side of double rhenium filament assemblies. U-isotope measurements were made in peak-jumping mode using a single discrete-dynode secondary electron multiplier behind a retarding potential quadrupole (RPQ) energy filter. Raw U-isotope ratios were corrected for mass fractionation using the known 236U/233U value in the spike solution, as well as for spike contributions and procedural blanks (3–20 pg U). Measured 234U/235U values were converted to 234U/238U assuming a 238U/235U of 137.88 and were normalized relative to a standard value of 0.0000529 (± 0.0000011 2σ) for the 234U/238U atomic ratio in the international U-isotope standard, NIST SRM4321B, run during the same barrel. Corrected ratios were converted to [234U/238U] activity ratios (denoted hereafter with square brackets) using values for radioactive decay constants given by Steiger and Jäger (Reference Steiger and Jäger1977) and Cheng et al. (Reference Cheng, Edwards, Shen, Polyak, Asmerom, Woodhead and Hellstrom2013). Analyses of the NIST U-isotope standard, SRM4321B, determined over the same period yielded an average 234U/235U value of 0.007301 ± 0.000011 (2σ; N = 179), which is within analytical uncertainty of the certified value of 0.007294 ± 0.000028. Results for an in-house secular equilibrium standard derived from a 69-Ma-old uranium ore from the Schwartzwalder Mine (Ludwig et al., Reference Ludwig, Wallace and Simmons1985) yielded results that are consistent with the secular equilibrium value of 1.0000 (average [234U/238U] value of 0.9987 ± 0.0047 [2σ; N = 57]). All uncertainties presented herein are given at the 95% confidence level (± 2σ). Measured [234U/238U] values for core samples were corrected for in situ decay of 234U using ages assigned from the radiocarbon age-versus-depth model developed previously (Theissen et al., Reference Theissen, Hickson, Brundrett, Horns and Lachniet2019); however, the differences between measured and corrected values are with given analytical uncertainties.
RESULTS
Results of our Sr and U isotopic analyses of waters and sediments are shown in Tables 1 and 2 and are available electronically elsewhere (Paces and Theissen, Reference Paces and Theissen2022). All seven modern LPAH surface-water samples collected over a 2-year period have very similar 87Sr/86Sr values, ranging from 0.71113–0.71117 and [234U/238U] values ranging from 2.393–2.403 (Table 1). LPAH core materials show a wider range of values with 87Sr/86Sr values, ranging from 0.71076–7.1162 and [234U/238U] values ranging from 1.923–2.418 (Table 2).
Concentrations and radiogenic-isotope compositions for Sr (87Sr/86Sr) and U (234U/238U given as activity ratios) in water samples collected from Lower Pahranagat Lake. Estimates for the uncertainties of Sr and U concentrations are <1% of the given value.

Model radiocarbon ages, sample types, and radiogenic-isotope compositions for Sr (87Sr/86Sr) and U (234U/238U given as activity ratios) for carbonate-rich materials from Lower Pahranagat Lake core (37.2167°N, −115.0814°). Assigned ages use the radiocarbon data and Bayesian age model developed by Theissen et al. (Reference Theissen, Hickson, Brundrett, Horns and Lachniet2019).

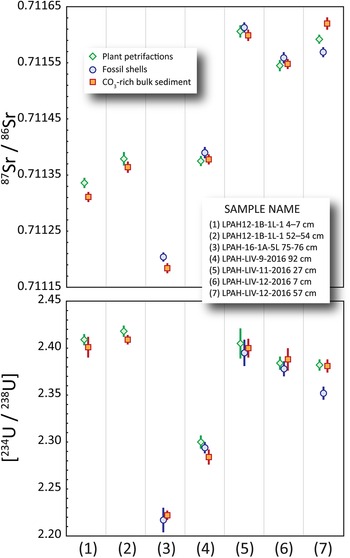
To help evaluate the reliability of different types of carbonate materials and to justify the assumption that all the analyzed carbonate materials accurately capture the isotopic compositions of the lake water from which they precipitated, multiple fractions separated from several of the same core intervals were analyzed. All three of the primary sample materials (shells/plant petrifactions/carbonate-rich bulk sediment) were analyzed from four downcore sample intervals (Table 2), and materials from another three intervals were analyzed for some combination of those three sample types (plant petrifactions/bulk sediment or shells/bulk sediment). In most cases, 87Sr/86Sr and [234U/238U] results for each interval are within or close to limits of analytical precision (Fig. 3). Results for one core interval (LPAH-LIV-12-2016 57 cm) show greater dispersion relative to those from other intervals; however, differences remain small compared to the total range of observed compositions. Furthermore, there are no systematic differences in composition among the different sample types, suggesting that all three materials inherited their Sr and U compositions from a homogeneous reservoir (that is, from ions dissolved in the same water column). These results provide confidence that data collected from the remaining core intervals reflect evolving LPAH water compositions regardless of the type of material analyzed.
Comparison of 87Sr/86Sr (upper) and [234U/238U] (lower) isotopic compositions of multiple carbonate-rich materials (plant petrifactions, fossil shells, bulk sediment) separated from the same core intervals. Error bars are shown as 2σ uncertainties. Data are from Table 2.

Resulting [234U/238U] determined in the most recently formed LPAH carbonates (values of 2.401 and 2.409 in sample LPAH12-1B-1L-1 4-7 cm) are similar to values determined in modern LPAH surface water samples given above. However, 87Sr/86Sr compositions for those same youngest carbonate fractions (0.71131 and 0.71134) are greater than values measured in LPAH surface water (average value of 0.71115). That compositional shift from 87Sr/86Sr in the “youngest” sediment (core taken from depth of 5.5 cm) to values obtained from LPAH water collected in 2015 and 2017 is likely caused by water management practices on the PNWR. After the construction of Upper Pahranagat Lake in the early half of the twentieth century, inflow to the refuge has been concentrated in its northern third, resulting in drying conditions in the southern two thirds, including LPAH (Wurster, Reference Wurster2010). More recent water diversions, such as the 2007 draining of Upper Pahranagat Lake for maintenance (Paces and Wurster, Reference Paces and Wurster2014), also may have contributed to differences between modern and Holocene hydraulic conditions.
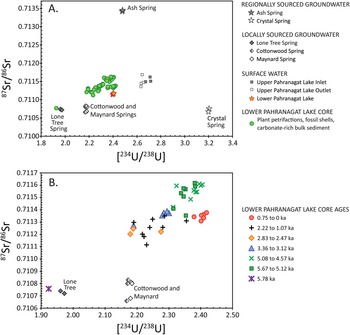
An initial assessment of the results for core samples can be made by comparing the 87Sr/86Sr and [234U/238U] data for LPAH samples to important PNWR modern groundwater sources reported previously (Paces and Wurster, Reference Paces and Wurster2014). The combined Sr- and U-isotope values for most Holocene LPAH carbonate samples fall within the field defined by the three primary spring sources (Ash, Crystal, Lone Tree/Cottonwood), but notably to the low-[234U/238U] side of values measured in modern UPL inlet waters (Fig. 4A). Also notable is that compositions for core samples are substantially more dispersed than the tight cluster of values measured in modern LPAH water samples (red-orange stars in Fig. 4A). Viewed in this way, the Sr and U results are consistent with varying mixtures of those water sources supplying LPAH from mid-Holocene to modern time. The most obvious exception is the oldest sample (5.78 ka) from the clay-rich layer in which both 87Sr/86Sr and [234U/238U] values are anomalously low (0.71076 and 1.923, respectively) and nearly match values for modern water discharging at Lone Tree Spring. Those results are consistent with a LPAH water body that was derived almost exclusively from groundwater from local volcanic aquifer sources (Fig. 4). Results for younger core samples tend to cluster in temporal groups having higher values of both 87Sr/86Sr and [234U/238U] relative to the basal sample (Fig. 4B). Compositions grouped into sequential intervals include substantial overlap; however, the combined data indicate systematic shifts that follow a pattern similar to compositions of modern water based on spatial distributions throughout the PNWR that previously were attributed to mixing of different groundwater sources (Paces and Wuster, Reference Paces and Wurster2014).
Cross plot diagrams of [234U/238U] vs. 87Sr/86Sr isotopic values for LPAH core samples showing their positions relative to compositions of modern water sources. (A) All LPAH core samples (green circles; data from Table 2) along with key aquifer sources in the Pahranagat Valley (black and white stars and diamonds; data from Paces and Wurster, Reference Paces and Wurster2014). Also shown are compositions for modern LPAH water (red-orange stars; data from Table 1) and other surface-water samples from the Pahranagat National Wildlife Refuge (data from Paces and Wurster, Reference Paces and Wurster2014). (B) Cross plot showing an expanded view of data in A with LPAH core samples grouped by age in 1000-year bins (data from Table 2). The anomalous composition of the oldest (5.78 ka) clay-rich sample is unique, plotting near the composition for modern groundwater from Lone Tree spring. Two-sigma analytical error bars are typically smaller than the size of the symbols.

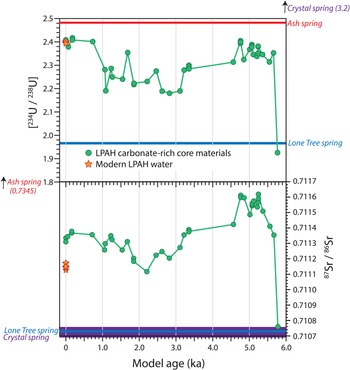
Time-series plots of the 87Sr/86Sr and [234U/238U] values show the largest compositional shift occurring shortly after 5.78 ka, where both 87Sr/86Sr and [234U/238U] rose sharply by 5.67 ka marking a dramatic shift in LPAH hydrologic conditions (Fig. 5). Both 87Sr/86Sr and [234U/238U] values remained elevated until ca. 4.8 ka, with 87Sr/86Sr values reaching their highest levels (up to 0.71162) for the entire record. Values dropped significantly after 4.77 ka with a sustained period when both 87Sr/86Sr and [234U/238U] values remained relatively low between ca. 3.12 ka–1.86 ka. After 1.86 ka, 87Sr/86Sr values rose and remained moderately high through the remainder of the record, although never approaching the high values observed for samples deposited between 5.37–4.77 ka. In contrast, [234U/238U] values show a more subtle rise from 2.63 ka until ca. 1.07 ka. After that, values rose sharply to reach their highest levels for the entire record (up to 2.418) in the last 750 years.
Time series plots of [234U/238U] (top) and 87Sr/86Sr (bottom) compositions for carbonate-rich materials (green circles) from the entire ca. 5.8 ka LPAH core record. Assigned ages use the radiocarbon data and Bayesian age model developed by Theissen et al. (Reference Theissen, Hickson, Brundrett, Horns and Lachniet2019). Compositions of modern LPAH lake water are shown as red-orange stars. Compositions of modern spring water end members are shown as color-coded horizontal lines. Data are from Tables 1 and 2. Two-sigma analytical error bars are typically smaller than the size of the symbols.

DISCUSSION
Carbonates precipitated from LPAH water and deposited over a period spanning the past ca. 6 ka have Sr and U isotopic compositions that fall within the range defined by the main modern spring sources in Pahranagat Valley and show systematic shifts throughout the latter half of the Holocene. The similarity of isotopic compositions of young core materials and modern LPAH water as well as the similarity of compositional shifts along the same trends observed for modern waters elsewhere in PNWR add confidence that the LPAH carbonates faithfully record the Sr and U isotopic signatures of LPAH waters through time. In the following discussion, we start with an assessment of the assumption of temporal compositional uniformity of hydrologic sources, followed by an evaluation of the mixing of source waters as revealed by the LPAH carbonate results and a discussion of insights gained about paleohydroclimatic change from the mid-Holocene to present.
Temporal uniformity of aquifer sources
The assumption that Sr and U isotopic compositions of groundwater discharging into Pahranagat Valley remained constant through time is difficult to confirm. Studies attempting to evaluate paleohydrologic shifts in lacustrine settings using Sr isotopes have relied on 87Sr/86Sr compositions of modern rivers flowing into the basins or on geologic components in tributary catchments that contribute Sr via weathering as input sources without questioning whether those components have evolved with time (Benson and Peterman, Reference Benson and Peterman1995; Bouchard et al., Reference Bouchard, Kaufman, Hochberg and Quade1998; Rhodes et al., Reference Rhodes, Carroll, Pietras, Beard and Johnson2002; Hart et al., Reference Hart, Quade, Madsen, Kaufman and Oviatt2004; Doebbert et al., Reference Doebbert, Johnson, Carroll, Beard, Pietras, Carson, Norsted and Throckmorton2014; Vonhof et al., Reference Vonhof, van der Lubbe, Joordens, Feibel, Junginger, Garcin, Krause-Nehring, Beck and Johnson2016). Unlike those larger basins, the main source of water supply to LPAH in the last 6 ka is groundwater discharging from regionally and more locally sourced aquifers. Although some alluvial deposits flooring central Pahranagat Valley are associated with the ancestral White River during late Pleistocene pluvial periods (Jayko, Reference Jayko2007), increased aridity at the onset of the Holocene (Wigand, Reference Wigand, Isaacs and Tharp1997; Winograd et al., Reference Winograd, Landwehr, Coplen, Sharpe, Riggs, Ludwig and Kolesar2006) precluded substantial hydrologic contributions from interbasin streamflow originating north of the valley. Thus, the question of compositional uniformity of LPAH sources depends on potential changes to aquifer dynamics.
Unlike isotopes of H and O that depend largely on variable compositions of precipitation in recharge areas, dissolved Sr and U are obtained from water-rock interactions in recharge areas and along aquifer flow paths. For most aquifers, those aspects do not shift with time, although dissolved [234U/238U] compositions can be dependent on changes in weathering rates under different climate conditions (Maher et al., Reference Maher, Ibarra, Oster, Miller, Redwine, Reheis and Harden2014; Francke et al., Reference Francke, Dosseto, Just, Wagner and Jones2020). A particularly useful record allowing evaluation of [234U/238U] compositions with time comes from cores of phreatic wall coatings submerged in the regional carbonate aquifer at Devils Hole, southern Nevada (Winograd et al., Reference Winograd, Coplen, Landwehr, Riggs, Ludwig, Szabo, Kolesar and Revesz1992). Original core samples documented systematic [234U/238U] variations of ~0.15–0.2 for travertine layers deposited between 60–600 ka (Ludwig et al., Reference Ludwig, Simmons, Szabo, Winograd, Landwehr, Riggs and Hoffman1992). More recently, that record has been extended into the Holocene (Winograd et al., Reference Winograd, Landwehr, Coplen, Sharpe, Riggs, Ludwig and Kolesar2006; Wendt et al., Reference Wendt, Pythoud, Moseley, Dublyansky, Edwards and Spötl2020). Initial [234U/238U] values for 5 travertine layers ranging in age from 4.9–8.8 ka vary less than 0.011 (2.741 ± 0.002 to 2.750 ± 0.002), with an average value (2.747) that is similar to the value for modern groundwater (2.762; data from Wendt et al., Reference Wendt, Pythoud, Moseley, Dublyansky, Edwards and Spötl2020). The total range of [234U/238U] variability of 0.021 for Holocene Devils Hole groundwater is more than an order of magnitude smaller than the 0.239 range of values observed for Late Holocene LPAH carbonates (2.418–2.179, excluding the deepest core interval). The larger variations in [234U/238U] observed over longer time scales have been interpreted to reflect climate-controlled changes in water table elevations where groundwater high-stands are able to leach excess 234U that accumulates in unsaturated aquifer rock during periods of water-level low stands (Paces et al., Reference Paces, Palmer, Palmer, Long and Emmons2020; Wendt et al., Reference Wendt, Pythoud, Moseley, Dublyansky, Edwards and Spötl2020). That mechanism is not available at time scales restricted to the Holocene.
Similar records for Holocene deposits associated with the volcanic aquifer are not known; however, it is likely that aquifer processes including recharge and subsurface flow are similar. Likewise, there is a paucity of detailed records of Sr-isotope variability in phreatic deposits that can be directly related to aquifer compositional stability. Paleoclimate records from speleogenic deposits focus on vadose settings specifically because of their short flow paths and near-recharge conditions that remain undampened by the averaging effects of groundwater flow. We conclude that radiogenic-isotope compositions of discharge from aquifers supplying LPAH lake water are buffered from rapid response to short-term environmental effects, especially over the relatively recent past (last ca. 6 ka), and that the variations preserved in LPAH carbonates reflect variations in the proportions of those sources rather than changes to the compositions of the sources themselves.
Source-mixing analysis
Because the three main water sources to the PNWR have distinct Sr and U isotopic signatures, the 87Sr/86Sr and [234U/238U] compositions for surface waters within the refuge can be used to determine the proportions of those constituents despite large chemical changes in LPAH water caused by near-surface processes such as pan evaporation, plant transpiration, mineral precipitation, and sorption-desorption processes. Paces and Wurster (Reference Paces and Wurster2014) expanded the use of simple binary isotope-mixing theory described in Faure (Reference Faure1986, chapter 9) and Faure and Mensing (Reference Faure and Mensing2005, chapter 16) to include the three endmember components in order to explain mixing of modern PNWR surface waters. We use a similar methodology here to examine shifts in source contributions to LPAH water assuming the radiogenic-isotope compositions of groundwater discharging from well-established aquifer systems remained constant throughout the Holocene.
In a system with two endmembers, X and Y, the concentration of any element in the mixture, CM, is dependent on the concentrations of that element in both end members, CX and CY, and the fraction of mixing, f (from 0 to 1):

Two component mixtures will result in concentrations that define a straight line between the end-member compositions on plots of CX versus CY that are directly proportional to the value of f. The isotopic composition of the mixture, RM, depends on the isotope ratios of both end members, RX and RY, as well as their elemental concentrations:

Because values of RM are most strongly influenced by the component with the highest concentration, mixing curves no longer define straight lines (unless CX = CY) on plots of RM versus CM, but instead, a family of hyperbolic curves whose degree of curvature depends on the difference between CX and CY (Faure and Mensing, Reference Faure and Mensing2005). Furthermore, mixing fractions are no longer distributed evenly along the curve, but become compressed toward the end member with the highest concentration. Binary mixtures of Sr and U from sources with different isotope ratios can be combined using two sets of mixing equations. When plotted in [87Sr/86Sr]-[234U/238U] space, the shape of mixing curves will depend on values of U/Sr in both components X and Y. Values of 87Sr/86SrM and [234U/238U]M for any given value of f will plot along the curve depending on values of SrX, SrY, UX, and UY. Three-component mixing of 87Sr/86Sr and [234U/238U] among components X, Y, and Z can be treated as a series of separate two-component mixtures using concentrations and isotope ratios determined for intermediate composition along mixing curves between X-Y, X-Z, and Y-Z end members. If all three components are present, mixtures will plot within the polygonal space defined by the three 2-component mixing curves (dark blue lines on Fig. 6).
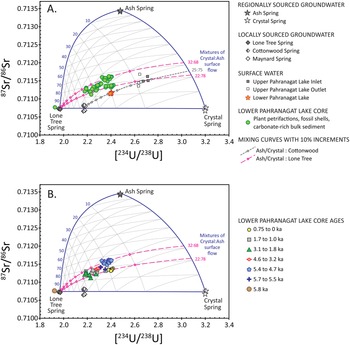
Cross plots of Sr and U isotopic compositions showing 3-component mixing webs based on compositions measured for modern groundwater discharge from regional and local spring sources. (A) Modern surface-water samples in the PNWR (Upper Pahranagat Lake inlet and outlet samples plus LPAH water samples) form a 2-component mixing line (gray line with short dashes) between water entering the Pahranagat Wildlife Refuge, having a composition derived from a 25:75 mixture of Ash:Crystal Spring discharge, with water discharging from Cottonwood Spring source, the most important modern local volcanic aquifer source. Also shown are two additional mixing lines (pink dashed lines) using different mixtures of Ash:Crystal discharge to represent surface water entering the Refuge and water from nearby Lone Tree Spring. Those two mixing lines closely bound observed compositions of carbonate-rich LPAH core samples (green circles). (B) Cross plot showing the sample data and mixing web shown in (A), but with compositions of LPAH core samples grouped by core-interval age. Data for LPAH water and core samples are from Tables 1 and 2; data for modern groundwater and Upper Pahranagat surface-water samples are from Paces and Wurster (Reference Paces and Wurster2014). Two-sigma analytical error bars are typically smaller than the size of the symbols.

To estimate proportions of each source component, we constructed ternary mixing webs between end-member compositions of Crystal Spring, Ash Spring, and Lone Tree Spring (chosen because of its compositional similarity to that of the basal, clay-rich core interval) by calculating individual two-component mixing curves between intermediate end members consisting of values for CM and RM determined at 10% intervals of f for mixtures along all three two-end-member curves (light lines in Fig. 6). For instance, compositions that consist of a mixture of water having end-member compositions of 0.9:0.1 Ash:Lone Tree and 0.9:0.1 Crystal:Lone Tree will fall along the first sub-vertical curved gray line to the left of the dark blue Ash:Crystal mixing line in Figure 6. The remaining 26 mixing lines were constructed from intermediate mixtures of the three main source components in a similar manner. The resulting mixing relations among the three major components form a warped ternary plot whose shape and mixing intervals depend on both compositions and concentrations in end-member sources. Because of the non-linear nature of mixing relations, intervals are not distributed linearly between end members unless concentrations are identical. End members with the highest concentrations will have the greatest influence on the resulting mixture with mixing lines compressed toward that end member.
Modern UPL and LPAH waters fall along a distinct two-component mixing line reflecting a 25:75 mixture of discharge from Ash and Crystal springs flowing southward into the PNWR with varying amounts of local spring discharge (in this case with compositions similar to Cottonwood Spring; gray dashed line on Fig. 6A). LPAH water samples fall at a position on this mixing line suggesting that 35–40% of the water in the lake is derived from Cottonwood Spring, which is the primary local source in the modern system (Fig. 6A).
Values of 87Sr/86Sr and [234U/238U] for the oldest LPAH core sample nearly match the Sr and U signatures of modern Lone Tree Spring. Therefore, at ca. 5.78 ka, we posit that local spring discharge dominated water supply to LPAH. All younger LPAH core samples fall along or between two binary mixing lines that reflect varying proportions of this local groundwater source with surface flow originating from Ash and Crystal springs north of the PNWR. Mixing proportions between the regional-carbonate aquifer end members range from 22–32% Ash Spring groundwater and 78–68% Crystal Spring groundwater (pink dashed lines on Fig. 6). Core samples younger than 5.78 ka indicate that surface flow into LPAH from the north became the dominant component in lake water, although contributions from a local groundwater source similar to Lone Tree Spring remained important, constituting between <20% to nearly 40% of the total water supply.
Changing mixtures through time
The mixing calculations and diagrams allow us to make more detailed interpretations of changing source-water mixtures through time (Fig. 6B). As noted, the oldest sample (5.78 ka) has a combination of low Sr and U values that nearly match compositions of modern discharge from Lone Tree Spring. The distinct clay-rich siliciclastic nature of this horizon is consistent with water derived from a volcanic-rock-hosted aquifer having low amounts of dissolved calcium and carbonate ions. These observations are interpreted as evidence that groundwater from the regional carbonate aquifer was not reaching LPAH at the time, either because of low discharge volumes or due to diversion of that flow elsewhere in the valley. Theissen et al. (Reference Theissen, Hickson, Brundrett, Horns and Lachniet2019) suggested that this depositional episode may reflect a period of increased surface runoff from the surrounding alluvial fans in the basin. However, runoff is likely to have [234U/238U] values lower than those observed in the clay unit (typically ~1.6 for ephemeral streamflow and soil carbonate; Paces et al., Reference Paces, Ludwig, Peterman and Neymark2002; Paces and Whelan, Reference Paces, Whelan and Stuckless2012), and although permissible, is not required given the similarity of the clay value and Lone Tree Spring water.
By 5.67 ka, LPAH core samples of peat have notably higher 87Sr/86Sr and [234U/238U] values and plot in a position on the mixing web that shows the regional aquifer source contributed significant amounts of water to the LPAH system (cross symbols in Fig. 6B). Compositions of carbonate core samples deposited between 5.37–4.77 ka fall on and around the higher two-component mixing line (blue pentagons in Fig. 6B), indicating that surface flow into LPAH consisted of an ~32:68 mixture of Ash:Crystal spring waters. Contributions from local aquifers were variable during this period, ranging from only ~15–22%. LPAH core samples deposited from 4.57–3.23 ka (red diamonds in Fig. 6B) followed by samples deposited from 3.12–1.86 ka (green triangles) have lower 87Sr/86Sr and [234U/238U] values, which indicate increased amounts of supply from the local Lone Tree Spring source (most between 25% to nearly 40%) and smaller contributions of water from the regional carbonate source, possibly caused by a decreased amount of discharge from the Ash Spring source (an Ash:Crystal ratio of ~22:78). Core samples with ages between 1.69–1.07 ka have compositions that mostly fall between the 22:78 and 32:68 mixing lines shown on Fig. 6B. Contributions from local volcanic aquifers start to decrease during this period, starting off between 30–35% of the Lone Tree Spring component and dropping to ~20%. Finally, LPAH samples deposited after 0.75 ka have 87Sr/86Sr and [234U/238U] compositions that reflect further decreases from local spring discharge (~18–20%) and increases in contributions from regional spring sources that now include greater contributions from Crystal Spring (Ash:Crystal ratio of 22:78) relative to the larger amounts from Ash Spring observed in older samples (e.g., 5.37–4.77 ka). However, compositions of core samples younger than 0.75 ka still reflect the influence of a Lone Tree-type local source with lower [234U/238U] compared to modern wetland water samples farther north in Middle Marsh that have a local groundwater component sourced from volcanic aquifers with higher [234U/238U] values (i.e., Cottonwood and Maynard springs).
Today, Cottonwood Spring is the most significant of the local groundwater sources within the PNWR in terms of discharge, while Lone Tree Spring has a very low discharge in comparison. Piezometers installed at PNWR springs measured consistent year-round upward hydraulic gradients at Cottonwood Spring, whereas vertical water movements at Lone Tree Spring were slight, exhibiting both gaining or losing conditions depending on season (Wurster, Reference Wurster2010, fig. 4-8). We also note that 87Sr/86Sr and [234U/238U] compositions of modern LPAH surface water falls along the 2-component mixing curve projecting to Cottonwood Spring rather than Lone Tree Spring, unlike compositions for Holocene core deposits (Fig. 6A). The explanation for a change in the role of these local spring sources is unclear, but it is possible that fault movement is at least partly involved. The PNWR falls within a tectonically active region known as the Pahranagat Shear Zone (Kreemer et al., Reference Kreemer, Blewitt and Hammond2010) cut by numerous strike-slip faults including the Buckthorn and Maynard Lake faults, which bound the lake on the north and south respectively. A Quaternary fault scarp has been identified along the Maynard Lake fault (Muhammad, Reference Muhammad2016) and any significant movement might account for changes in the local hydrology over the last several hundred years.
Paleohydrologic trends deduced from combined U- and O-isotope data
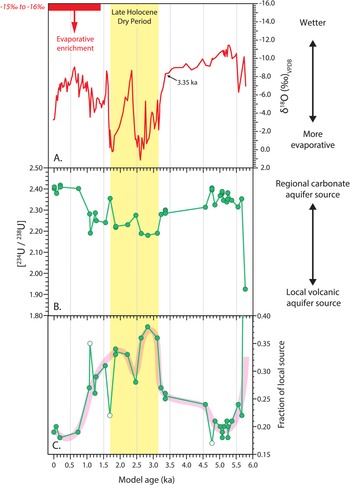
δ18O values in PNWR surface waters are strongly influenced by evaporative enrichment (Paces and Wurster, Reference Paces and Wurster2014), which is recorded in LPAH carbonates (Hickson et al., Reference Hickson, Theissen, Lamb and Frahm2018; Theissen et al., Reference Theissen, Hickson, Brundrett, Horns and Lachniet2019). We used δ18O data previously determined from LPAH core samples (Theissen et al., Reference Theissen, Hickson, Brundrett, Horns and Lachniet2019) along with the radiogenic-isotope proxies presented here to reconstruct a paleohydroclimate record spanning ca. 5.8 kyr. Results indicate that LPAH progressed from a marsh or peatland to a carbonate-rich shallow lake setting after ca. 5.5 ka. Based on the precipitous increase in δ18O values (top panel in Fig. 7), the relatively wetter climate conditions supporting those paleohydrologic environments persisted until ca. 3.35 ka. During the period between 3.15–1.7 ka (yellow-shaded band in Fig. 7), strong δ18O isotopic enrichments suggest notably drier conditions spanning the period recognized elsewhere in the Great Basin as the Late Holocene Dry Period (LHDP; Mensing et al., Reference Mensing, Sharpe, Tunno, Sada, Thomas, Starratt and Smith2013).
Time series plot of O and U isotopic data for carbonate-rich LPAH core samples deposited over the past 5.8 ka. Assigned ages use the radiocarbon data and Bayesian age model developed by Theissen et al. (Reference Theissen, Hickson, Brundrett, Horns and Lachniet2019). (A) δ18O data (red line; data from Theissen et al., Reference Theissen, Hickson, Brundrett, Horns and Lachniet2019) with an inverted scale where the smallest (most negative) δ18O values plot towards the top and the largest (most positive) values plot towards the bottom for better visual comparison with uranium-isotope data shown in (B) the lower panel. The red bar and text “−15‰ to −16‰” indicates the calculated δ18O range for calcite in equilibrium with the volcanic water source measured from Cottonwood Spring with average δ18OVSMOW of −12.8‰ (Paces and Wurster, Reference Paces and Wurster2014) at 20°C and expressed relative to the PDB standard based on equations from Friedman and O'Neill (Reference Friedman, O'Neill and Fleischer1977). The red arrow shows the effects of evaporation on δ18O in LPAH water and its subsequent incorporation into carbonate material. (B) 234U/238U activity ratios (green line and circles) in carbonate materials directly inherited from U dissolved in LPAH water. Two-sigma analytical error bars are typically smaller than the size of the symbols. The Late Holocene Dry Period recognized by Mensing et al. (Reference Mensing, Sharpe, Tunno, Sada, Thomas, Starratt and Smith2013) is highlighted in yellow. (C) Quantitative estimates of the fraction of waters coming from local volcanic aquifer source waters.

The combination of the existing δ18O data and the new [234U/238U] data are useful in better understanding paleohydroclimatic episodes in the Pahranagat Valley. We apply the same assumptions to the δ18O record that were used in the Theissen et al. (Reference Theissen, Hickson, Brundrett, Horns and Lachniet2019) study. Namely, that the oxygen isotopic composition of precipitation, and therefore the isotopic composition of the aquifer, was constant, that precipitation was of minimal significance in the overall water budget, and the lake was hydrologically closed as it is today. The δ18O values from the fine-grained fraction separated from authigenic carbonate material in the LPAH core record serve as an indicator of paleohydroclimate, with higher δ18O values indicating more evaporative conditions and lower δ18O values indicating wetter conditions affecting LPAH and the surrounding region (top panel of Fig 7). The [234U/238U] values of LPAH carbonates serve as a general indicator of contributions from local versus regional groundwater sources supplying the lake. Lower [234U/238U] values are present in groundwater from local volcanic aquifers (Lone Tree, Cottonwood, and Maynard springs) and carbonate groundwater discharging from Crystal Spring, whereas higher [234U/238U] values are uniquely associated with groundwater discharging from Ash Spring (Figs. 4A, 6).
Although the differing resolutions and magnitudes of variability and the likelihood of decoupling of processes affecting different isotope systems complicate rigorous statistical correlation, the data shown in Figure 7 imply the presence of an inverse relationship between [234U/238U] and δ18O values (note that in the figure this appears to be a direct relationship because the scale for δ18O has been inverted for better visual comparison). This would suggest that wetter, less-evaporative intervals in the LPAH record, as indicated by lower δ18O values, favor greater contributions of water coming from the regional carbonate aquifer source as indicated by higher [234U/238U] values. Conversely, during drier, more-evaporative intervals indicated by higher δ18O values, the local volcanic groundwater aquifer likely assumes more significance as a source of water to the lake as indicated by lower [234U/238U] values.
Why would the regional carbonate aquifer source be contributing a greater proportion of the waters during wetter intervals and the local volcanic aquifer source be contributing a greater proportion of the waters during drier periods? One possible explanation is that atmospheric circulation patterns shifted through time in ways that favored this change. The source of most precipitation to the Pahranagat Valley and the broader Great Basin is large winter storm systems from the Pacific Ocean. A somewhat smaller source of precipitation to the southern Great Basin and the Pahranagat (estimated at ~25%; Tyler et al., Reference Tyler, Chapman, Conrad, Hammermeister, Blout, Miller, Sully and Ginanni1996) comes from a monsoon-like climate pattern that drives summer convective storms northward from the Gulf of California to the south and west of LPAH. Importantly, this summer season source of moisture is likely to provide input for distinct recharge areas and follow different flow paths from the winter precipitation sources, and therefore is more likely to enter the lake via direct surface flow or through the local spring source with its shallower aquifer. In contrast, the regional carbonate aquifer (Fig. 1) has recharge areas that stretch far to the north of the Pahranagat Valley and LPAH. These recharge areas are fed by winter precipitation sources, which largely occur at higher latitudes and elevations. El Niño and La Niña events typically modify these winter sources, resulting in wetter and drier winters in the region, respectively. Centennial- to millennial-scale dry episodes across the central and southern Great Basin, such as the Late Holocene Dry Period, are hypothesized to occur during periods of La Niña-like conditions with a negative Pacific Decadal Oscillation PDO phase in the Pacific and a positive Atlantic Multi-decadal Oscillation (AMO) phase in the Atlantic, which reduces this primary winter season source of moisture to the region (Mensing et al., Reference Mensing, Sharpe, Tunno, Sada, Thomas, Starratt and Smith2013). We hypothesize that during the overall drier periods such as the LHDP, the summer monsoon source may have remained largely unchanged while the larger winter source of moisture feeding the recharge areas to the north of LPAH were reduced. During wetter intervals such as the period between 5.5–3.4 ka and a distinct wet period within the LHDP (ca. 2.3–2.4 ka), such La Niña-like conditions most likely did not exist, and regional-source recharge areas were receiving a more normal level of precipitation.
A second consideration relates to the changing volume of the lake during wet and dry conditions. LPAH volume would have changed during wetter and drier climate conditions, and even a small change in volume would result in compositional changes. It is important to keep in mind that the Sr-U isotopes provide information about relative source contributions, but not about actual fluxes. These data cannot tell us whether compositional changes were caused by increased fluxes from regional aquifer sources or decreased fluxes from local aquifer sources during different climate states, only that their proportions changed. For example, wetter climates presumably could sustain greater fluxes from the regional aquifer resulting in larger lake volumes and less obvious contributions from local sources. In drier climate conditions, those regional sources are reduced, as is lake volume, allowing contributions from the local aquifer source to be more obvious.
Varying proportions of regional versus local groundwater sources deduced from [234U/238U] data will also affect the oxygen-isotope composition of water within LPAH. Modern groundwater sources have differences in δ18O values caused by recharge at higher elevations and latitudes for the regional carbonate aquifers and lower elevations and latitudes for local volcanic aquifers. As a result, reported δ18O values for discharge from Crystal and Ash springs ranged from −14.1 to −14.4‰ whereas discharge from Cottonwood Spring, the largest volume spring on the refuge, had δ18O values of −12.6 to −12.9‰ (Paces and Wurster, Reference Paces and Wurster2014). Values reported for Lone Tree Spring were even higher (−11.1 to −11.2‰), although those values are likely affected by near-surface evaporation associated with the low volume of discharge where samples were collected.
For LPAH water associated with the most-evaporative period between 3.15–1.70 ka, Sr- and U-isotope mixing relations imply that ~33–38% of LPAH water consisted of discharge supplied from local volcanic aquifers (Fig. 7C). Using isotope compositions for modern groundwater, a 32:68 mixture of Ash:Crystal discharge would have a δ18O value of −14.3‰, and a mixture of that water with 30–40% discharge from Cottonwood Spring would result in LPAH water with δ18O values of −13.9 to −13.7‰. The same mixing scenario with modern Lone Tree Spring water would yield LPAH δ18O values of −13.4 to −13.0‰. Changes in environmental conditions over the last 5000 years also may have affected δ18O of paleo-recharge compared to modern recharge, although not to the extent expected during the last glacial maximum (LGM). Nevertheless, it is likely that the differences in δ18O values between recharge in regional versus local aquifer systems remained similar to those observed today. In the source-mixing scenarios described previously, the δ18O values present in LPAH water are expected to shift to larger values by no more than 0.5–1.5‰. In contrast, data in Figure 7 show that δ18O values in LPAH carbonates shifted by >8‰ during the Late Holocene Dry Period. The temperature change required for such a shift would be >20°C and unreasonably large. Nor do we think that the large δ18O shift is due to inputs of detrital carbonate. In the current investigation and in our previous efforts (Theissen et al., Reference Theissen, Hickson, Brundrett, Horns and Lachniet2019) to identify and distinguish any potential detrital input, we used magnetic susceptibility to identify potential intervals of detrital input and found two distinct intervals that were marked by a jump in siliciclastic input and corresponding drop in carbonates. We analyzed fine-fraction <63 μ calcite in effort to isolate authigenic materials. We also did a mineralogical analysis of LPAH carbonates with XRD and found no systematic variation in the type of carbonate during the LHDP. Moreover, evidence that the δ18O shift results from hydrologic processes (evaporation) rather than inclusion of detrital carbonate includes the notable positive covariance between the δ18O and δ13C values in LPAH carbonates throughout the LPAH record (including the LHDP; Theissen et al., Reference Theissen, Hickson, Brundrett, Horns and Lachniet2019), as noted for closed-lake systems (Talbot, Reference Talbot1990). This is the result of evaporative enrichment of 18O in water and 13C in dissolved inorganic carbon (DIC) (Horton et al., Reference Horton, Defliese, Tripati and Oze2016). Therefore, we attribute those dramatic compositional shifts mostly to the effects of increased evaporation under drier climate conditions rather than to the consequence of increased groundwater supply from local volcanic aquifers, temperature change, or contamination with detrital carbonate.
The anomalously low [234U/238U] values that nearly match Lone Tree Spring at 5.78 ka clearly indicate dominance of the local groundwater sources to LPAH at that time (Fig. 7B, C). δ18O values decrease from −7 to −10.2‰ between 5.78–5.73 ka, indicating a combination of wetter conditions and increasing regional groundwater with lower δ18O values. The remaining record of combined O- and U-isotope shifts can be broken into three millennial-scale periods that reflect substantial changes in paleohydroclimatic conditions (Fig. 7). The first, between ca. 5.6–3.3 ka, is characterized by relatively high [234U/238U] values and relatively low δ18O values, indicating that the regional aquifer was the predominant source of water to LPAH during this wetter interval. This is followed by a ca. 2 ka period (3.1–1.1 ka) during which the groundwater from local volcanic aquifer sources took on greater significance, as indicated by lower [234U/238U] values (Figs. 7B, C). At the same time, the especially high δ18O values for samples dated between 3.15–1.70 ka (Fig. 7A) indicate that it was the most evaporative period during the nearly 5.8 ka record (Theissen et al., Reference Theissen, Hickson, Brundrett, Horns and Lachniet2019). This interval corresponds to a previously recognized period of drought known as the Late Holocene Dry Period that affected the central Great Basin (Mensing et al., Reference Mensing, Sharpe, Tunno, Sada, Thomas, Starratt and Smith2013). In the final and most recent period, increasing U isotopic values and decreasing δ18O values indicate that by ca. 0.75 ka, there was a return to the dominance of water supply from the regional aquifer during the same time that δ18O data indicate a return to somewhat wetter conditions. In the most recent part of the record (last 120 years), δ18O values rose sharply while [234U/238U] remained uniform. The apparent decoupling of the two indicators may in part be explained by the onset of increased human management of Pahranagat Valley water resources, including the construction of a dam upstream of LPAH to impound UPL nearly a century ago. Modern water management may also explain the decoupling of 87Sr/86Sr values between modern LPAH water and those in the youngest core intervals (Fig. 5B). With the dam in place, impounded water sitting in UPL became subject to evaporative enrichment, which would increase the δ18O values while leaving the [234U/238U] and 87Sr/86Sr values unaffected.
The Sr and U isotopic data indicate that, like today, the regional aquifer source has consistently accounted for the majority of the water supply to LPAH over the last ca. 6 ka. However, radiogenic-isotope data also indicate that the local volcanic aquifer source has been variably more or less important in maintaining the presence of water in LPAH in the past than it is today. Those shifts are likely caused by differences in the amounts of spatially distributed recharge in proximal versus distal parts of the groundwater basins providing discharge to Pahranagat Valley.
CONCLUSIONS
We reconstructed records of 87Sr/86Sr and [234U/238U] from LPAH core carbonates spanning nearly the last 6000 years. The Sr and U isotopic values of the LPAH carbonates fall within the compositional boundaries defined by key regional and local spring water sources to the PNWR and appear to be a reliable tracer of those sources of water within this system through time.
The combined Sr and U isotopic results reveal changing mixtures of regional and local spring sources supplying LPAH. Throughout the record, these mixtures show that discharge from the regional carbonate aquifer was important. However, a period of known drought across the central and southern Great Basin (ca. 3.15–1.70 ka) correlates with a reduction in supply from regional aquifer sources. In addition, data from our oldest core sample (5.78 ka) imply that the lake was entirely fed from a local spring source. The causes for these paleohydrological shifts are likely related to climate-driven changes in recharge in different source areas, or to hydraulic changes caused by Holocene faulting.
Acknowledgments
We thank Jack Duggan and Jacob Frahm for help in the field and with sample preparation; Rob Vinson of the U.S. Fish and Wildlife Service; and the staff at LacCore for their support of core processing. Finally, we thank Leonid Neymark and two anonymous reviewers for their thorough examination and comments on an earlier version of this manuscript, which improved it. Any use of trade, product, or firm names is for descriptive purposes only and does not imply endorsement by the U.S. Government.
Financial Support
We thank the American Chemical Society-Petroleum Research Fund for a generous grant to Theissen that supported this research (Grant #53934-UR8).