Introduction
Widespread reduction in grey matter volume is notable even in the earliest stages of the illness (Tandon et al. Reference Tandon, Keshavan and Nasrallah2008). Several meta-analyses of voxelwise morphometric studies in schizophrenia have concluded that the maximum likelihood of grey matter reduction is noted in the insula, anterior cingulate cortex, thalamus, superior temporal region and the hippocampal complex (Ellison-Wright et al. Reference Ellison-Wright2008; Glahn et al. Reference Glahn2008; Leung et al. Reference Leung2009; Chan et al. Reference Chan2011). Despite this, several studies report no notable structural alterations, especially when undertaking a whole-brain voxelwise search (mass-univariate analysis), indicating that the regionally localised morphological abnormalities are subtle in magnitude (Fusar-Poli & Meyer-Lindenberg, Reference Fusar-Poli and Meyer-Lindenberg2016).
The application of graph theory to neuroimaging has enabled the study of the entire brain as a network (the ‘connectome’) at a systems-level (Bullmore & Sporns, Reference Bullmore and Sporns2009). Specifically, when applied to morphometric data, graph-theory provides various metrics that quantify the degree of structural covariance among cortical regions within a group of subjects (Alexander-Bloch et al. Reference Alexander-Bloch, Giedd and Bullmore2013; Griffa et al. Reference Griffa2013). Measures of clustering and global efficiency reveal the localised (segregated) and distributed covariance patterns among brain regions. In addition to segregation and integration, measures of centrality in covariance networks reflect the relative importance of selected brain regions (‘hubs’) in ‘influencing’ or ‘shaping’ the observed relationships (Rubinov & Sporns, Reference Rubinov and Sporns2010). Furthermore, the dependence of a network on highly central regions (‘hubs’) can be inferred by studying the degree distribution (Achard et al. Reference Achard2006). The robustness of a covariance network to withstand the further loss of its component nodes (regions) can also be studied by simulating attacks on the nodes and estimating the effect of these attacks on the network parameters (Achard et al. Reference Achard2006; van den Heuvel & Sporns, Reference van den Heuvel and Sporns2011). Earlier investigations of the structural covariance in schizophrenia have revealed a disturbance in regional relationships (increased segregation and reduced integration) (Bassett et al. Reference Bassett2008; Zhang et al. Reference Zhang2012).
Covariance among cortical regions reflects the ‘common fate’ of brain regions both in terms of coordinated maturation and combined plastic changes with training, experience or degeneration. In schizophrenia, while some structural changes occur even before the first episode, most occur in the first few years after the first episode, with a pattern of concomitant grey matter loss and a relative increase compared with the baseline at the time of onset. We recently proposed that the extant findings of brain structural abnormalities in schizophrenia are suggestive of a post-onset cortical reorganisation process wherein highly connected ‘hub’ regions are de-escalated, while peripheral hubs are super-delegated to compensate (Palaniyappan, Reference Palaniyappan2017). Such a pattern of topological decentralisation has been shown in structural (Crossley et al. Reference Crossley2014; Griffa et al. Reference Griffa2015) and functional connectivity networks (Lynall et al. Reference Lynall2010; Lo et al. Reference Lo2015) in schizophrenia, but not studied to date in volumetric covariance networks. In the presence of grey matter reorganisation, regional volumetric changes are unlikely to exhibit a random pattern; instead, we can expect a highly organised systematic change involving a redistribution of hubs.
In the present study, we used structural magnetic resonance imaging (MRI) data obtained from a sample of 81 subjects (41 patients, 40 controls) to study the properties of the schizophrenia connectome. We investigated if (1) volumetric changes in schizophrenia show a systematic pattern of organised changes as opposed to random regional distribution (2) if there is a redistribution of the centrality (or primacy) of hub regions supporting the de-escalation hypothesis. We also studied the connectomic effect of further (simulated) tissue loss targeting prominent hub regions in patients compared with healthy controls.
Methods
Subjects
The data reported in the present study were obtained from a previously reported (Palaniyappan & Liddle, Reference Palaniyappan and Liddle2013) sample of 41 patients satisfying DSM-IV criteria for schizophrenia/schizoaffective disorder and 40 healthy controls. Patients were recruited from community-based mental health teams in Nottinghamshire and Leicestershire, UK. The diagnosis was made in a clinical consensus meeting in accordance with the procedure of Leckman et al. (Reference Leckman1982), using all available information including a review of case files and a standardised clinical interview [Symptoms and Signs in Psychotic Illness (Liddle et al. Reference Liddle2002)]. All patients were in a stable phase of illness with no change in antipsychotic-, antidepressant- or mood-stabilising medications in the 6 weeks prior to the study. Subjects with age <18 or >50, with neurological disorders, current substance dependence or intelligence quotient <70 using Quick Test (Ammons & Ammons, Reference Ammons and Ammons1962) were excluded. The median DDD (defined daily dose) (WHO Collaborating Centre for Drug Statistics & Methodology, 2003) was calculated for all prescribed psychotropic medications.
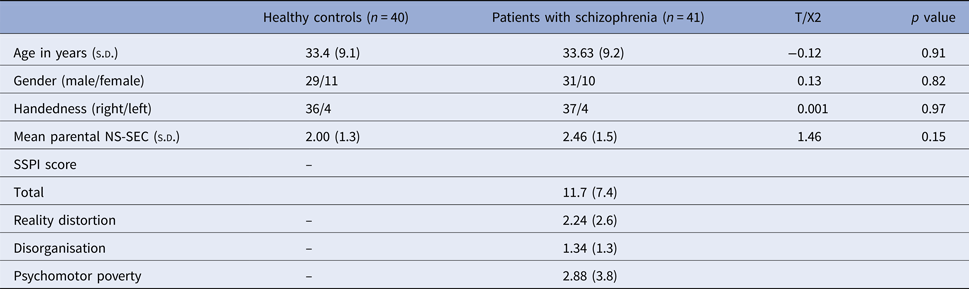
Healthy controls were recruited from the local community via advertisements, and 40 subjects free of any psychiatric or neurological disorder group-matched for age and parental socioeconomic status [measured using National Statistics – Socio Economic Classification (Rose & Pevalin, Reference Rose and Pevalin2003)] were included. Controls had similar exclusion criteria to patients; in addition, subjects with personal or family history of psychotic illness were excluded. A clinical interview by a research psychiatrist was employed to ensure that the controls were free from current axis 1 disorder and history of either psychotic illness or neurological disorder. The study was given ethical approval by the National Research Ethics Committee, Derbyshire, UK. All volunteers gave written informed consent. Please see Table 1 for further sample characteristics.
Demographic features of the sample

NS-SEC, National Statistics-Socio Economic Classification; SSPI, signs and symptoms of psychotic illness s.d., standard deviation.
Image acquisition and processing
A magnetisation-prepared rapid acquisition gradient echo image with 1 mm isotropic resolution, 256 × 256 × 160 matrices, repetition time (TR)/echo time (TE) 8.1/3.7 ms, shot interval 3 s, flip angle 8°, SENSE factor 2 was also acquired for each participant for reconstructing the anatomical surface. T1 images were resliced (1 mm isotropic) and segmented into grey, white and CSF tissue using the SPM8 Diffeomorphic Anatomical Registration Through Exponentiated Lie algebra (DARTEL) algorithm (Ashburner, Reference Ashburner2007). GM images were normalised to MNI space. The normalised, modulated, unsmoothed GM images were then used as inputs for the construction of graph networks.
Constructing covariance networks
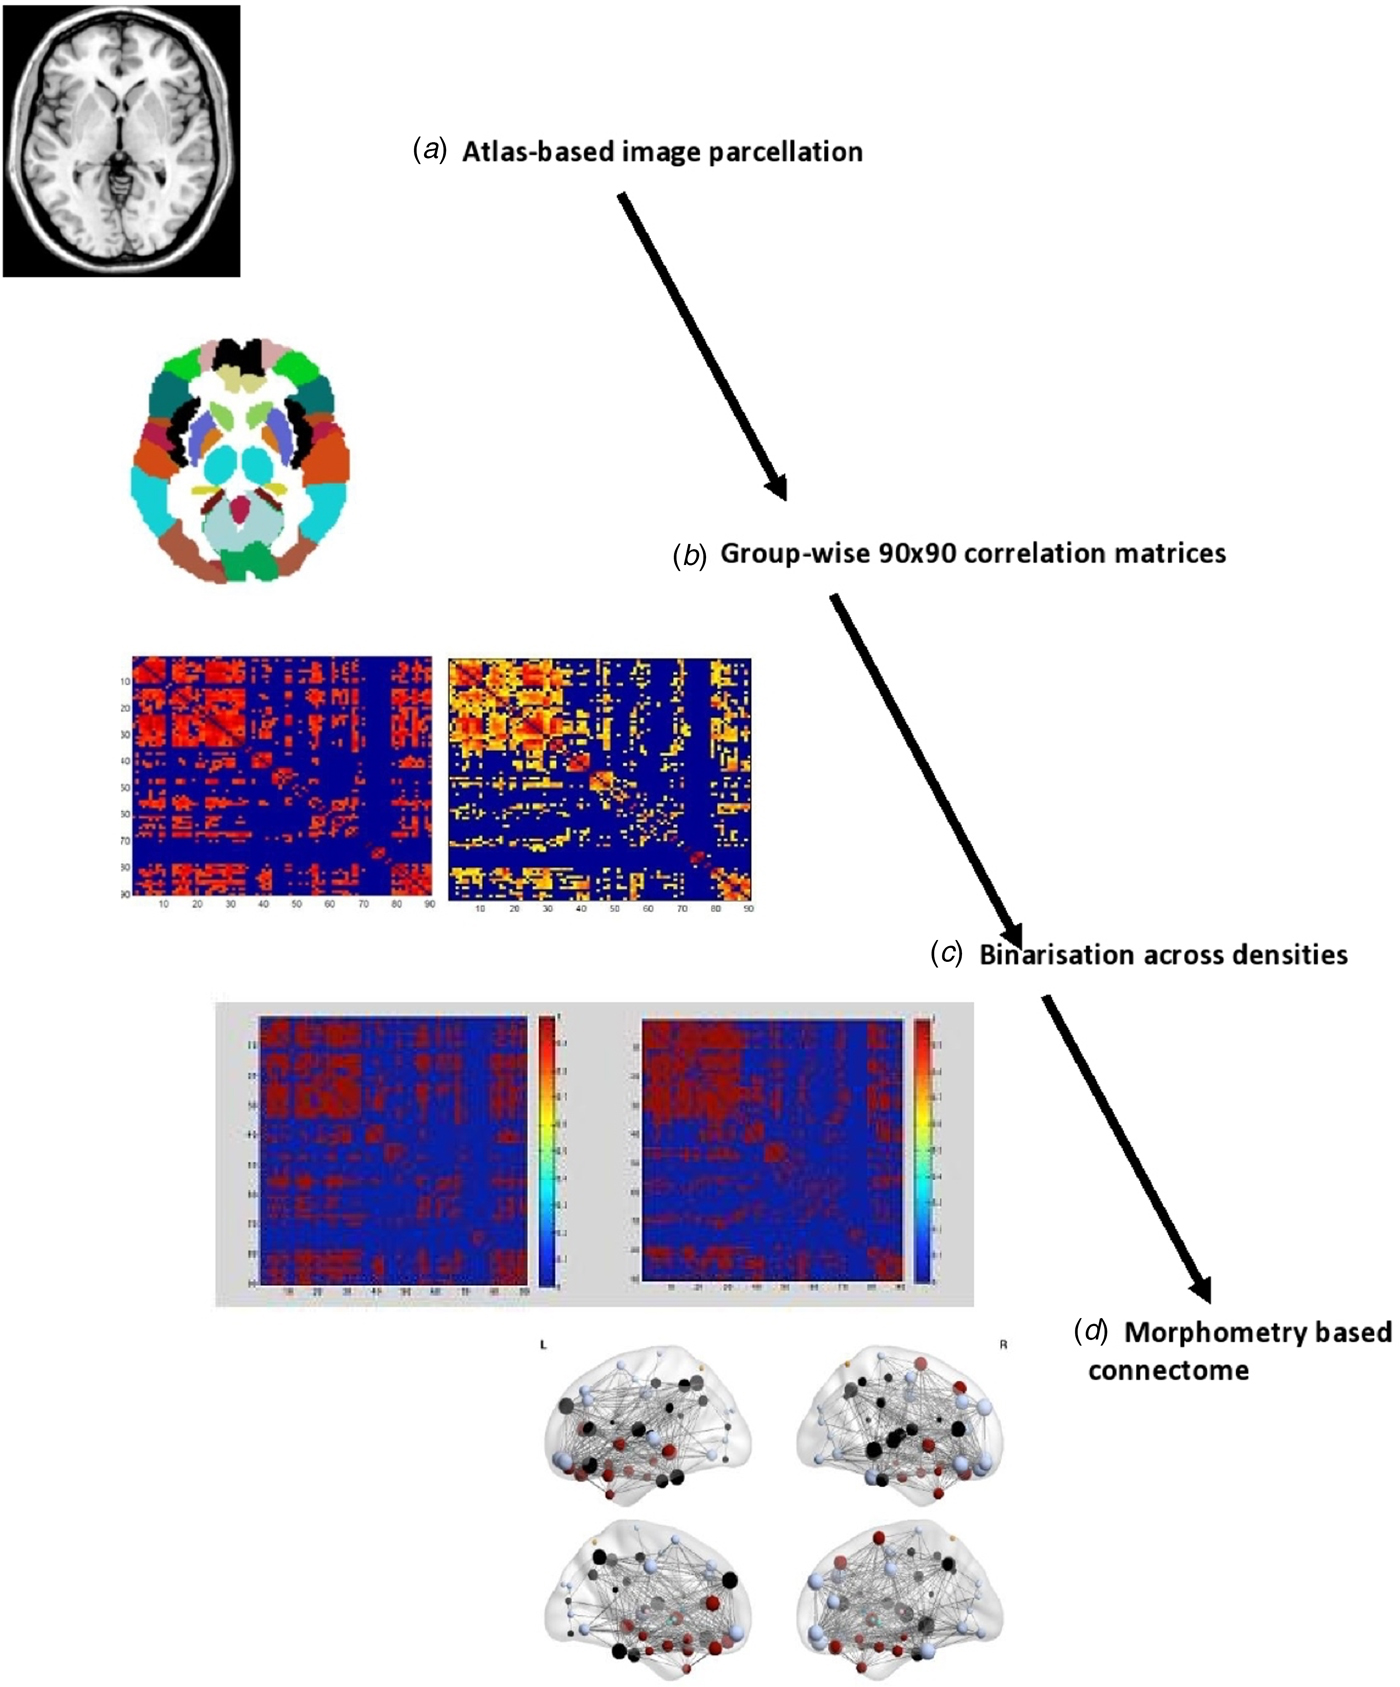
All topological properties were computed using Graph Analysis Toolbox (GAT) (Hosseini et al. Reference Hosseini, Hoeft and Kesler2012) (http://brainlens.org/tools.html) that uses computation algorithms from Brain Connectivity Toolbox (https://sites.google.com/site/bctnet/). In line with previous works (Achard et al. Reference Achard2006; Singh et al. Reference Singh2013) we generated 90 cortical and subcortical regions using the AAL-90 atlas. Using linear regression model with age, gender and intracranial volume as covariates, residuals of regional volumes were extracted. We chose these covariates for adjustment, as prior studies have demonstrated their confounding potential (Mechelli et al. Reference Mechelli2005; Modinos et al. Reference Modinos2009; Montembeault et al. Reference Montembeault2012; Li et al. Reference Li2013). A 90 × 90 Pearson's correlation matrix of residuals of grey matter volumes of the 90 parcellated brain regions was used to create a binary adjacency matrix for each group (CON and SCZ). We used a range of thresholds determined by connection densities (proportions of connections present in a graph to all possible connections) varying from 0.3 to 0.5 (increments of 0.025) to compare the properties of emerging networks. Across this range in both groups, the resulting graphs were fully connected and not fragmented (minimum density at which fully connected graph was observed = 0.29). The graphs lose sparsity and develop a random configuration when >50% of all possible edges are retained (a cost density of 0.5). The steps involved in obtaining the connectomes are summarised in Fig. 1. The connectomes were visualised using BrainNet Viewer (Xia et al. Reference Xia, Wang and He2013) (http://www.nitrc.org/projects/bnv/).
The steps involved in generating group-based volumetric connectomes (a) T1 MPRAGE images resliced and segmented into probabilistic grey, white maps and cerebrospinal fluid using SPM8 software. The grey matter maps were parcellated into 90 cortical and subcortical regions using the AAL atlas. (b) Group-wise 90 × 90 correlation matrices created by calculating the correlations between the probabilistic grey matter volume in each parcellated brain region. (c) Binary adjacency matrices were derived from thresholding at a range of densities (min 0.3, max 0.5, interval 0.025) for fully connected graphs in both groups. (d) Topological properties of the connectome were computed using Graph Analysis Toolbox – GAT (Hosseini et al. Reference Hosseini, Hoeft and Kesler2012) and visualised using BrainNet Viewer (Xia et al. Reference Xia, Wang and He2013).

Integration, segregation and centrality
The patterns of relationship among brain regions within a network can be described using three groups of topological properties (integration, segregation and centrality) that can be quantified using various graph theoretical measures (Stam & Reijneveld, Reference Stam and Reijneveld2007; Bullmore & Sporns, Reference Bullmore and Sporns2009; Rubinov & Sporns, Reference Rubinov and Sporns2010), as described below.
(1) Integration: Shortest path length L p between two regions (A, B) refers to the minimum number of node-to-node edges that connect A and B. The average shortest path length between all pairs of regions in the network gives the characteristic path length of the network (MLp). The inverse of MLp is a measure of efficient information transfer, called as global efficiency E glob. (2) Segregation: Clustering coefficient C p indicates the presence of high degree of covariance (number of connections or edges) among neighbouring regions. The average of clustering coefficients of each region (or node) provides the clustering coefficient of the network (MCp). Local efficiency of a region, E loc, is a closely related metric given by the inverse of the minimum number of connections among each pair of neighbouring regions. C p and E loc quantify the cliquishness of a region. (3) Centrality: The degree (number of connections) of a region (or node) is a sensitive measure of centrality for structural networks (Rubinov & Sporns, Reference Rubinov and Sporns2010).
In line with previous connectomic studies (Palaniyappan et al. Reference Palaniyappan2014, Reference Palaniyappan2016), we estimated the small-world index by comparing the estimated topological properties (MCp and MLp) of the two networks (CON and SCZ) with corresponding mean values of 20 null random graphs (MCnull and MLnull) constructed with same number of nodes, edges and degree distribution as the volume-based networks. Small world index (SWI) equals ([MCp/MCnull]/[ MLp/MLnull]. SWI>1 suggests a small world network that has a relatively high segregation and integration compared with random null networks (Humphries & Gurney, Reference Humphries and Gurney2008). Further, we also used Newman's optimisation algorithm (Newman, Reference Newman2006) implemented in GAT with 1000 iterations to identify the modular organisation in the CON and SCZ connectomes. Modules are defined as a subgroup of regions that have higher covariance within the subgroup, than their covariance with regions outside the subgroup.
Resilience
Small-world structural brain networks follow an exponentially truncated power-law function for cumulative degree distribution that can be expressed as P(d)~[d (k–1) * e (−d/dc)], where P(d) is the probability of regional degree (d), dc is the cut-off degree above which there is an exponential decay in probability of hubs (i.e. regions with degree >2 s.d. units), ‘k’ being the estimated component. If such a truncated power-law relationship can be demonstrated for a connectome, this will indicate a scaling regimen that permits the presence of high degree hubs but constraints against the emergence of ‘mega-hubs’ that are connected to a very large number of regions. Such a constrained network is more resilient to the removal of both high degree hubs and random hubs when compared with scale-free networks [such as the worldwide web (Barabasi, Reference Barabasi2009)]. We initially tested if this assumption is true for both groups.
Following this, we assessed the resilience of the connectome using the approach adopted by Achard et al. (Reference Achard2006). Random attack involved the removal of one random regional node (and its connections) from a network and calculating the size of the largest connected component (i.e. a fully connected graph from the remaining nodes) and global efficiency of the network. Each random removal was done 100 times and the average measures of the remaining graph were computed. This process was repeated until a path length of 1 was reached. In a targeted attack, nodes were removed in order of their relative degree, i.e. the first attack was on the most central hub in the network, subsequent removals progressed in a descending order of normalised nodal degree. The attacks were carried out separately for the networks obtained from each group at the minimum density for full connectivity and the resulting plots were compared as described below.
Group comparison
To test the statistical significance of the difference between the topological parameters of the two groups, non-parametric permutation testing with 1000 repetitions was employed. For each iteration, the corrected grey matter volumes of each participant were randomly reassigned to one of two new groups with the sample size identical to controls and patients. Binary adjacency matrices across a range of network densities (0.3–0.5, increments of 0.025) were obtained for each randomised group. Topological measures were then calculated for the networks and differences between the random groups were computed across the entire range of densities. For the various topological properties, differences in the area under the curves obtained from plotting, the values of each random group across the range of densities were obtained for each iteration. This resulted in a null distribution of differences, against which the p values of the actual differences in the curve functions obtained by comparing CON and SCZ were computed. This non-parametric permutation test is based on functional data analysis (FDA) (Ramsay & Dalzell, Reference Ramsay and Dalzell1991) that compares the functions of the curve obtained across thresholds in one group with the curve from the other group. As opposed to multiple tests comparing means at each threshold, the use of a single test comparing curve functions (FDA), requires no further multiple test correction for the number of threshold points that are studied. For regional (n = 90 nodes) properties such as local efficiency, clustering and degree, an additional correction for multiple comparison (false discovery rate) was used with corrected two-tailed p < 0.05 considered as the significance threshold. This multiple testing correction (FDR) is done across the number of nodes (90). The same permutation approach was also used when comparing the curves obtained from random and targeted attack on CON and SCZ networks. Hubs were defined as the nodes whose FDA-based curve function for the regional degree is 1 standard deviation (Bassett et al. Reference Bassett2008; Hosseini et al. Reference Hosseini2013) greater than the mean of corresponding curve functions obtained from the 1000 random permutations.
Results
Global properties
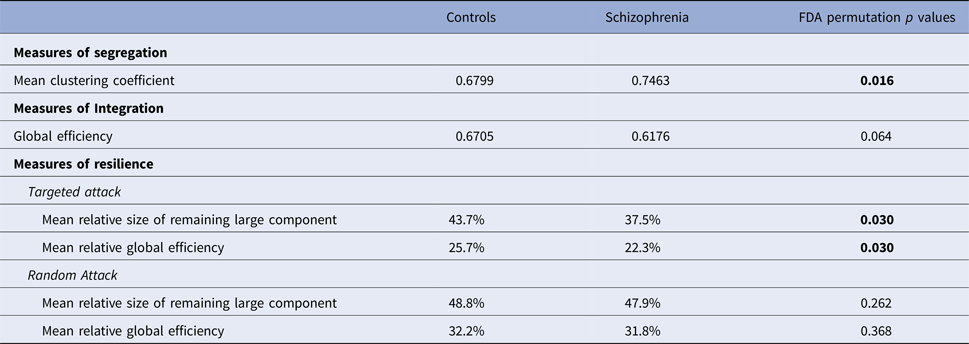
Both control and schizophrenia connectomes showed small-worldness (mean SWI across densities for CON = 1.012; SCZ = 1.068). Patients had significantly higher clustering and a trend towards lower global efficiency (Table 2). For both controls and patients, we observed an exponentially truncated power-law distribution. The exponent estimate (k) was 1.05 in patients and 1.28 in controls. The dc was 9.02 for patients and 5.93 for controls. The R 2 value for the distribution fit was 0.88 for patients and 0.86 for controls, suggesting that the truncated power-law model had a very good fit for the data as expected.
Topological properties of grey matter-based connectome

FDA, Functional data analysis. Reported values are means across all cost densities. FDA comparisons are based on fitting a curve across all cost densities for each group and comparing the shape of the curves.
Resilience
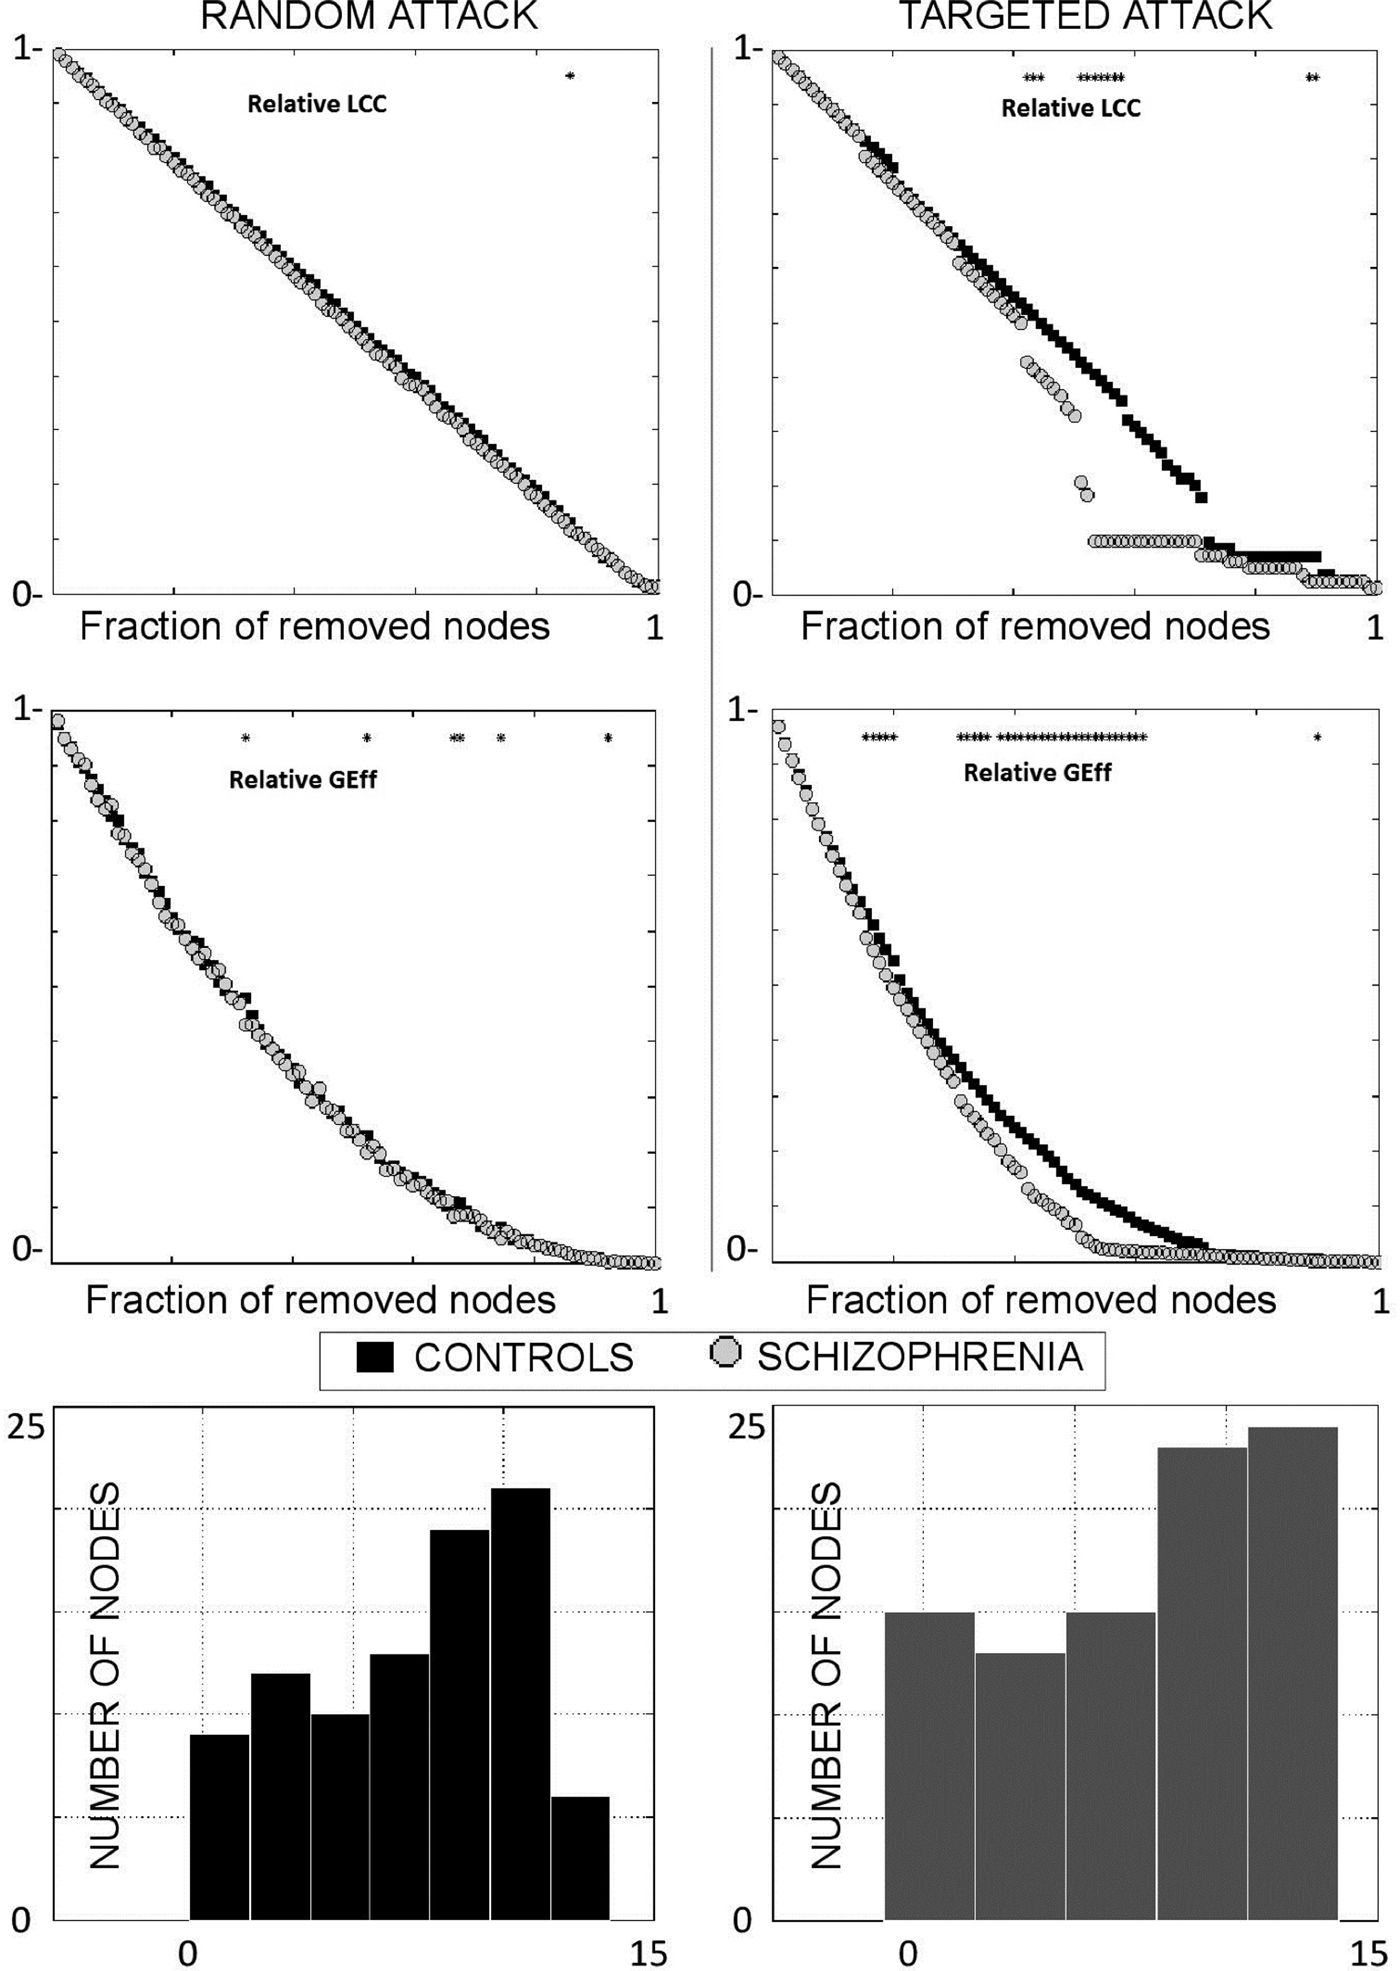
There was a significant reduction in the resilience of the SCZ connectome to a targeted attack, but not a random attack, when compared with controls. When compared with controls, random attack produced a 1.8% reduction in the size of the largest connected component and 1.24% reduction in global efficiency; but targeted removal of hubs produced a 14.2% (>7 times more) reduction in the largest connected component and 13.23% (>10 times more) reduction in global efficiency in patients. The degree distribution plots and the results of simulation analysis are shown in Fig. 2.
Results of simulated removal of nodes from covariance networks in patients and controls. Results of random [left column] and targeted [right] attack are shown. In the top panel, the size of the largest connect component (LCC), is plotted against the fraction of removed nodes. In the middle panel, global efficiency (Geff), is plotted against the fraction of removed nodes. The bottom panel displays the degree distribution of nodes in both groups.

Regional integration, segregation and centrality
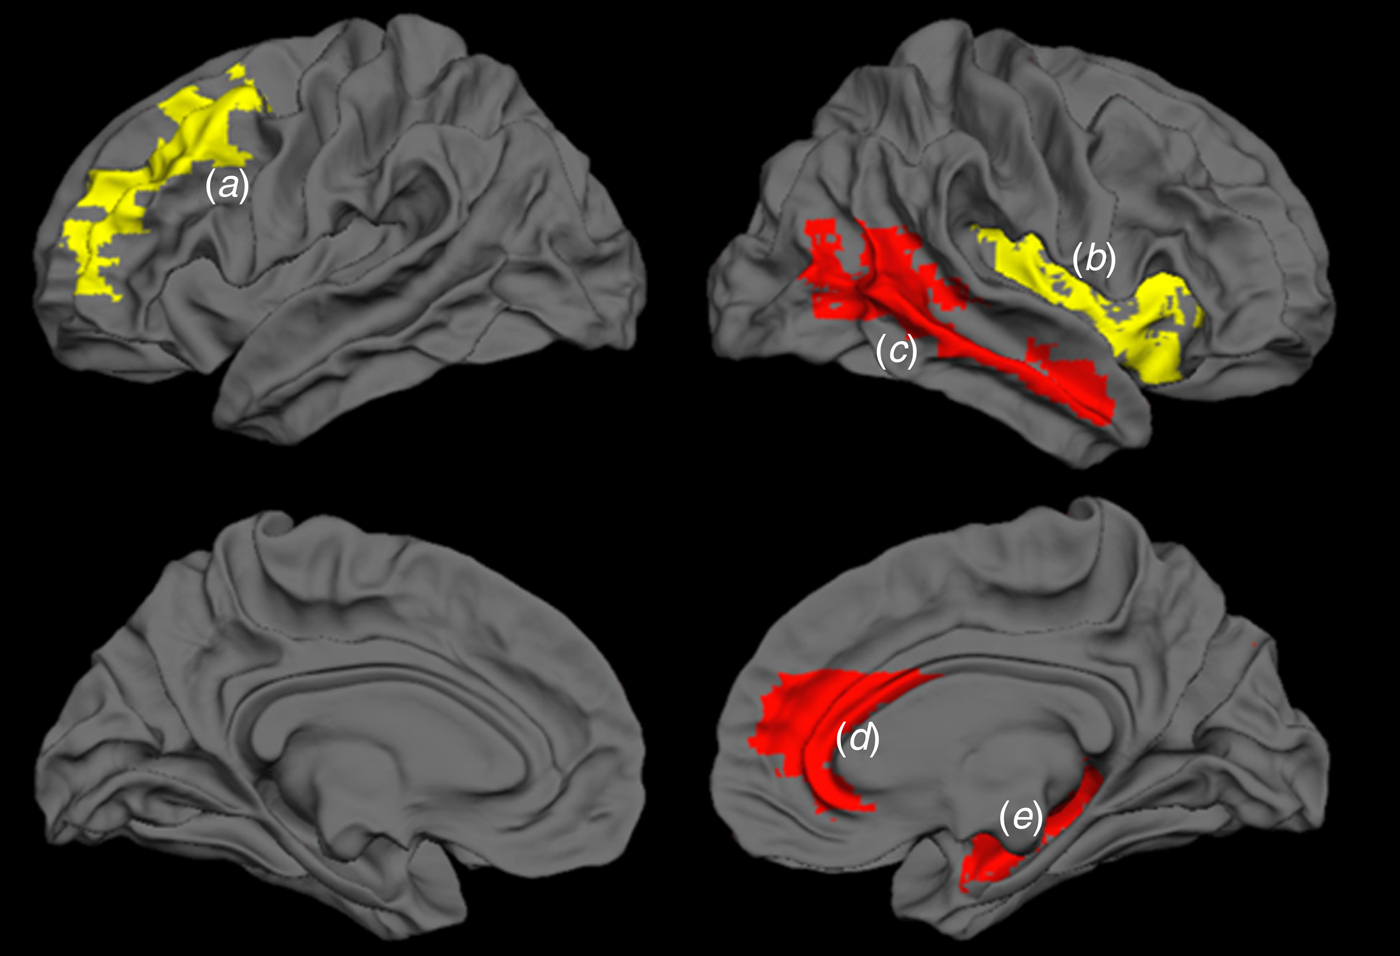
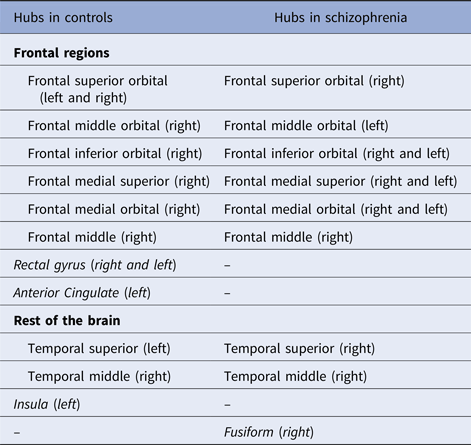
Examination of the individual nodal properties revealed significantly reduced clustering coefficient in right middle temporal region (p = 0.028) and reduced local efficiency in right hippocampus (p = 0.034) and right anterior cingulate cortex (p = 0.046) in patients compared with controls. Nodal degree was significantly reduced for right insula (p = 0.038) and left middle (dorsolateral) frontal cortex (p = 0.002) in patients. These results are summarised in Fig. 3. In both patients and controls, hub regions were predominantly located in the frontal cortex and were mostly comparable in the two groups (Table 3). Notably, among frontal hubs, anterior cingulate and gyrus rectus showed a high degree in controls, though did not emerge as hubs in patients. Among the non-frontal hubs, insula was a prominent hub in controls but not in patients, while the fusiform region was a hub in patients but not in controls.
Regional changes in the network properties of the grey matter connectome in schizophrenia compared to controls. Nodal degree was significantly reduced for left middle (dorsolateral) frontal cortex (a) (p = 0.002) and right insula (b) (p = 0.038); Clustering coefficient reduced in right middle temporal region (c) (p = 0.028) and local efficiency reduced in right anterior cingulate cortex (d) (p = 0.034) and right hippocampus (e) (p = 0.046) in patients compared with controls.

Hubs in healthy controls and schizophrenia

Regions in block letters are observed to be hubs in one group only.
Module membership
The distribution of the module membership in controls revealed five prominent modules (a large fronto-insular, a temporal, an occipital, a parietal and a subcortical module). In patients, the optimal solution yielded seven modules. Lobar partitioning was less clear-cut in patients when compared with controls. Most notably, the subcortical module was split with bilateral thalami being separated from the rest of the modules. Similarly, bilateral superior parietal regions appeared as a separate module. The modular structure of the connectome is shown in online Supplemental Fig. and Table S1. We also present the voxel based morphometry (VBM) findings (controls v. patients) in the supplement.
Discussion
Using a connectomic approach on morphometric data, we observe that the structural covariance of grey matter volume in patients with schizophrenia is not random but significantly deviates from healthy controls. An increase in overall clustering (i.e. constrained covariance) despite reduced clustering of certain brain regions (anterior cingulate, middle temporal cortex and hippocampus), reduced centrality of the insula and dorsolateral frontal cortex along with a modular segregation of thalamus and superior parietal regions was seen in schizophrenia. The overall increase in segregation and the trend towards reduced global efficiency is consistent with several other connectomic studies in schizophrenia (Bassett et al. Reference Bassett2008; Alexander-Bloch et al. Reference Alexander-Bloch2010; Lynall et al. Reference Lynall2010; van den Heuvel et al. Reference van den Heuvel2010; Fornito et al. Reference Fornito2012; Wang et al. Reference Wang2012; Zhang et al. Reference Zhang2012; Griffa et al. Reference Griffa2013).
All of the regional nodes showing altered topological properties in this study are implicated in the structural alterations seen in schizophrenia (Ellison-Wright et al. Reference Ellison-Wright2008; Glahn et al. Reference Glahn2008; Palaniyappan & Liddle, Reference Palaniyappan and Liddle2012). While we observed grey matter reduction in many of these regions (thalamus, insula, superior temporal gyrus, hippocampus; see Table S3) in a VBM analysis at a lenient threshold suitable for defining discrete clusters and investigate specific regions of interest, these VBM differences did not survive conventional correction for multiple testing (FDR < 0.05). The observed reduction in regional topological properties (degree of dorsolateral prefrontal cortex and insula and local efficiency of anterior cingulate cortex and hippocampus) despite having only subtle regional structural changes indicates that the graph-based measures are of larger magnitude of the effect. These findings are consistent with Chen et al.’s (Reference Chen2014) who reported limited VBM-based regional GM deficits, but a pronounced deviation of structural covariance in schizophrenia.
Our observations replicate previous findings that the structural covariance in schizophrenia exhibits small-world properties (Bassett et al. Reference Bassett2008; Zhang et al. Reference Zhang2012). In addition, for the first time, we show that the degree distribution of the structural connectome in patients follows an exponentially truncated power-law function. This pattern of degree distribution suggests that despite the volumetric deficits that occur, certain brain regions emerge with very high degree (i.e. super-covarying mega-hubs). In the context of reduced centrality of traditional ‘hub’ regions (i.e. dorsolateral prefrontal, insula, anterior cingulate), the emergence of peripheral mega-hubs (e.g. fusiform) supports the possibility of inefficient cortical reorganisation that is unlikely to be advantageous if further plastic changes affect the function of these central nodes (Bullmore et al. Reference Bullmore2009).
Exponentially truncated degree distribution has been previously noted in the functional connectome in a sample of 12 patients with schizophrenia (Lynall et al. Reference Lynall2010), but in contrast to Lynall et al. who observed a lower cut-off of the degree at which exponential decay in the probability of hubs in patients, we noted somewhat higher dc in patients. This difference could be attributed to the differing properties of the resting-state functional connectome when compared with a morphological covariance network. Our observation suggests that the structural network in schizophrenia shows a subtle shift towards a scale-free organisation. There are important implications of this observation for a disease state such as schizophrenia that involves grey matter reduction. Most brain regions in a scale-free network have very few covarying links, so if the disease process affects nodes in a non-selective fashion (random or generalised reduction in volume), the network can still function efficiently (Bullmore et al. Reference Bullmore2009). However, upon focused removal of high degree nodes, a scale-free network will become inefficient rapidly.
For the first time, using simulated targeted and random attacks, we demonstrate this overreliance on hubs affecting the volumetric covariance in schizophrenia. One major implication of this finding is that continued tissue loss affecting hub regions could compromise the structural covariance, affecting the putative structural reorganisation process. Notably, we reported functional topological decentralisation and the emergence of peripheral hubs using task-based and resting state fMRI in this sample of patients previously (Palaniyappan & Liddle, Reference Palaniyappan and Liddle2013), supporting the notion that functional connectivity changes may underlie structural covariance. Extrapolating this observation, we speculate the overreliance on non-conventional ‘mega’ hubs of structural covariance represent the effect of functional reorganisation, whereby rapid functional synchronisation or percolation of information across the entire network is facilitated in the wake of synaptic inefficiency producing a bottle-neck effect at traditional hub regions (Palaniyappan, Reference Palaniyappan2017). While this may be advantageous (and possibly aid in recovery) in some cases, reflecting a compensation process, by altering regional functional specialisation, the putative reorganisation may prompt inappropriate information transfer and inefficient recruitment of extant brain regions when cognitive demands arise. Studying the longitudinal relationship between functional dysconnectivity and grey matter reorganisation is required to refute or prove the efficiency and compensatory effect of the presumed reorganisation.
Several limitations must be borne in mind while interpreting these results. Firstly, as our approach of estimating structural covariance is based on between-subjects variance, we are not able to directly relate the reported topological metrics to individual differences in individual measurements of brain function. This limited our inferences on the direct functional implications of our findings. We recruited a medicated sample of patients with schizophrenia; grey matter changes are noted to be more prominent in patients with an established illness who are taking antipsychotic medications (Leung et al. Reference Leung2009; Ho et al. Reference Ho2011). While it is not possible to separate the effect of antipsychotic-induced changes from those that result from an inherent disease process, at least the linear effect of current antipsychotic dose on the topological properties of structural connectome appears to be negligible (online Supplemental material). Ideally, longitudinal data on the initially unmedicated sample is required to investigate this issue. There are several uncertain variables when constructing graph-based networks. This includes the dependency of several topological properties on the size of the selected nodes and the threshold used for binarisation (Fornito et al. Reference Fornito, Zalesky and Breakspear2013; Zalesky et al. Reference Zaleskyn.d.). While the results of group comparisons on the basis of uniform node selection and thresholding process has been shown to yield broadly consistent results (Evans, Reference Evans2013), absolute values of the network parameters must be cautiously interpreted. Finally, we interpret the results based on the theoretical framework of neuroplasticity; other explanations (e.g. neuroprogression or neurodevelopmental defect) cannot be ruled out from the presented data. It is worth noting that in the same sample, gyrification-based covariance showed no overall differences in segregating or integration, though regional topological changes were present (Palaniyappan et al. Reference Palaniyappan2014).
Structural covariance reported here suggests that a system-level disturbance in morphology that is possibly related to coordinated maturation or plasticity of brain regions can be observed despite subtle regionally localised structural changes in schizophrenia. This raises the possibility that tissue preservation aimed at specific regions might have a wider impact on reversing or preventing the observed abnormalities. Importantly, this study highlights the importance of the crucial hub regions in influencing the overall topological architecture observed in patients. It is tempting to speculate that tissue preservation (or plasticity modulation) strategies that focus on these central nodes could favourably alter the cortical reorganisation process in schizophrenia. Several encouraging tissue preservation strategies have been previously suggested, with specific regional effects. Further environmental risk factors such as cannabis affect key hub regions such as the hippocampus (Rapp et al. Reference Rapp2012). In addition to reducing cannabis, physical exercise (Pajonk et al. Reference Pajonk2010) and cognitive-enhancement therapy (Eack et al. Reference Eack2010) can help to preserve the grey matter volume of hippocampus; specific cognitive training such as mindfulness mediation could affect insular structure (Luders et al. Reference Luders2012); attentional training (Hoekzema et al. Reference Hoekzema2011) could have a positive impact on frontal volume; neuromodulation techniques such as transcranial magnetic stimulation could have a positive impact on temporal volume (May et al. Reference May2007). Future studies investigating the impact of these strategies on the structural connectome could support or refute our optimistic conclusions.
Supplementary material
The supplementary material for this article can be found at https://doi.org/10.1017/S0033291718001010
Acknowledgements
Bucke Family Fund, Schulich School of Medicine, University of Western Ontario. Opportunities Fund, Academic Medical Organization of South Western Ontario. The data collection was supported by a Medical Research Council UK grant (no. G0601442). We acknowledge Drs. Mingli Li, Sichuan University and Rubai Zhou, Shanghai Jiao-Tong University for their assistance in preparing this manuscript. LP received Travel Support from Magstim Limited (2014) and speaker fees from Otsuka (2017) and investigator-initiated grants from Otsuka Canada and Janssen Canada (2017). In the last 3 years, LP has held shares of Shire Inc. and Glaxo Smith Kline in his/his spousal pension funds.
Declaration of interest
None.