1 Introduction
The dual aims of understanding fish swimming and developing agile, efficient underwater vehicles have propelled research on the canonical problem of flow past a flapping flexible plate. Experimental (Ramananarivo, Godoy-Diana & Thiria Reference Ramananarivo, Godoy-Diana and Thiria2011; Alben et al. Reference Alben, Witt, Baker, Anderson and Lauder2012; Dewey et al. Reference Dewey, Boschitsch, Moored, Stone and Smits2013; Quinn, Lauder & Smits Reference Quinn, Lauder and Smits2014, Reference Quinn, Lauder and Smits2015), computational (Vanella et al. Reference Vanella, Fitzgerald, Preidikman, Balaras and Balachandran2009; Hua, Zhu & Lu Reference Hua, Zhu and Lu2013; Zhu, He & Zhang Reference Zhu, He and Zhang2014; Zhang, Zhou & Luo Reference Zhang, Zhou and Luo2017), and theoretical work (Alben Reference Alben2008; Ramananarivo et al. Reference Ramananarivo, Godoy-Diana and Thiria2011; Alben et al. Reference Alben, Witt, Baker, Anderson and Lauder2012; Floryan & Rowley Reference Floryan and Rowley2018) on this problem has revealed propulsive benefits to flexibility over a range of Reynolds numbers (and for inviscid flows), plate parameters and amplitudes and frequencies associated with the plate’s kinematics. Many studies considered actuation frequencies and material parameters for which the plate exhibits ‘first mode’ flapping; i.e. with the plate shape similar to that of the first mode of a clamped Euler–Bernoulli beam. However, propulsive benefits were shown to persist for parameters that led to ‘higher mode’ shapes (Alben Reference Alben2008; Alben et al. Reference Alben, Witt, Baker, Anderson and Lauder2012; Quinn et al. Reference Quinn, Lauder and Smits2014; Floryan & Rowley Reference Floryan and Rowley2018). Because this canonical problem involves the passive motion of deformable structures, a prevailing question is the extent to which performance is connected to structural resonance. This question is the focus of the current work.
There is a lack of consensus in the literature about the role of resonance in propulsive performance: some investigations have found actuation at or near a resonant frequency to provide benefits to thrust and/or efficiency (Alben Reference Alben2008; Alben et al. Reference Alben, Witt, Baker, Anderson and Lauder2012; Dewey et al. Reference Dewey, Boschitsch, Moored, Stone and Smits2013; Quinn et al. Reference Quinn, Lauder and Smits2014; Zhu et al. Reference Zhu, He and Zhang2014; Floryan & Rowley Reference Floryan and Rowley2018), whereas others have observed optimality through off-resonant actuation (Vanella et al. Reference Vanella, Fitzgerald, Preidikman, Balaras and Balachandran2009; Ramananarivo et al. Reference Ramananarivo, Godoy-Diana and Thiria2011; Zhu et al. Reference Zhu, He and Zhang2014). Connecting resonance to swimming performance is challenging for a number of reasons.
First, the most relevant definition of resonance is not agreed upon in the literature for viscous flows. This lack of consensus is partly due to the fact that resonance is often defined using an Euler–Bernoulli beam in a vacuum (Vanella et al. Reference Vanella, Fitzgerald, Preidikman, Balaras and Balachandran2009; Kang et al. Reference Kang, Aono, Cesnik and Shyy2011; Hua et al. Reference Hua, Zhu and Lu2013). This definition neglects added-mass, viscous and circulatory effects. The added-mass effect is important for swimmers (as compared to flyers), which are neutrally buoyant and much thinner than they are long. For an inviscid flow, Michelin & Llewellyn Smith (Reference Michelin and Llewellyn Smith2009) computed eigenvalues of the fully coupled fluid–structure interaction (FSI) system – including added-mass and circulatory effects – to provide a meaningful definition of resonance. They demonstrated through nonlinear simulations that peaks in thrust occurred at resonant frequencies of the FSI system (which could be significantly different from the vacuum-based resonant frequencies). Floryan & Rowley (Reference Floryan and Rowley2018) also probed the role of resonance in this inviscid setting through a comparison between eigenvalues of the FSI system and the linear (infinitesimal-amplitude) dynamics. The authors showed that actuating at the resonant frequency leads to peaks in thrust and input power of the linear system. They also demonstrated that the relative growth in magnitude of these quantities at resonance is comparable, resulting in no gains in efficiency. Moreover, the authors clarified that circulatory forces affect the eigenvalues and performance of the FSI system, particularly for low-stiffness swimmers. Such eigenvalue computations of the FSI system have thus far not been performed for viscous flows, and resonance has instead been defined using either the aforementioned vacuum scaling or peaks in the plate response to finite-amplitude actuation (Quinn et al. Reference Quinn, Lauder and Smits2014; Zhang et al. Reference Zhang, Zhou and Luo2017). These approaches leave open questions about the role of resonance, as the former neglects viscous, added-mass and circulatory effects and the latter provides the possibility that nonlinearities are playing a role in the observed performance peaks.
This latter effect of nonlinearity provides the second challenge to connecting resonance to performance, as the vast majority of studies have been performed at finite amplitudes. A variety of nonlinear mechanisms that impact performance have been identified. Michelin & Llewellyn Smith (Reference Michelin and Llewellyn Smith2009) used inviscid theory and computation to show that while thrust peaks aligned well with the eigenvalues of the fully coupled FSI system, input power and efficiency exhibited off-resonant peaks (although this may be due in part to the fact that the authors did not incorporate instantaneously negative values of input power in their calculations). At Reynolds numbers  $O(10^{3}{-}10^{4})$, Ramananarivo et al. (Reference Ramananarivo, Godoy-Diana and Thiria2011) experimentally identified superharmonic resonance for large actuation amplitudes that the authors attributed to nonlinear fluid damping. Zhu et al. (Reference Zhu, He and Zhang2014) demonstrated through high-fidelity computations at Reynolds numbers of
 $O(10^{2}{-}10^{3})$ that wake asymmetry can occur for certain parameters, and observed that this effect was largely deleterious for efficiency. Using experimental data at
 $O(10^{4})$, Moored et al. (Reference Moored, Dewey, Boschitsch, Smits and Haj-Hariri2014) used a local linearization of the wake behind the plate to argue that optimal efficiency was caused by selecting parameters that were closest to the wake’s natural frequency. (This study is included in the collection of nonlinear results because the analysis was performed about a mean flow that was generated through geometrical nonlinearities in the structure as well as flow nonlinearities such as flow separation, vortex interactions, etc.) The natural frequency was defined using a spatial stability analysis of the mean flow in the wake of the swimmer, and chosen to be the frequency associated with the least stable spatial mode. This analysis reflects the FSI problem in the sense that the wake data are obtained through flow–swimmer interactions, although the eigenvalues and modes do not contain direct information about the swimmer or the FSI coupling. Moreover, the mean flow is distinct from the true base flow of the system, rendering the notion of stability less clear in this setting. Finally, Quinn et al. (Reference Quinn, Lauder and Smits2015) showed through experiments at Reynolds numbers of
 $O(10^{3}{-}10^{4})$ that sufficiently large swimming motions led to flow separation that adversely affected efficiency.
The goal of the present work is to address (i) the lack of an unambiguous definition of resonance and (ii) the role of nonlinearities in altering resonant behaviour for swimmers in a viscous fluid. To achieve these aims, we consider the two-dimensional flow–plate system at a Reynolds number of 240. First, global linear stability modes of the fully coupled FSI system are investigated to unambiguously identify the natural frequencies of the system. Next, to separate the role of resonance from nonlinearities, high-fidelity nonlinear simulations of increasing amplitude are studied and compared to the linear stability modes. Resonant and non-resonant mechanisms driving performance are characterized and, where appropriate, connections are drawn to previous studies performed at other Reynolds numbers and swimming parameters.
We note that, although this study is performed in the context of swimming, nothing precludes the approach and methods employed here from being applied to scenarios relevant to flexible-wing flight, where the physical mechanisms are distinct due to a greater plate inertia with respect to the flow.
2 Problem set-up and parameters considered
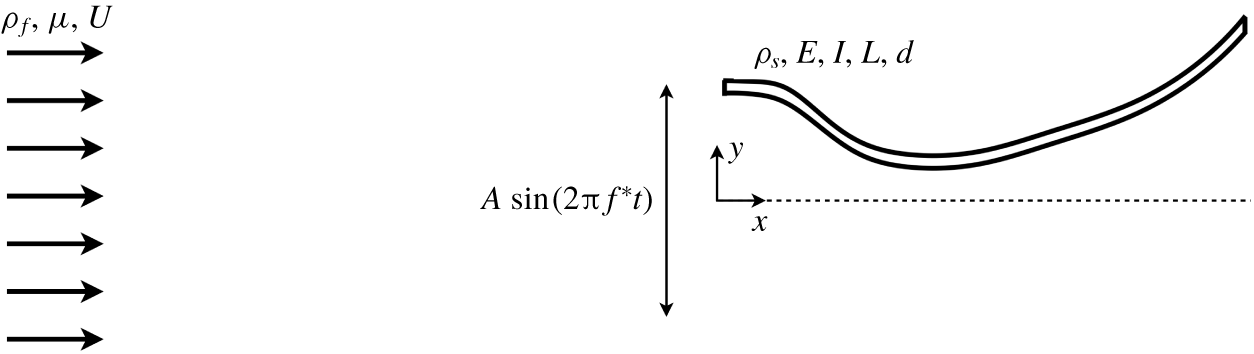
We consider here uniform flow past a passively deformable plate that is heaved sinusoidally at its leading edge. The fluid is modelled via the two-dimensional (2-D) Navier–Stokes equations, and the plate is treated as a clamped geometrically nonlinear Euler–Bernoulli beam. The important dimensionless parameters are the Reynolds number ( $Re$), dimensionless mass ratio (
 $M$) and stiffness ratio (
 $S$), and dimensionless heave amplitude (
 $h_{0}$) and frequency (
 $f$), defined as
 $$\begin{eqnarray}Re={\displaystyle \frac{\unicode[STIX]{x1D70C}_{f}UL}{\unicode[STIX]{x1D707}}},\quad M={\displaystyle \frac{\unicode[STIX]{x1D70C}_{s}d}{\unicode[STIX]{x1D70C}_{f}L}},\quad S={\displaystyle \frac{EI}{\unicode[STIX]{x1D70C}_{f}U^{2}L^{3}}},\quad h_{0}={\displaystyle \frac{A}{L}},\quad f={\displaystyle \frac{f^{\ast }L}{U}},\end{eqnarray}$$
where  $\unicode[STIX]{x1D70C}_{f}$ (
 $\unicode[STIX]{x1D70C}_{s}$) is the 2-D fluid (structure) density,
 $U$ is the free-stream fluid velocity,
 $L$ is the length of the plate,
 $\unicode[STIX]{x1D707}$ is the dynamic fluid viscosity,
 $d$ is the plate thickness,
 $EI$ is the flexural rigidity composed from Young’s elasticity modulus (
 $E$) and the second moment of area (
 $I$),
 $A$ is the dimensional heave amplitude and
 $f^{\ast }$ is the dimensional frequency related to the dimensional angular frequency (
 $\unicode[STIX]{x1D714}^{\ast }$) via
 $\unicode[STIX]{x1D714}^{\ast }=2\unicode[STIX]{x03C0}f^{\ast }$. See figure 1 for a schematic of the dimensional variables defining the FSI system.
A schematic of the problem set-up and relevant dimensional quantities.

In terms of these dimensionless variables, the heave motion is written as
 $$\begin{eqnarray}h_{LE}(t)=h_{0}\sin (\unicode[STIX]{x1D714}t),\end{eqnarray}$$
where  $\unicode[STIX]{x1D714}=2\unicode[STIX]{x03C0}f$ is the dimensionless angular frequency and
 $t$ is the dimensionless time defined using the convective time scale
 $L/U$.
In this study, the Reynolds number and mass ratio are fixed at  $Re=240$ and
 $M=0.01$, respectively, whereas the stiffness, actuation frequency and heave amplitude are varied. The moderate Reynolds number is representative of swimming of small fish and larvae (Webb Reference Webb1988), and allows for a relatively large sweep of
 $S$ and
 $f$. The small mass ratio is a representative value for fish, which are neutrally buoyant and much thinner than they are long. The heave amplitudes are chosen to enable a systematic comparison of resonant and nonlinear effects in performance. Table 1 summarizes the range of parameter values considered in this work.
Range of parameter values considered for the nonlinear simulations. The frequency is varied in increments of 0.1.

In this article, the response of the plate will often be summarized using the transverse amplitude of the plate’s trailing edge,  $h_{TE}(t)$. Quantities relevant to swimming performance are the dimensionless thrust, lift and input power, defined here as
 $$\begin{eqnarray}C_{T}(t)=-{\displaystyle \frac{F_{x}}{\frac{1}{2}\unicode[STIX]{x1D70C}_{f}U^{2}L}},\quad C_{L}(t)={\displaystyle \frac{F_{y}}{\frac{1}{2}\unicode[STIX]{x1D70C}_{f}U^{2}L}},\quad C_{P}(t)=-C_{L}(t)v_{LE}(t)=-{\displaystyle \frac{F_{y}}{\frac{1}{2}\unicode[STIX]{x1D70C}_{f}U^{2}L}}{\displaystyle \frac{\text{d}h_{LE}}{\text{d}t}},\end{eqnarray}$$
where  $F_{x}$ and
 $F_{y}$ are the dimensional drag and lift defined as the horizontal and vertical forces integrated over the plate, respectively, and
 $v_{LE}=\text{d}h_{LE}/\text{d}t$ is the heave velocity. Performance is measured with respect to the temporal mean of these quantities – written as
 $\overline{C_{T}}$,
 $\overline{C_{L}}$ and
 $\overline{C_{P}}$, respectively – and in terms of some notion of efficiency (
 $\unicode[STIX]{x1D702}$) defined here as the Froude efficiency:
 $\unicode[STIX]{x1D702}=\overline{C_{T}}/\overline{C_{P}}$.
We note that the Froude efficiency is not a universally agreed upon metric of efficiency. Barrett et al. (Reference Barrett, Triantafyllou, Yue, Grosenbaugh and Wolfgang1999) and Maertens, Triantafyllou & Yue (Reference Maertens, Triantafyllou and Yue2015) have argued that this definition can provide unintuitive optima that give preference to motions that provide small thrust. However, its measure of the mean thrust (propulsive potential) obtained given some mean input power provides a natural and compelling means to determine efficiency, and for this reason it remains the standard definition used in the literature (Triantafyllou, Triantafyllou & Yue Reference Triantafyllou, Triantafyllou and Yue2000; Fish & Lauder Reference Fish and Lauder2006; Young & Lai Reference Young and Lai2007; Wu Reference Wu2011; Dewey et al. Reference Dewey, Boschitsch, Moored, Stone and Smits2013; Quinn et al. Reference Quinn, Lauder and Smits2014, Reference Quinn, Lauder and Smits2015; Mackowski & Williamson Reference Mackowski and Williamson2015; Das, Shukla & Govardhan Reference Das, Shukla and Govardhan2016; Floryan et al. Reference Floryan, Van Buren, Rowley and Smits2017; Liu et al. Reference Liu, Ren, Dong, Akanyeti, Liao and Lauder2017; Floryan & Rowley Reference Floryan and Rowley2018; Zhou & Mittal Reference Zhou and Mittal2018; Senturk & Smits Reference Senturk and Smits2019; Smits Reference Smits2019).
3 Numerical methods: nonlinear simulations and global linear stability modes
3.1 Nonlinear simulations
Nonlinear simulations are performed by solving the viscous Navier–Stokes equations and the geometrically nonlinear Euler–Bernoulli beam equation, and by coupling these via the no-slip condition on the plate surface.
We define the fluid domain as  $\unicode[STIX]{x1D6FA}$ and the plate surface as
 $\unicode[STIX]{x1D6E4}$. We let
 $\boldsymbol{x}$ denote the Eulerian coordinate representing a position in space,
 $\boldsymbol{X}(\unicode[STIX]{x1D703},t)$ be the coordinate attached to the body
 $\unicode[STIX]{x1D6E4}$ (
 $\unicode[STIX]{x1D703}$ is a variable that parametrizes the surface) and
 $\unicode[STIX]{x1D74C}(\unicode[STIX]{x1D703},t)$ be the displacement of the plate (
 $\unicode[STIX]{x1D74C}(\unicode[STIX]{x1D703},t)=\boldsymbol{X}(\unicode[STIX]{x1D703},t)-\boldsymbol{X}(\unicode[STIX]{x1D703},0)$). The dimensionless governing equations are written as
 $$\begin{eqnarray}\displaystyle & \displaystyle {\displaystyle \frac{\unicode[STIX]{x2202}\boldsymbol{u}}{\unicode[STIX]{x2202}t}}=-\boldsymbol{u}\boldsymbol{\cdot }\unicode[STIX]{x1D735}\boldsymbol{u}-\unicode[STIX]{x1D735}p+{\displaystyle \frac{1}{\text{Re}}}\unicode[STIX]{x1D6FB}^{2}\boldsymbol{u}+\int _{\unicode[STIX]{x1D6E4}(\unicode[STIX]{x1D703})}\boldsymbol{f}(\boldsymbol{X}(\unicode[STIX]{x1D703},t))\unicode[STIX]{x1D6FF}(\boldsymbol{X}(\unicode[STIX]{x1D703},t)-\boldsymbol{x})\,\text{d}\unicode[STIX]{x1D703}, & \displaystyle\end{eqnarray}$$
 $$\begin{eqnarray}\displaystyle & \displaystyle \unicode[STIX]{x1D735}\boldsymbol{\cdot }\boldsymbol{u}=0, & \displaystyle\end{eqnarray}$$
 $$\begin{eqnarray}\displaystyle & \displaystyle {\displaystyle \frac{\unicode[STIX]{x1D70C}_{s}}{\unicode[STIX]{x1D70C}_{f}}}{\displaystyle \frac{\unicode[STIX]{x2202}^{2}\unicode[STIX]{x1D74C}}{\unicode[STIX]{x2202}t^{2}}}={\displaystyle \frac{1}{\unicode[STIX]{x1D70C}_{f}U^{2}}}\unicode[STIX]{x1D735}\boldsymbol{\cdot }\boldsymbol{\unicode[STIX]{x1D70E}}-\boldsymbol{f}(\boldsymbol{X}), & \displaystyle\end{eqnarray}$$
 $$\begin{eqnarray}\displaystyle & \displaystyle \int _{\unicode[STIX]{x1D6FA}(\boldsymbol{x})}\boldsymbol{u}(\boldsymbol{x})\unicode[STIX]{x1D6FF}(\boldsymbol{x}-\boldsymbol{X}(\unicode[STIX]{x1D703},t))\,\text{d}\boldsymbol{x}={\displaystyle \frac{\unicode[STIX]{x2202}\unicode[STIX]{x1D74C}(\unicode[STIX]{x1D703},t)}{\unicode[STIX]{x2202}t}}. & \displaystyle\end{eqnarray}$$
In the above, equation (3.1) expresses the Navier–Stokes equations in an immersed-boundary formulation, equation (3.2) is the continuity equation for the fluid, equation (3.3) represents the structural equations governing the motion of the plate and (3.4) is the no-slip boundary condition enforcing that the fluid velocity matches the flag velocity on the flag surface. In (3.3), the time derivative is a Lagrangian derivative and the stress tensor is the Cauchy tensor in terms of the deformed plate configuration. The term  $\boldsymbol{f}$ that appears in (3.1) and (3.3) enforces the no-slip condition, and simultaneously drives structural motion and stresses imposed on the flow.
The nonlinear simulations are performed by solving (3.1)–(3.4) using the immersed-boundary algorithm of Goza & Colonius (Reference Goza and Colonius2017). The fluid equations are discretized using a discrete streamfunction formulation (Colonius & Taira Reference Colonius and Taira2008), and the plate is modelled using a corotational finite element formulation (Criesfield Reference Criesfield1991). To facilitate stable computations even in the presence of large structural motions, the nonlinear coupling between the structure and the fluid is enforced at each time instance; i.e. the method is strongly coupled. Immersed-boundary methods are well known to produce spurious computations of the stresses that enforce the fluid–structure coupling. These unphysical stresses were remedied by Goza et al. (Reference Goza, Liska, Morley and Colonius2016), and this remedy is incorporated into the FSI algorithm of Goza & Colonius (Reference Goza and Colonius2017). The FSI solver has been validated on several flapping flag problems for flags in both the conventional configuration (pinned at the leading edge) and the inverted configuration (clamped at the trailing edge) (Goza & Colonius Reference Goza and Colonius2017). The solver has also been used to investigate physical mechanisms driving inverted flag flapping (Goza, Colonius & Sader Reference Goza, Colonius and Sader2018).
The simulation parameters used in this work are described in appendix B. To facilitate studies of steady swimming, for all nonlinear simulations the heave amplitude was ramped up over a period of twenty convective time units via  $h_{LE}^{ramp}(t)=\unicode[STIX]{x1D6FC}(t)h_{LE}(t)$, where
 $\unicode[STIX]{x1D6FC}(t)$ is a scaling factor defined by
 $$\begin{eqnarray}\unicode[STIX]{x1D6FC}(t)=\left\{\begin{array}{@{}ll@{}}0,\quad & t\leqslant 5,\\ 6\left({\displaystyle \frac{t-5}{15}}\right)^{5}-15\left({\displaystyle \frac{t-5}{15}}\right)^{4}+10\left({\displaystyle \frac{t-5}{15}}\right)^{3},\quad & 5\leqslant t<20,\\ 1,\quad & t\geqslant 20.\end{array}\right.\end{eqnarray}$$
The zero amplitude used for  $0\leqslant t\leqslant 5$ is to allow the impulsive start from the fluid to decay. A shifted and scaled smooth step function (Ebert et al. Reference Ebert, Musgrave, Peachey, Perlin and Worley2003) is used over
 $5\leqslant t\leqslant 20$ because of its zero first and second derivatives at
 $t=5,20$. Analysis from the nonlinear simulations was performed after
 $t=20$, using data from a minimum of 10 heave periods.
3.2 Global linear stability modes
To facilitate a concise description of the linear stability computations, we express the nonlinear fully coupled FSI equations in a spatially discrete, temporally continuous setting as
 $$\begin{eqnarray}\unicode[STIX]{x1D648}\dot{\boldsymbol{y}}=\boldsymbol{r}(\boldsymbol{y}),\end{eqnarray}$$
where  $\boldsymbol{y}$ represents the full state of the system (i.e. all flow and structure variables required to characterize the full system dynamics). Equation (3.6) contains equations (3.1)–(3.4). Note the distinction between the matrix
 $\unicode[STIX]{x1D648}$ and the mass ratio
 $M$. The matrix
 $\unicode[STIX]{x1D648}$ is singular, which reflects the differential–algebraic nature of the governing equations (due to the no-slip condition on the plate).
The global linear system is defined from the nonlinear system (3.6) by linearizing about a base state,  $\boldsymbol{y}^{b}$. Writing
 $\boldsymbol{y}=\boldsymbol{y}^{b}+\boldsymbol{y}^{p}$ in (3.6), where
 $\boldsymbol{y}^{p}$ is a small perturbation from the base state, and retaining only linear terms in
 $\boldsymbol{y}^{p}$ leads to the linear system
 $$\begin{eqnarray}\unicode[STIX]{x1D648}\dot{\boldsymbol{y}}^{p}=\boldsymbol{A}\boldsymbol{y}^{p},\end{eqnarray}$$
where  $\boldsymbol{A}=\text{d}\boldsymbol{r}/\text{d}\boldsymbol{y}|_{\boldsymbol{y}^{b}}$. The specific form of the various terms are provided in Goza et al. (Reference Goza, Colonius and Sader2018).
The global eigenvalues ( $\unicode[STIX]{x1D706}_{i}$) that give the natural frequency of the fully coupled system and the corresponding modes (
 $\unicode[STIX]{x1D753}_{i}$) satisfy the generalized eigenvalue problem
 $\unicode[STIX]{x1D706}_{i}\unicode[STIX]{x1D648}\unicode[STIX]{x1D753}_{i}=\boldsymbol{A}\unicode[STIX]{x1D753}_{i}$,
 $i=1,\ldots ,n$ (with
 $n$ defined as the state dimension). These eigenvalues and modes are computed by an implicitly restarted Arnoldi algorithm (Lehoucq, Sorensen & Yang Reference Lehoucq, Sorensen and Yang1998), and are converged to within
 $||\unicode[STIX]{x1D706}_{i}\unicode[STIX]{x1D648}\unicode[STIX]{x1D753}_{i}-\boldsymbol{A}\unicode[STIX]{x1D753}_{i}||_{2}<10^{-8}$ for all results shown below.
4 Resonance for viscous plates: global modes of the FSI system
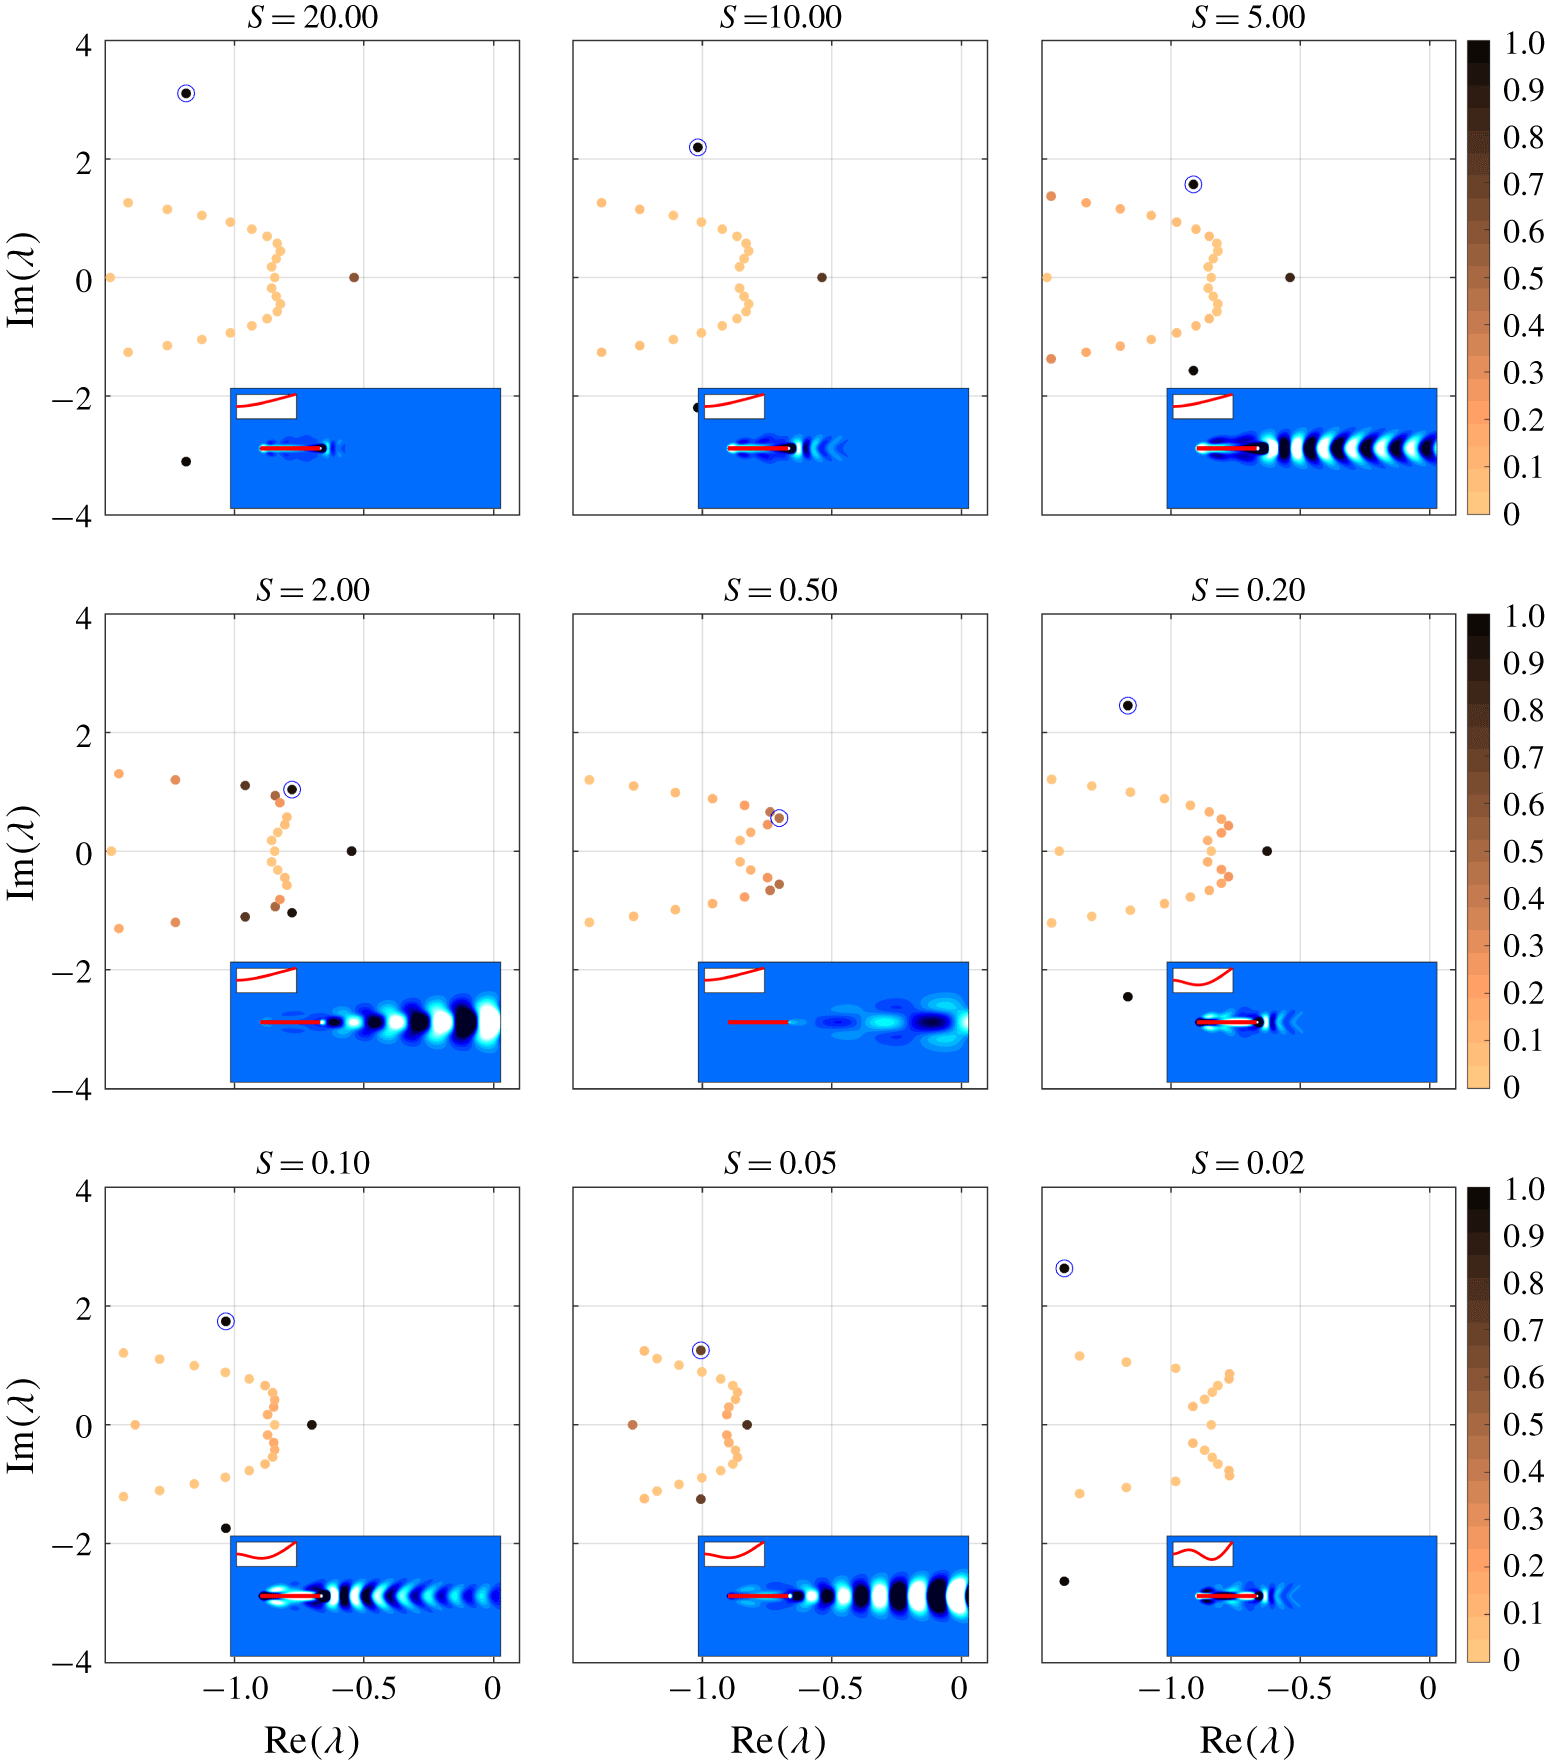
To provide a framework by which to define resonance in the simulations, we first present the eigenvalues of the fully coupled plate–fluid system in figure 2 for several different stiffnesses. The eigenvalues are colour coded by an energy ratio,  $E_{r}$, defined here as
 $$\begin{eqnarray}E_{r}={\displaystyle \frac{\displaystyle \int _{\unicode[STIX]{x1D6E4}(\unicode[STIX]{x1D703})}\left[S\left({\displaystyle \frac{\unicode[STIX]{x2202}^{2}\unicode[STIX]{x1D712}}{\unicode[STIX]{x2202}x^{2}}}\right)^{2}+M\unicode[STIX]{x1D701}^{2}\right]\text{d}\unicode[STIX]{x1D703}}{\displaystyle \int _{\unicode[STIX]{x1D6FA}(\boldsymbol{x})}|\boldsymbol{u}|^{2}\,\text{d}\boldsymbol{x}+\int _{\unicode[STIX]{x1D6E4}(\unicode[STIX]{x1D703})}S\left[\left({\displaystyle \frac{\unicode[STIX]{x2202}^{2}\unicode[STIX]{x1D712}}{\unicode[STIX]{x2202}x^{2}}}\right)^{2}+M\unicode[STIX]{x1D701}^{2}\right]\text{d}\unicode[STIX]{x1D703}}}.\end{eqnarray}$$
In (4.1), we denote by  $\unicode[STIX]{x1D712}$ and
 $\unicode[STIX]{x1D701}$ the
 $y$ displacement and velocity of the plate, respectively. All other parameters are defined earlier in the text. Physically, equation (4.1) provides a ratio of the potential and kinetic energy associated with the plate to the total system energy (potential and kinetic plate energy plus kinetic energy in the fluid). Note that the computation of the bending strain assumes the plate undergoes small strains, which is appropriate in this linear setting. All energies are computed from the eigenvector associated with the eigenvalue being considered. Note that because the denominator of the energy ratio is the total system energy,
 $E_{r}\leqslant 1$.
Also provided for each stiffness in figure 2 is the eigenvector associated with the largest value of  $E_{r}$. The eigenvector is plotted using the fact that the time response associated with a given eigenvalue-eigenvector pair
 $(\unicode[STIX]{x1D706}_{j},\unicode[STIX]{x1D753}_{j})$ is given by the real part of
 $\unicode[STIX]{x1D753}_{j}\text{e}^{\unicode[STIX]{x1D706}_{j}t}$. The insets contain plots of this response at the time
 $t$ for which the trailing-edge displacement is maximal. Note that the there is no amplitude scale in the insets, as the amplitude is irrelevant in this linear setting.
The main figures provide the first several eigenvalues with largest growth rate for nine different stiffnesses over the frequencies  $[-4,4]$. The markers are colour coded by the ratio,
 $E_{r}$ (see main text for details). For each stiffness, the eigenvalue with corresponding eigenvector of largest
 $E_{r}$ value is circled. The insets illustrate the response of the eigenvector associated with the circled eigenvalue at the time for which the trailing-edge displacement is maximal (the sub-insets convey zoomed-in versions of the plate shape). The eigenvectors are scaled to have unit 2-norm. Contours are of vorticity, plotted in 20 increments from
 $-0.05$ to 0.05, with white indicating positive and black indicating negative vorticity.

To explain the plots in figure 2, we first consider the specific stiffness  $S=20$ in figure 2. The top-left plot of the figure shows that there is one complex eigenvalue pair associated with a large value of
 $E_{r}$, and the inset demonstrates that the associated eigenvector has a plate shape reflective of the first mode of an Euler–Bernoulli beam. (There is also a zero frequency mode of non-negligible energy that coincides with divergence of the plate in a given transverse direction, depending on the nature of the perturbation. This mode is not expected to be significant in swimming, which inherently involves flapping behaviour of non-zero frequency.) There is minimal response in the fluid for this eigenvector (also shown in the inset). Despite the similarity of plate shape to the first mode of an Euler–Bernoulli beam, note that the frequency is smaller by two orders of magnitude than for that of an Euler–Bernoulli beam in a vacuum. This discrepancy attests to the significant role of added mass and viscosity in defining resonance for plates of low
 $M$ values. In addition to this structure-driven mode, there are several flow-driven modes that correspond to a small value of
 $E_{r}$. Indeed, these modes are similar to those associated with flow past a rigid, stationary body; cf., figure 15 in appendix A.
As the stiffness is decreased from  $S=20$, the structure-driven mode decreases in frequency and there is an increasingly pronounced wake response as the eigenvalue approaches those of the flow-driven modes. For
 $S=2$ and
 $S=0.5$, the proximity of the structure- and flow-driven modes leads to multiple eigenvectors with a non-trivial value of
 $E_{r}$. By
 $S=0.2$, the mode reminiscent of the first mode of an Euler–Bernoulli beam is associated with a much smaller value of
 $E_{r}$. Moreover, a new structure-driven mode appears that is similar to the second mode of an Euler–Bernoulli beam (though again, the natural frequency is different from that of an Euler–Bernoulli beam in a vacuum by two orders of magnitude). As occurred previously, the mode is initially associated with isolated wake structures, though as the stiffness is decreased the eigenvalue approaches those of the flow-driven modes and the mode’s wake becomes progressively expansive. Finally, for
 $S=0.02$, there is no signature of a mode reminiscent of the second mode of an Euler–Bernoulli beam with a large value of
 $E_{r}$. Instead, a new structure-driven mode appears that resembles the third mode of an Euler–Bernoulli beam and has a wake structure localized near the plate. One expects that the pattern would persist for lower stiffnesses, with the eigenvalue approaching those of the flow-driven modes (corresponding to a more extensive wake signature), and eventually disappearing and giving way to a higher-order structure-driven mode. (Although for very low stiffnesses, one would expect flutter modes to appear and affect the trends described in the main text. The appearance of these flutter modes was, for example, seen by Floryan & Rowley (Reference Floryan and Rowley2018) for inviscid flows.)
The remainder of this article will investigate the extent to which this resonant behaviour plays a role in finite-amplitude swimming. The nonlinear results will show that for a given stiffness, the ‘resonant response’ that leads to performance peaks coincides with actuating at a frequency near the natural frequency associated with the mode for which  $E_{r}$ is largest. Actuating at frequencies corresponding to the other eigenvalues is demonstrated to have a negligible effect on performance. At the same time, the results will show that there are parameters for which nonlinear mechanisms obscure this resonant behaviour. An example of such a nonlinear process is the vortex shedding and interaction that is a key feature of finite-amplitude swimming. This effect is notably absent in several of the modes depicted in figure 2, where vorticity is isolated near the plate.
5 Connections between nonlinearity and resonance
We now compare results from nonlinear high-fidelity simulations for  $S=0.02$, 0.2, 2, 20 to the resonant behaviour provided by the linear stability modes described in § 4. Results are first presented at relatively large amplitudes relevant to fish swimming,
 $h_{0}=0.1$. Connections between this large-amplitude behaviour and resonance are then drawn by considering nonlinear simulations of increasing amplitude.
5.1 General observations for large-amplitude motions
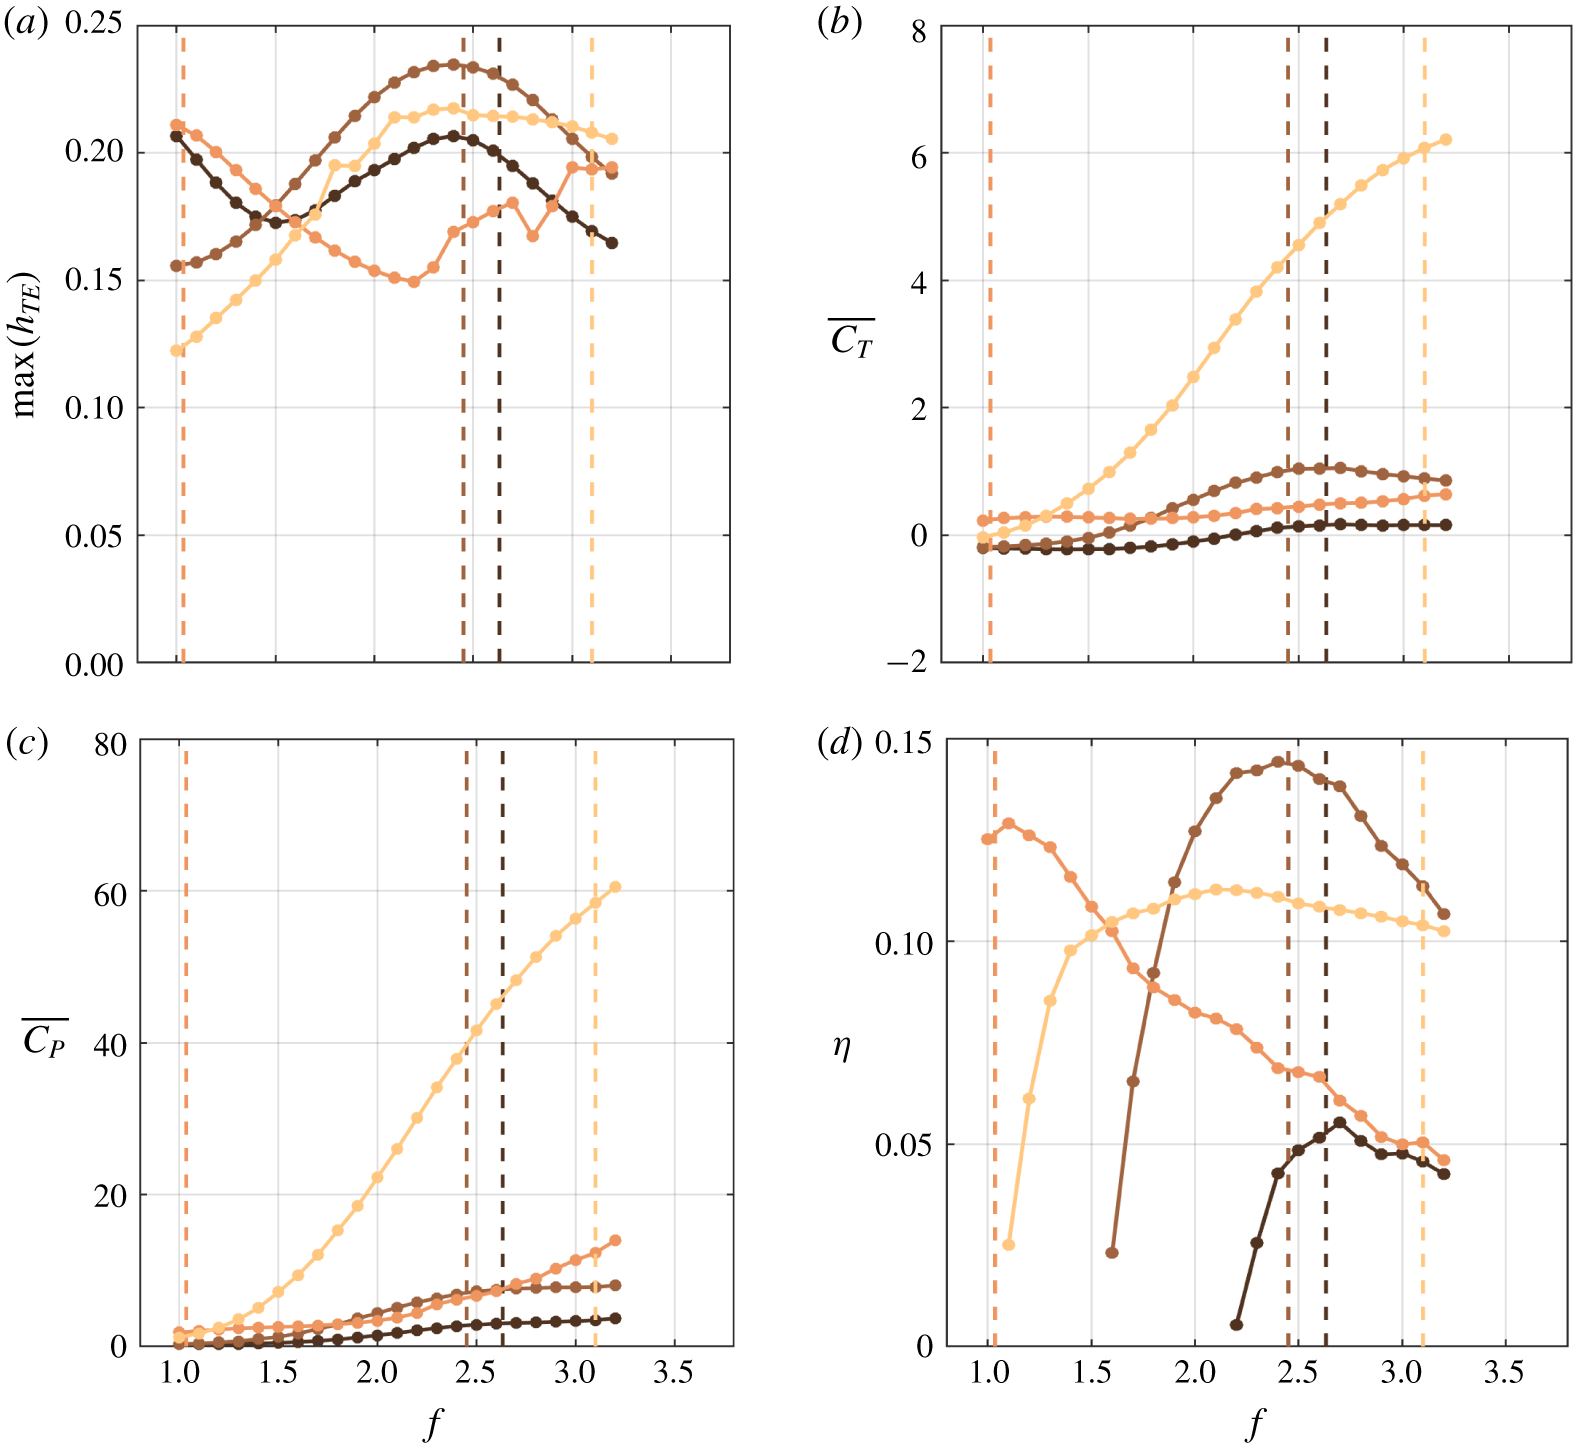
Figure 3 provides various quantities related to performance. Some features of these performance plots appear reflective of resonant behaviour. For example, for every stiffness except the stiffest case ( $S=20$), there are peaks in trailing-edge amplitude, mean thrust and efficiency at roughly the natural frequency of the global linear system (though note that in the case of mean thrust, the peak near the resonant frequency is only a local maximum for
 $S=2$).
Maximum transverse displacement of the trailing edge (a), mean thrust (b), mean input power (c) and Froude efficiency (d) versus dimensionless frequency,  $f$, obtained from the nonlinear simulations for
 $h_{0}=0.1$. Each plot contains four separate colours corresponding to four different stiffnesses:
 $S=0.02$ (black),
 $S=0.2$ (brown),
 $S=2$ (orange) and
 $S=20$ (yellow). The dashed vertical lines correspond to the natural frequency defined using the imaginary part of the global eigenvalues presented in § 4.

However, there are also differences between the nonlinear and linear results that suggest the presence of non-resonant mechanisms. First, even when there are peaks in trailing-edge amplitude, mean thrust and efficiency for a given stiffness, the peaks occur at slightly different frequencies for each quantity. For example, for  $S=2$ the maximum trailing-edge amplitude, mean thrust and efficiency occur at
 $f=1,1.3$ and
 $1.1$, respectively. Second, the swimming performance for
 $S=20$ is entirely different from what one would expect from resonance-based arguments; e.g. there are broad peaks in maximum trailing-edge amplitude and efficiency, with maxima occurring at
 $f=2.4$ and
 $f=2.1$, respectively (well below the resonant frequency of
 $f\approx 3.1$). Third, for
 $S=2$, there is an increase in maximum trailing-edge amplitude and mean thrust for
 $f\geqslant 2.4$ despite the fact that there are no eigenvalues corresponding to this frequency range (or to a mode at higher frequency up to
 $f=4$) for this stiffness.
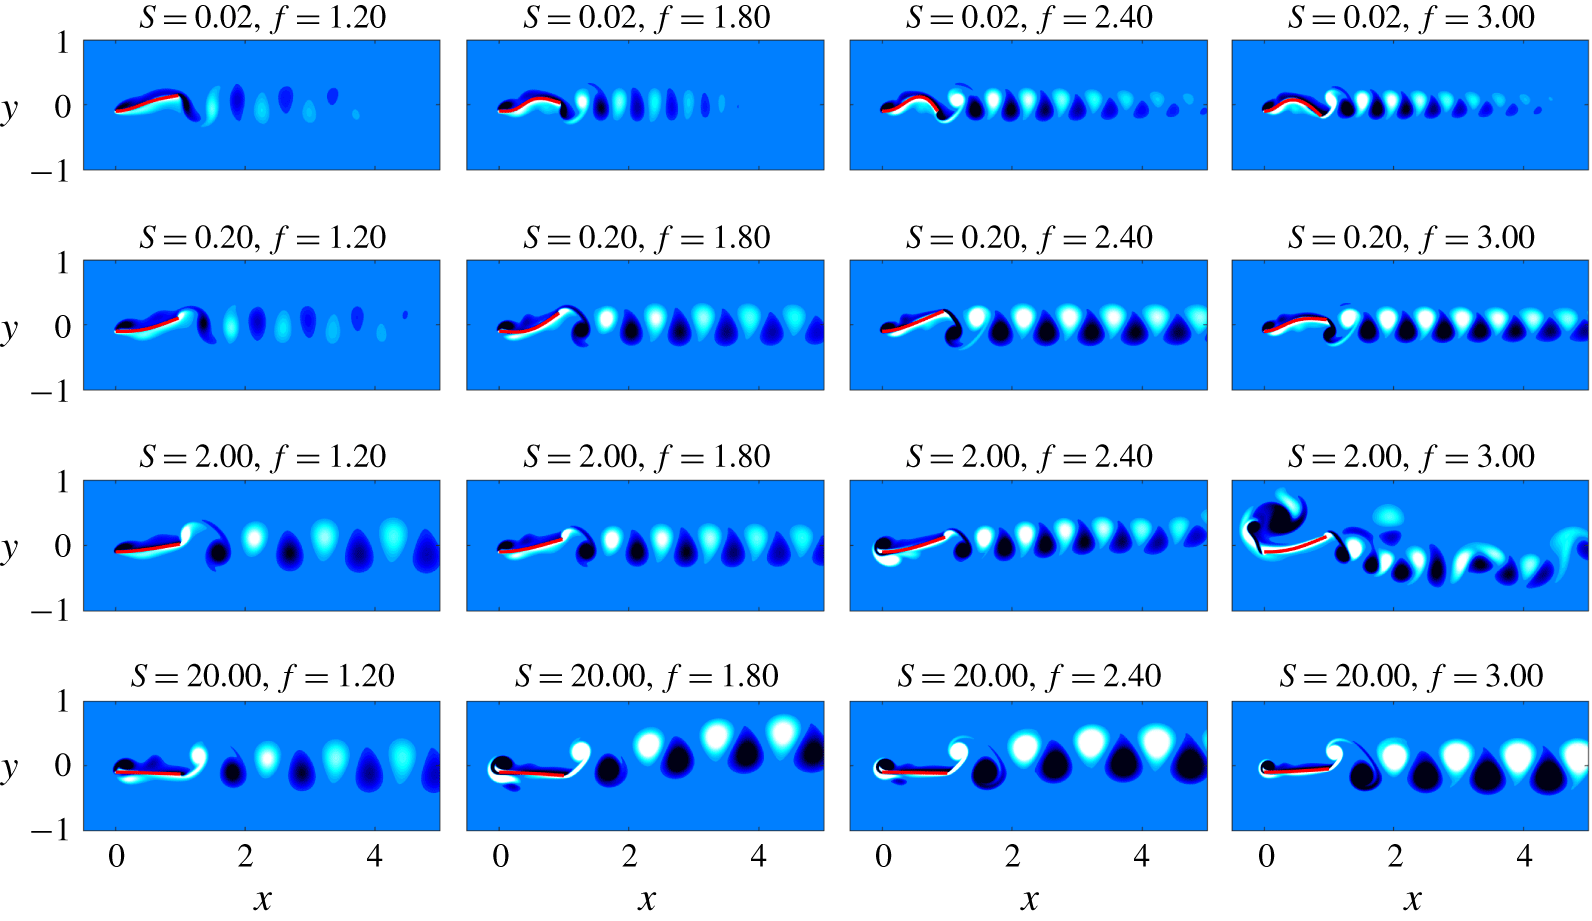
Connections to and distinctions from resonant behaviour are also suggested by the snapshots of large-amplitude swimming presented in figure 4. One connection to the resonant predictions is that near the resonant frequency, the plate shape in the nonlinear simulations resembles that of the global mode. However, the vortex dynamics in the nonlinear simulations is distinct from that observed in the global linear analysis: the finite-amplitude motion of the plate generates vortices at the leading and trailing edges, and these vortices subsequently interact in a manner not seen in the linear setting.
Snapshots during a flapping period, with each row containing a different stiffness and each column containing a different frequency. In each plot, the snapshot corresponds to the time instance where the plate’s leading edge is at its negative peak.

These observations motivate several questions about the relevance of resonance in large-amplitude swimming. First, for stiffnesses where there are performance peaks near the natural frequency of the global linear system, how similar is the large-amplitude dynamics to the linear stability modes? That is, to what extent is resonance responsible for optimal performance at finite amplitudes? Second, what dynamics is associated with the boosts in trailing-edge amplitude, mean thrust and mean input power at high frequency for  $S=2$? Finally, for
 $S=20$ where there is a noticeable departure from resonance-based performance predictions, what dynamics is associated with disappearance in performance peaks? We probe these questions in the remainder of this section by considering nonlinear simulations of increasing heave amplitude,
 $h_{0}=0.001,0.01$ and
 $0.1$.
5.2 Probing the effect of increasing nonlinearity
In this section, we consider stiffnesses  $S=0.02,0.2,2$ and
 $20$ separately. For each stiffness, we investigate the effect of increasing the heave amplitude from
 $h_{0}=0.001$, where the linear analysis of § 4 is relevant, to
 $h_{0}=0.1$, which better represents fish swimming. Through this systematic variation in amplitude, we identify connections to and distinctions from resonance in swimming performance at finite heave amplitudes.
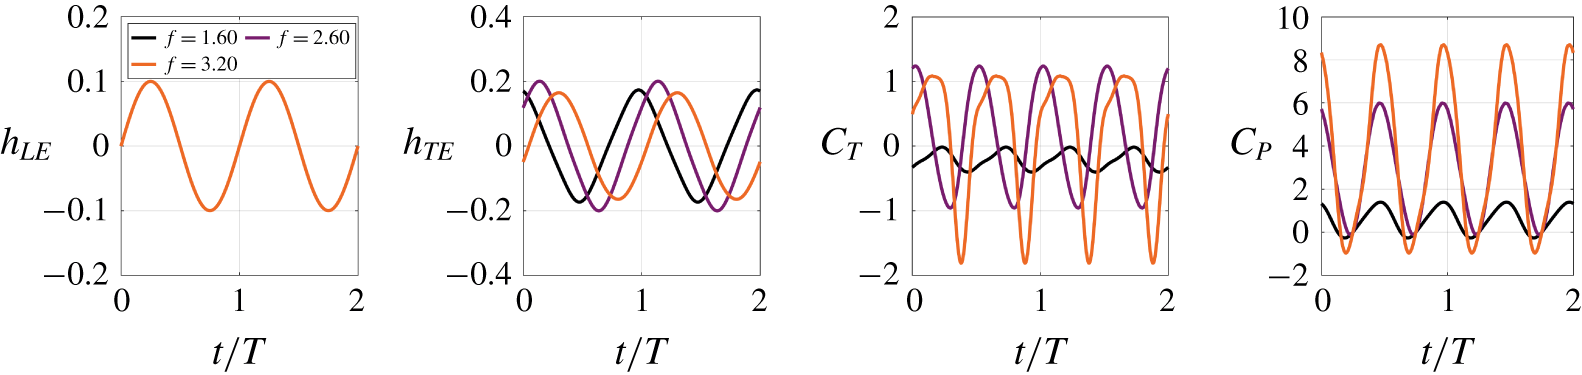
To give context for the results below, we note that for the majority of parameters considered, the plate–fluid system exhibits limit-cycle dynamics (exceptions to this will be discussed further below). Figure 5 depicts time traces of various quantities for  $S=0.2$ and three different frequencies, which are qualitatively representative of the typical behaviour of the system. To enable a meaningful comparison across frequencies, time is shifted so that
 $t=0$ coincides with the instance when the leading-edge displacement has maximal derivative (i.e. velocity), and scaled by
 $T$ so that the leading-edge motion has a period of unity. Note that the thrust and input power have twice the frequency of the trailing and leading-edge displacement. This fact is intuitive, since one would expect a peak in thrust or input power for both the top and bottom portions of a flapping cycle.
In the shifted and scaled representation of time, any of the quantities in figure 5 can be written as  $aw((t+\unicode[STIX]{x1D711})/T)$, where
 $a$ is the peak amplitude of the function,
 $w(t/T)$ is a periodic function (with a period of unity for
 $h_{TE}$ and
 $h_{LE}$ and of one half for
 $C_{T}$ and
 $C_{P}$) constructed so that
 $w(0)$ corresponds to the signal having a maximal derivative value and
 $\unicode[STIX]{x1D711}$ is the phase shift to account for the fact that the signal does not, in general, exhibit its maximal derivative at
 $t/T=0$. The expression is left in terms of a generic periodic function
 $w(t/T)$, since the signals are not generally sinusoids for every frequency and stiffness considered (due to a non-zero offset and the possible presence of additional harmonics). The convention of
 $w(0)$ coinciding with the time instant for which the derivative
 $\text{d}w/\text{d}t$ is maximal is used to enable an intuitive interpretation of
 $\unicode[STIX]{x1D711}$:
 $\unicode[STIX]{x1D711}=0$ corresponds to motion that is in phase with the prescribed leading-edge motion characterized by
 $h_{TE}(t)$. The prevalence of the periodic behaviour in this FSI system forms the basis for much of the analysis below.
Time traces of various quantities for  $S=0.02,h_{0}=0.1$. Only the
 $f=3.2$ curve is visible in the plot of
 $h_{LE}$, as the prescribed leading-edge kinematics are identical. The limit-cycle behaviour observed here is indicative of the plate–flow behaviour except for
 $f\geqslant 2.4$ at
 $S=2$.

To facilitate a comparison across the wide range of heave amplitude, frequency and stiffness parameters considered, the limit-cycle dynamics will be succinctly represented below in terms of its amplitude,  $a$, and phase shift,
 $\unicode[STIX]{x1D719}$. This limit-cycle dynamics disappears for
 $S=2$ and
 $f\geqslant 2.4$, rendering the amplitude–phase representation of the system dynamics inappropriate (as will be discussed in § 5.2.3).
5.2.1 Minimal stiffness:  $S=0.02$

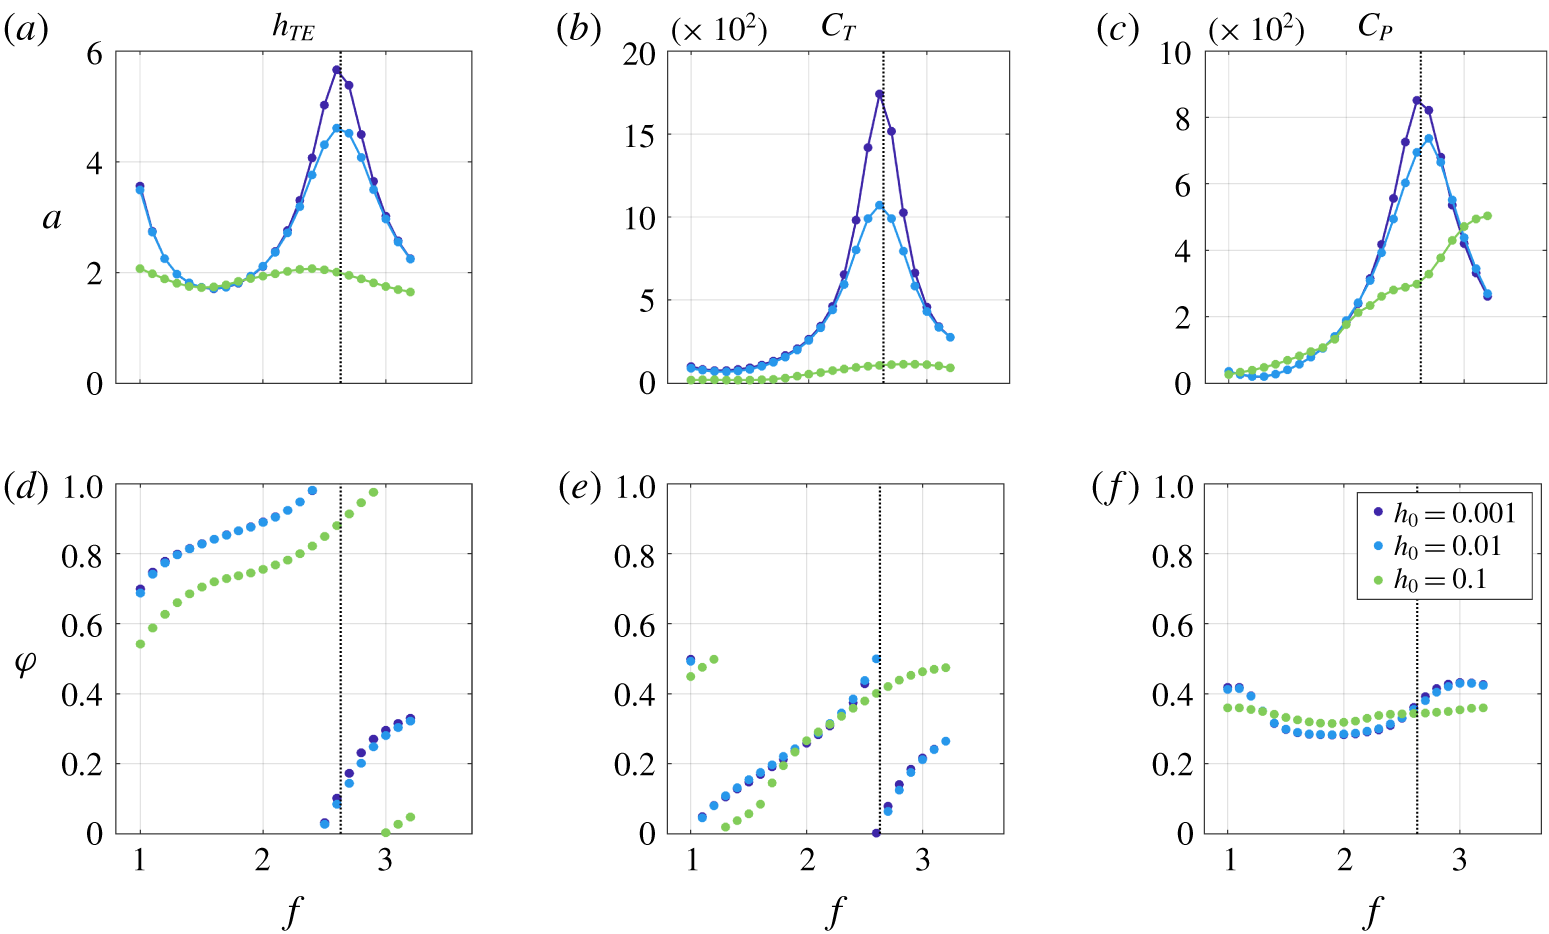
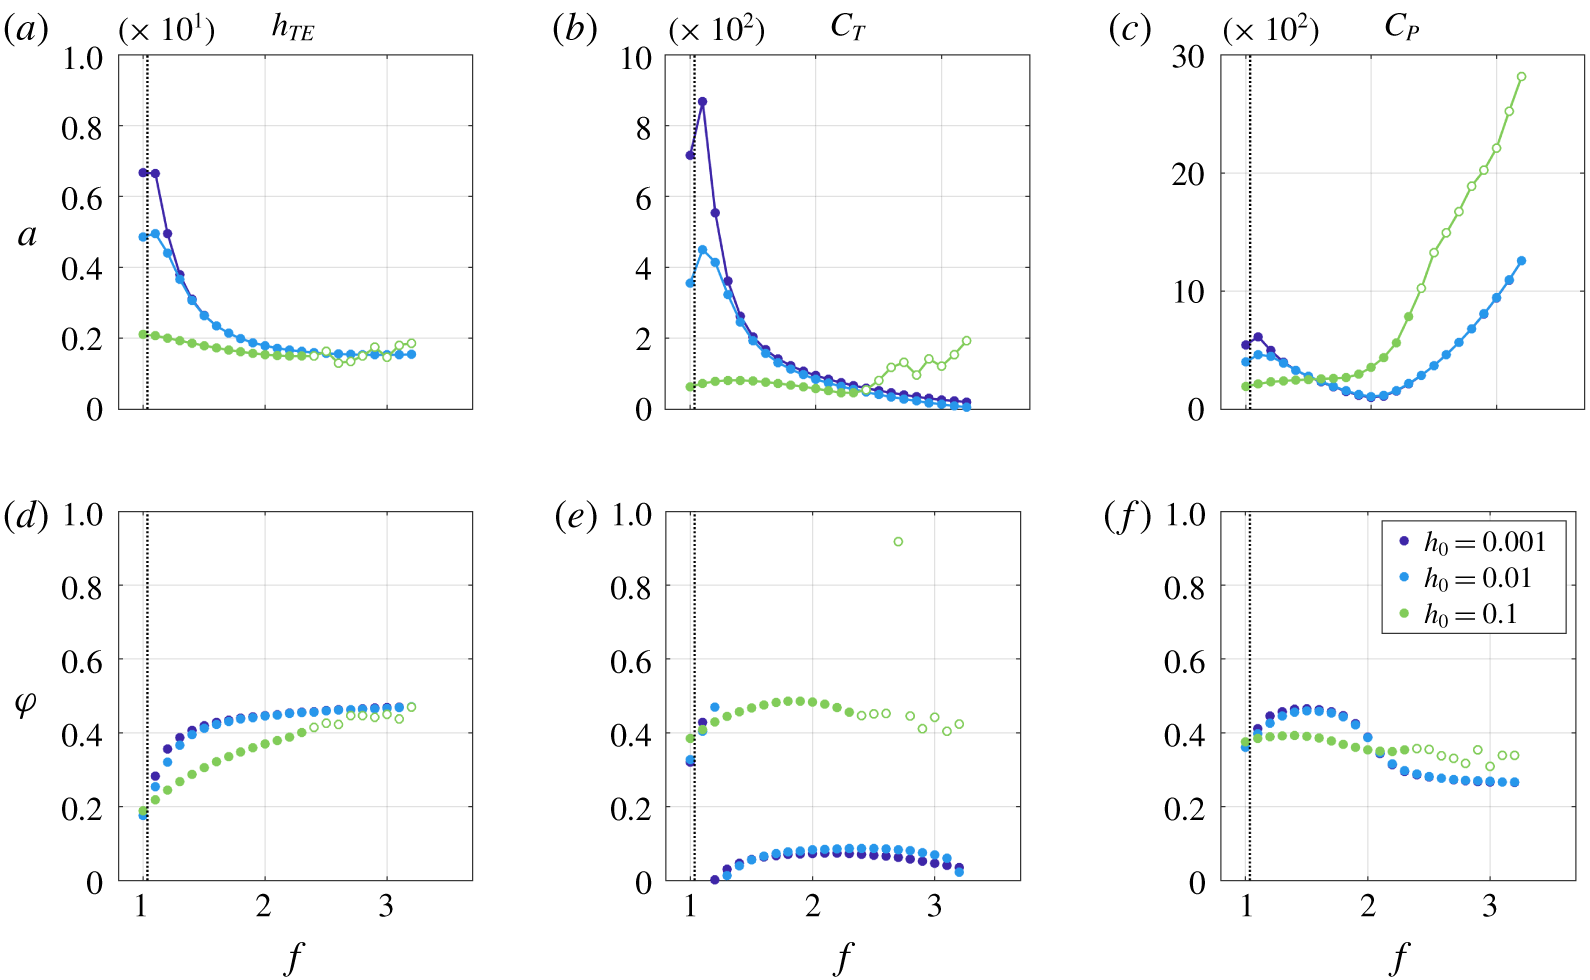
Here, we study the minimally stiff case ( $S=0.02$) in more detail. Figure 6 shows the phase shift,
 $\unicode[STIX]{x1D711}$, and amplitude,
 $a$, associated with the periodic signals
 $h_{TE},C_{T},$ and
 $C_{P}$ at a given frequency. Note that the phase shift exhibits a discontinuous jump at
 $\unicode[STIX]{x1D711}=1$ for
 $h_{TE}$ and
 $\unicode[STIX]{x1D711}=0.5$ for
 $C_{T}$ and
 $C_{P}$, which is the period (in terms of the scaled time
 $t/T$) of each of these quantities.
Definition of the oscillation amplitude,  $a$, for the quantities
 $h_{TE}$,
 $C_{T}$,
 $C_{P}$.

To enable a meaningful comparison across the various heave amplitudes, the amplitude,  $a$, of a quantity is scaled as described in table 2. If the dynamics was entirely linear, the scaled amplitudes in table 2 would not change with increasing heave amplitude
 $h_{0}$. This fact is readily apparent for the trailing-edge displacement, which scales linearly with
 $h_{0}$ under linear dynamics; the quadratic scaling of
 $C_{T}$ and
 $C_{P}$ under linear dynamics is explained in, e.g. Wu (Reference Wu1961), Floryan & Rowley (Reference Floryan and Rowley2018).
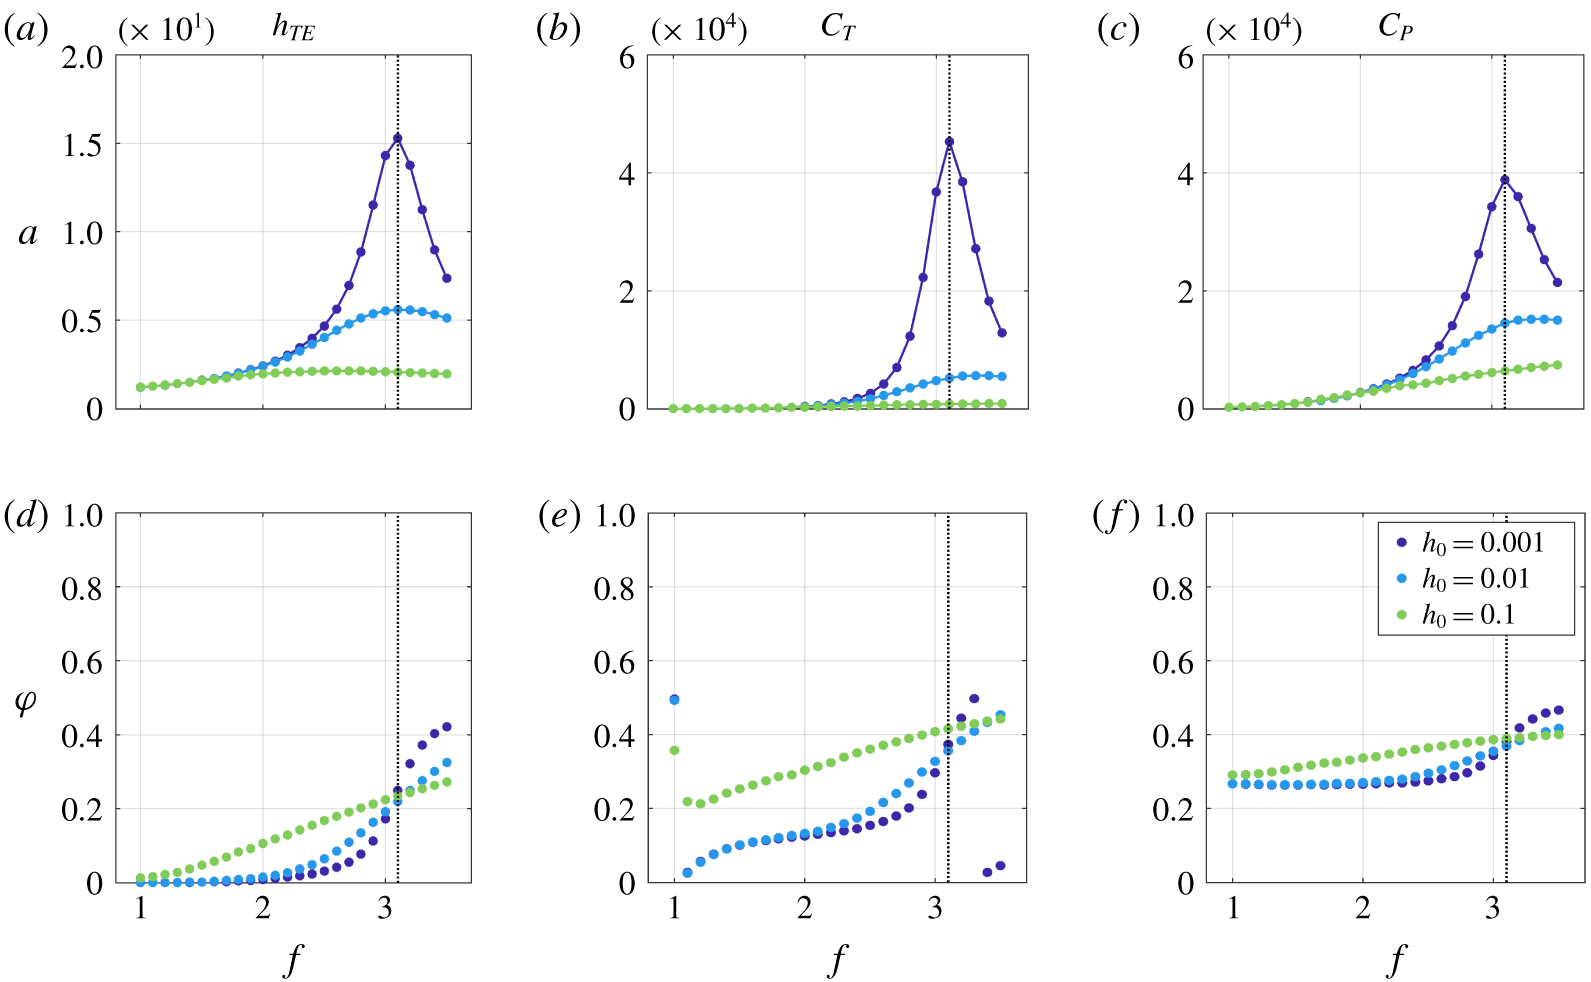
The amplitude (a–c),  $a$, and phase shift (d–f),
 $\unicode[STIX]{x1D711}$, of the trailing-edge displacement (a,d), thrust (b,e) and input power (c,f) versus frequency for
 $S=0.02$. Each plot contains three sets of markers corresponding to different heave amplitudes. To facilitate a comparison of the maximum amplitude across different values of
 $h_{0}$,
 $a$ is scaled as described in table 2. The vertical line denotes the natural frequency for this stiffness.

Figure 6 demonstrates that resonance plays a significant role in swimming performance for  $h_{0}=0.001$, where the swimming behaviour is essentially linear. In particular,
 $f=2.6$ (the frequency nearest to the natural frequency of the mode that maximizes the energy ratio
 $E_{r}$) is associated with the largest peaks in trailing-edge amplitude, thrust and input power. It is intuitive from the linear stability analysis of § 4 that actuating near this natural frequency leads to maximal energy put into the plate, resulting in the largest displacements and forces on the plate. We note that there is a local maximum in trailing-edge amplitude at
 $f=1$, which is near the frequency range associated with the flow-driven modes. Yet, consistent with the fact that these modes correspond to low values of
 $E_{r}$, these large plate displacements do not coincide with peaks in performance.
It is also clear from figure 6 that the linear dynamics associated with  $h_{0}=0.001$ largely persists at the larger heave amplitude of
 $h_{0}=0.01$. The largest peak in trailing-edge amplitude, thrust and input power continues to occur at
 $f=2.6$. Moreover, the dynamics of a given quantity at
 $h_{0}=0.01$ is of extremely similar phase to that at
 $h_{0}=0.001$. At the same time, nonlinear effects are also apparent: the peak value of
 $a$ for
 $C_{T}$ and
 $C_{P}$ is smaller than that associated with
 $h_{0}=0.001$.
For  $h_{0}=0.1$, small peaks in the amplitude
 $a$ persist for
 $h_{TE}$ and
 $C_{T}$ near – but no longer at – the natural frequency. The slight change in the frequency corresponding to maximal trailing-edge amplitude and thrust does not preclude the possibility of resonant-type behaviour; that is, a modified natural frequency could occur due to finite-amplitude effects of added mass and viscosity. At the same time, the smaller, broader peaks in trailing-edge amplitude and thrust at
 $h_{0}=0.1$ compared with
 $h_{0}=0.001,0.01$, as well as the qualitatively different phase behaviour at high frequencies for
 $h_{0}=0.1$, suggest non-resonant mechanisms.
Whereas the trailing-edge displacement and thrust appear to exhibit a mixture of resonant and non-resonant behaviour for  $h_{0}=0.1$, the input power is markedly different in both
 $a$ and
 $\unicode[STIX]{x1D711}$ at this higher heave amplitude. The phase is roughly constant for
 $h_{0}=0.1$, and the maximum amplitude of the input power does not exhibit a peak.
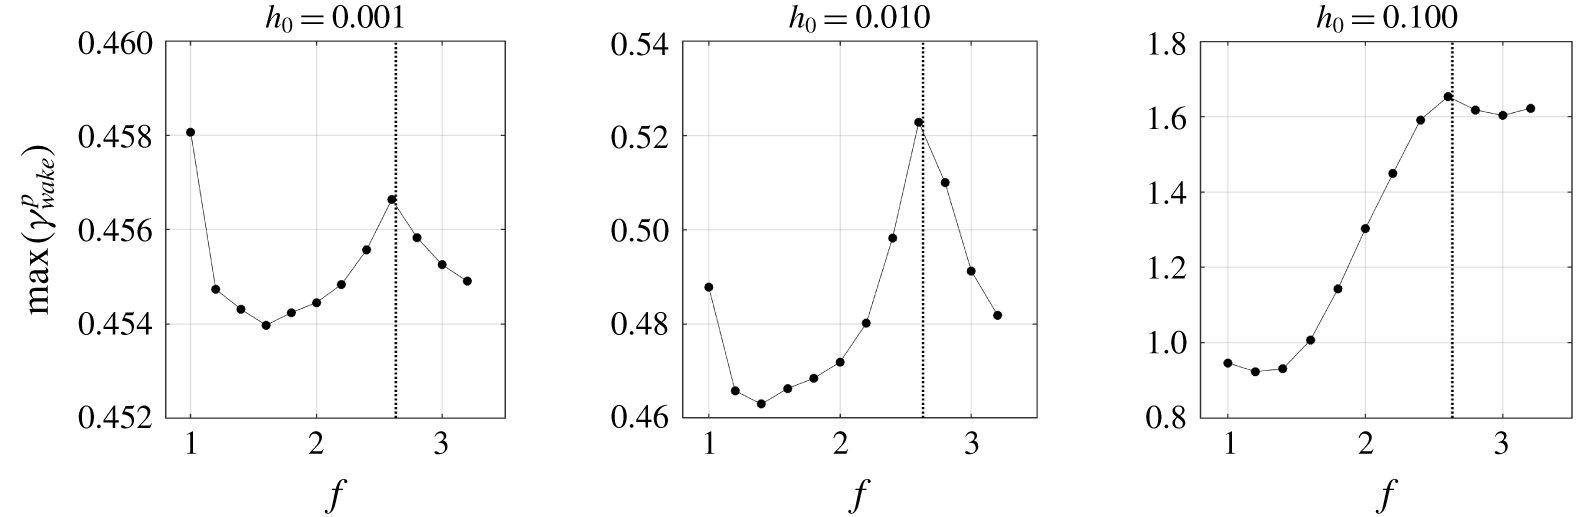
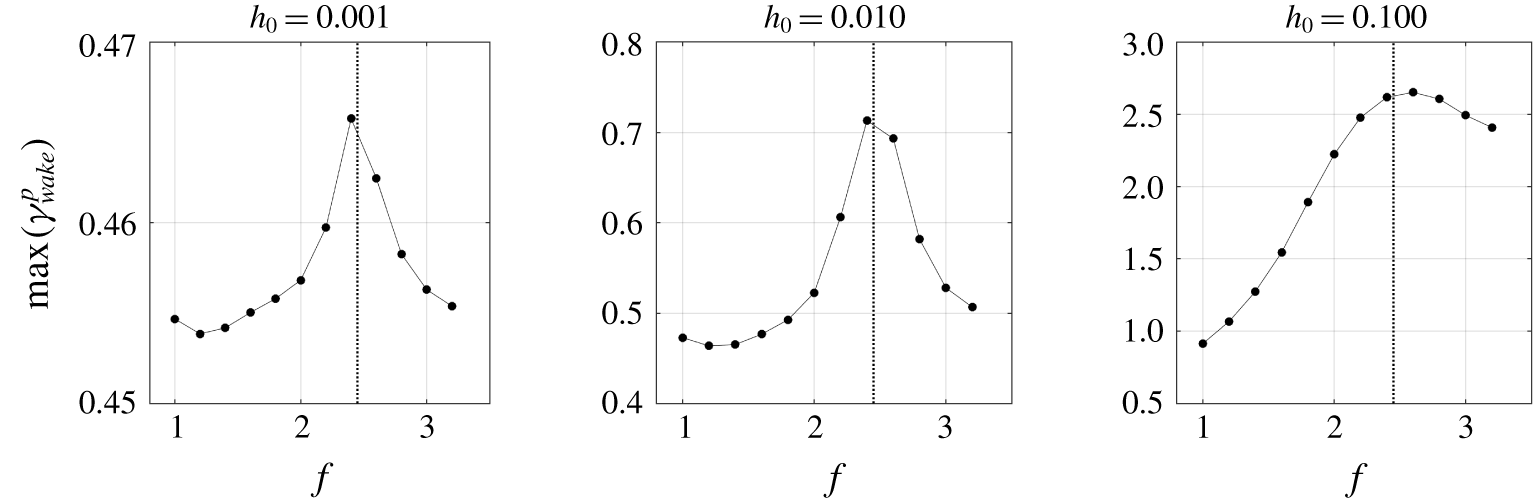
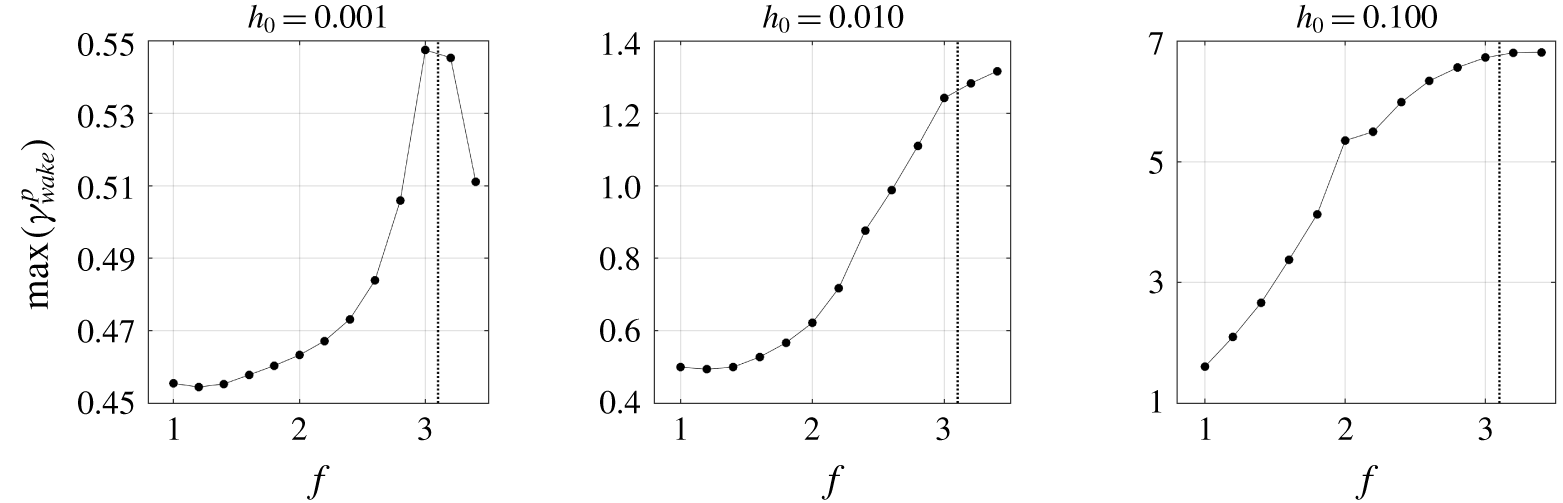
To continue to explore the role of resonance, we show in figure 7 the maximum circulation in the wake of the plate. The positive wake circulation,  $\unicode[STIX]{x1D6FE}_{wake}^{p}$, is defined as the integrated positive vorticity within a rectangle defined by
 $1\leqslant x\leqslant 5/3$ and
 $-1/2\leqslant y\leqslant 1/2$ (where the leading edge of the plate is positioned at
 $(x,y)=(0,0)$ when
 $h_{LE}=0$). The maximum circulation,
 $\max (\unicode[STIX]{x1D6FE}_{wake}^{p})$, is defined as the maximum value of
 $\unicode[STIX]{x1D6FE}_{wake}^{p}$ over 5 flapping periods. The analogous plots associated with the negative circulation are nearly identical to the ones provided here for the positive circulation. The figure demonstrates that, for all amplitudes, the maximal wake circulation occurs near the resonant frequency associated with the mode of largest
 $E_{r}$ value. The fact that maximal circulation occurs near the resonant frequency for all heave amplitudes suggests that, at this stiffness, resonance plays a role in the circulation formed in the plate’s wake. The mean thrust is maximal at this same frequency (cf., figure 3), indicating that this connection between resonance and circulation extends to mean swimming performance.
Maximum positive circulation in the plate’s wake versus frequency for  $S=0.02$ and various heave amplitudes (see main text for details on how the maximum circulation is defined). The vertical dashed line depicts the resonant frequency at this stiffness.

To summarize the results for this stiffness, the role of resonance is less straightforward than what one might conclude from figure 3, even for  $S=0.02$, which exhibits peaks near the natural frequency for several mean performance quantities. The thrust dynamics is different at large heave amplitudes from its small-amplitude counterparts, particularly at high frequencies. Moreover, the input power transitions to a qualitatively different dynamics at large amplitudes. Together, these facts indicate that non-resonant, nonlinear effects play a non-trivial role in performance, though the persistence of a peak in mean thrust and maximal wake circulation near the resonant frequency suggests that features of resonance may continue to be important in finite-amplitude swimming at this stiffness. Regarding this resonant phenomenon, the general trend is that the peaks broaden and shorten as heave amplitude is increased. This could be reflective of a number of phenomena not accounted for by the global linear analysis and small-amplitude simulations, including added-mass effects from finite-amplitude heaving or formation and interaction of vortical structures along the plate’s length and in the plate’s wake. Interestingly, introducing damping into a spring–mass system has a similar effect of broadening and weakening the frequency response of the system, and it is possible that the aforementioned effects could be providing similar damping mechanisms. Probing this possibility in more depth is left to future study.
5.2.2 Moderate stiffness: $S=0.2$

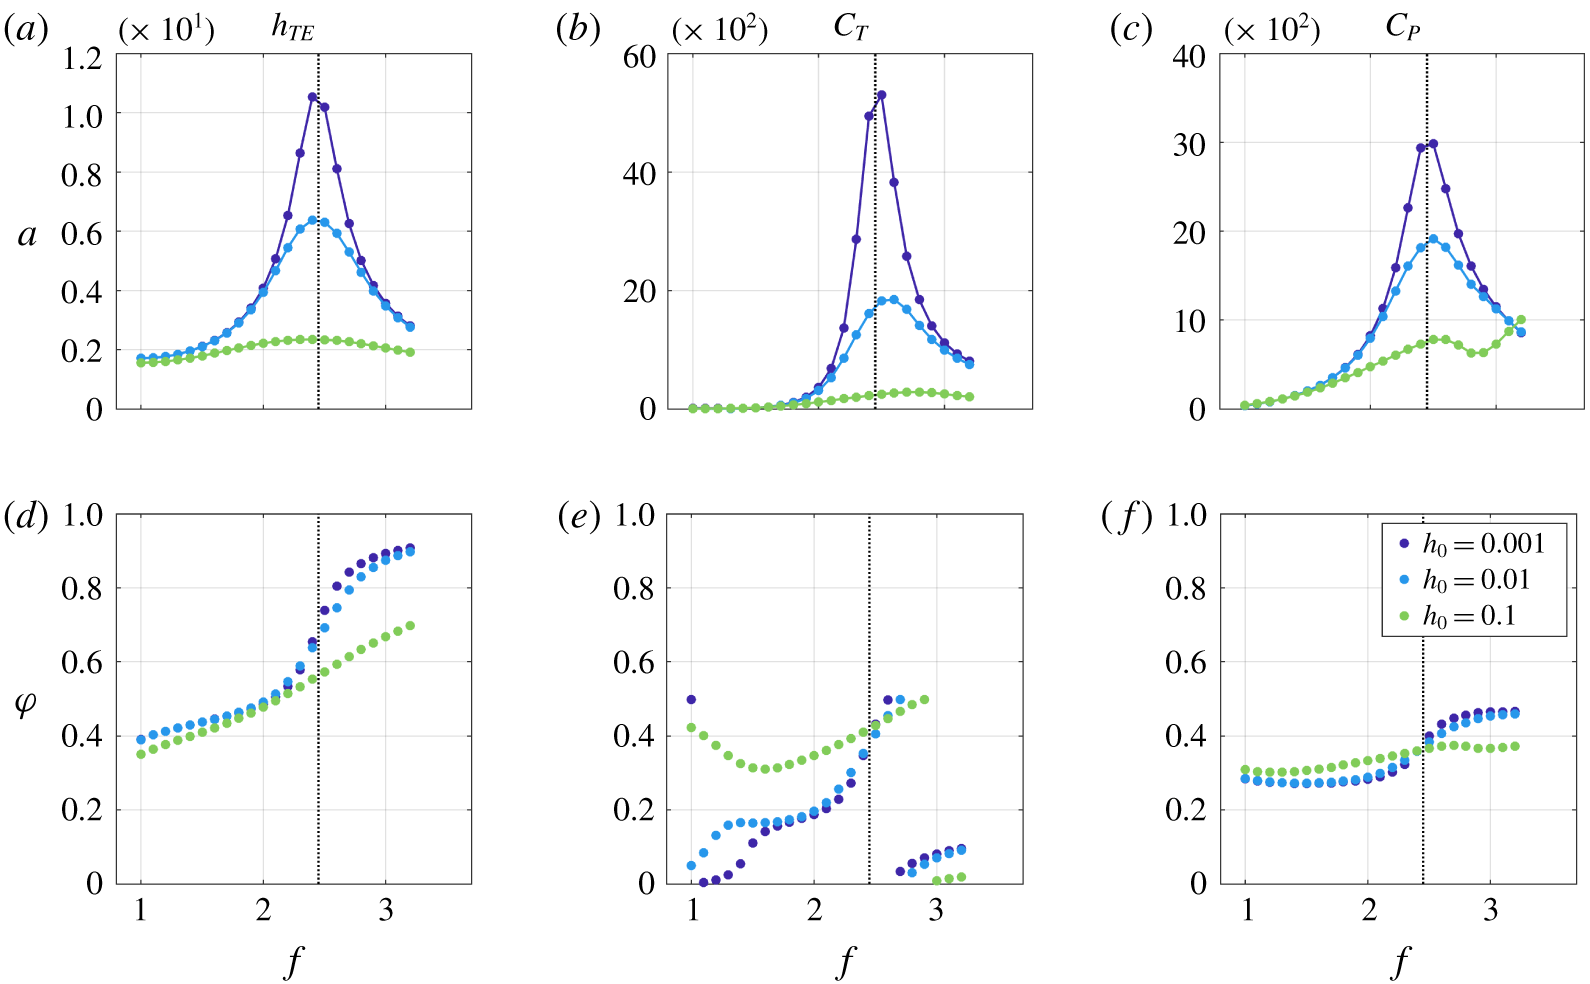
We now consider increasing the stiffness to  $S=0.2$. Figure 8 shows the phase and maximum amplitude associated with
 $h_{TE},C_{T}$ and
 $C_{P}$ at a given frequency. As was observed for
 $S=0.02$, the figure suggests the presence of both resonant and non-resonant mechanisms.
For small heave amplitudes ( $h_{0}\leqslant 0.01$), the dynamics appears to be primarily linear: the behaviour of
 $a$ and
 $\unicode[STIX]{x1D719}$ is similar for all three quantities (though the smaller peaks in amplitude for
 $h_{0}=0.01$ than for
 $h_{0}=0.001$ demonstrate the appearance of nonlinear mechanisms). Moreover, resonance appears to play the primary role for these values of
 $h_{0}$, as there are peaks in all three quantities near the resonant frequency associated with the mode of largest
 $E_{r}$ value.
For  $h_{0}=0.1$, either global or local peaks appear in all quantities near the resonant frequency. Moreover, the phase associated with the thrust is similar to that of the lower heave amplitudes near the resonant frequency. These facts suggest a non-trivial role of resonance in dictating performance of finite-amplitude swimming at this stiffness. At the same time, the peaks are broader and smaller at this larger heave amplitude, and the phase behaviour of all quantities reflect significant differences from the smaller heave amplitude cases (where resonance dominates). Moreover, while there is a local peak in
 $a$ for the input power, the overall shape of the curve is different from those associated with
 $h_{0}=0.001,0.01$.
Analogue of figure 6 for stiffness  $S=0.2$.

To establish connections between vortex formation and performance, we provide in figure 9 the maximum wake circulation (see the text surrounding figure 7 for details on how this is defined) as a function of frequency for the various heave amplitudes. As with  $S=0.02$, the maximum wake circulation occurs near the resonant frequency for all heave amplitudes. The maximum mean thrust also occurs near this frequency, which again suggests that resonance could be connected to maximal mean thrust production at this stiffness.
Analogue of figure 7 for stiffness  $S=0.2$.

Analogue of figure 6 for stiffness  $S=2$. The open markers for
 $h_{0}=0.1$,
 $f\geqslant 2.4$ correspond to aperiodic dynamics for which this amplitude–phase analysis is not valid.

5.2.3 Moderate stiffness: $S=2$

Figure 10 provides the phase and maximum amplitude associated with  $h_{TE},C_{T}$ and
 $C_{P}$ at a given frequency for a stiffness
 $S=2$. The figure indicates that the dynamics is essentially linear for the small heave amplitudes
 $h_{0}=0.001,0.01$ (both
 $a$ and
 $\unicode[STIX]{x1D711}$ exhibit similar behaviour at these smaller values of
 $h_{0}$), and that resonance continues to play a primary role for these values of
 $h_{0}$ (resonant peaks are present in all quantities). However, the behaviour of
 $a$ for
 $C_{P}$ suggests that there are non-resonant mechanisms even in this linear regime: the maximum value of
 $a$ occurs at
 $f=3.2$ – well away from the natural frequency for this stiffness. (The global maximum may occur at a higher frequency, as the amplitude is still increasing at
 $f=3.2$, although in either case this is away from the natural frequency.)
For the largest heave amplitude,  $h_{0}=0.1$, there are both similarities and differences to the cases with smaller heave amplitudes. The main similarity is that the thrust and trailing-edge amplitude exhibit either a local or global peak near the resonant frequency corresponding to the mode with largest
 $E_{r}$ value. This again points to resonant features present in the dynamics exhibited by this stiffness, particularly for low frequencies.
There are also several differences between the large heave amplitude dynamics and that of smaller amplitude. First, the phase associated with  $h_{0}=0.1$ is different for all quantities to that associated with smaller heave amplitudes. An even more conspicuous difference is the significant variations in
 $a$ for
 $h_{TE}$ and
 $C_{T}$ when
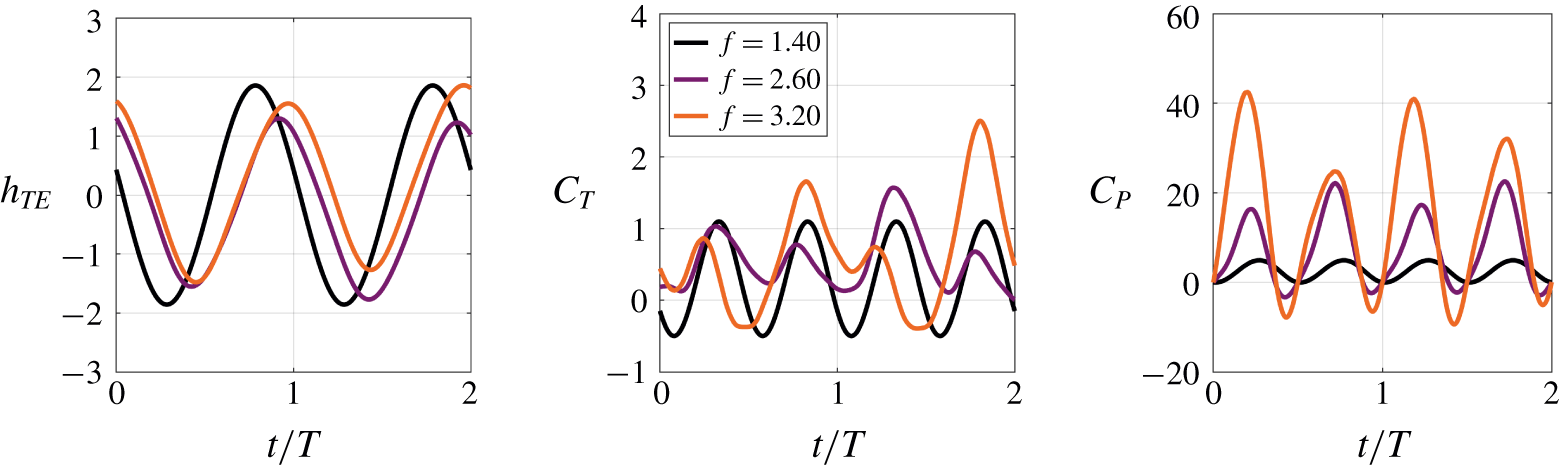
 $f\geqslant 2.4$. This variability is due to the fact that the signals are not periodic at this stiffness for these frequencies, rendering this amplitude–phase representation inappropriate. Figure 11 provides time traces of
 $h_{TE}$,
 $C_{T}$ and
 $C_{P}$ for
 $f=1.4$ (for which the quantities exhibit periodic behaviour), and for
 $f=2.6$ and
 $3.2$ (for which the quantities are aperiodic). This aperiodic dynamics is consistent with the pronounced leading-edge vortical structures (and associated separation at the leading edge) and asymmetric wake structures observed in figure 4 for
 $S=2$ at
 $f=2.4$ and
 $3$. These nonlinear, non-resonant mechanisms cause a significant departure from the essentially linear dynamics displayed in figure 10 for small heave amplitudes.
Time traces of various quantities for  $S=2,h_{0}=0.1$. Limit-cycle behaviour is observed for
 $f=1.4$, but not for
 $f=2.6,3.2$. This illustrates the presence of nonlinear, non-resonant mechanisms for
 $f>2.2$.

To connect performance to wake circulation, we present in figure 12 the maximum circulation in the wake of the plate (see the text surrounding figure 7 for details on how this is defined) as a function of frequency for the various heave amplitudes. For  $h_{0}=0.001,0.01$ the maximum circulation is observed near the resonant frequency associated with the mode for which
 $E_{r}$ is maximal. For the larger heave amplitude of
 $h_{0}=0.1$, there is a local peak near this resonant frequency before the maximum circulation increases significantly at higher frequencies.
Analogue of figure 7 for stiffness  $S=2$.

Together, the results contained in figures 10–12 indicate that for large-amplitude swimming at  $S=2$, there is a distinction between low frequencies (
 $f<2.4$), for which leading-edge separation is sufficiently small, and high frequencies (
 $f\geqslant 2.4$), for which leading-edge separation and vortex dynamics are prominent. At low frequencies, the results are analogous to those found for the lower stiffnesses. Many features of linear dynamics persist at large heave amplitudes, and thrust peaks are associated with actuating at the resonant frequency to obtain maximal wake circulation. At high frequencies, the results are substantially different from those associated with the more flexible plates. There is a prominent leading-edge vortex dynamics that is associated with significantly larger thrust peaks and wake circulation than what is created by resonant mechanisms at lower frequencies.
5.2.4 Maximal stiffness: $S=20$

We now turn to the stiffest case considered,  $S=20$. Figure 13 provides the phase and maximum amplitude associated with
 $h_{TE},C_{T},$ and
 $C_{P}$ at a given frequency. Note that for all results shown in this subsection (corresponding to
 $S=20$), the frequency range is
 $f\in [1,3.5]$ rather than
 $f\in [1,3.2]$. This is done to provide enough data points beyond the natural frequency of
 $f\approx 3.1$ to enable meaningful conclusions about the role of resonance to be drawn.
As was observed for the more flexible cases, resonance appears to be the dominant indicator of performance at the smallest heave amplitude ( $h_{0}=0.001$), with peaks in
 $a$ occurring for all quantities near the natural frequency associated with the linear stability mode of largest
 $E_{r}$ value. These resonant peaks largely persist at the larger value of
 $h_{0}=0.01$, and the similar phases across
 $h_{0}=0.001$ and
 $h_{0}=0.01$ suggest that the dynamics remains primarily linear up to this larger amplitude.
The trends at the larger heave amplitude are similar to those observed for the other stiffness values. The peaks broaden and weaken significantly compared with the smaller heave amplitudes, but persist near the resonant frequency. In addition, the phase behaviour is distinct from that corresponding to the lower heave amplitudes.
Analogue of figure 6 for stiffness  $S=20$.

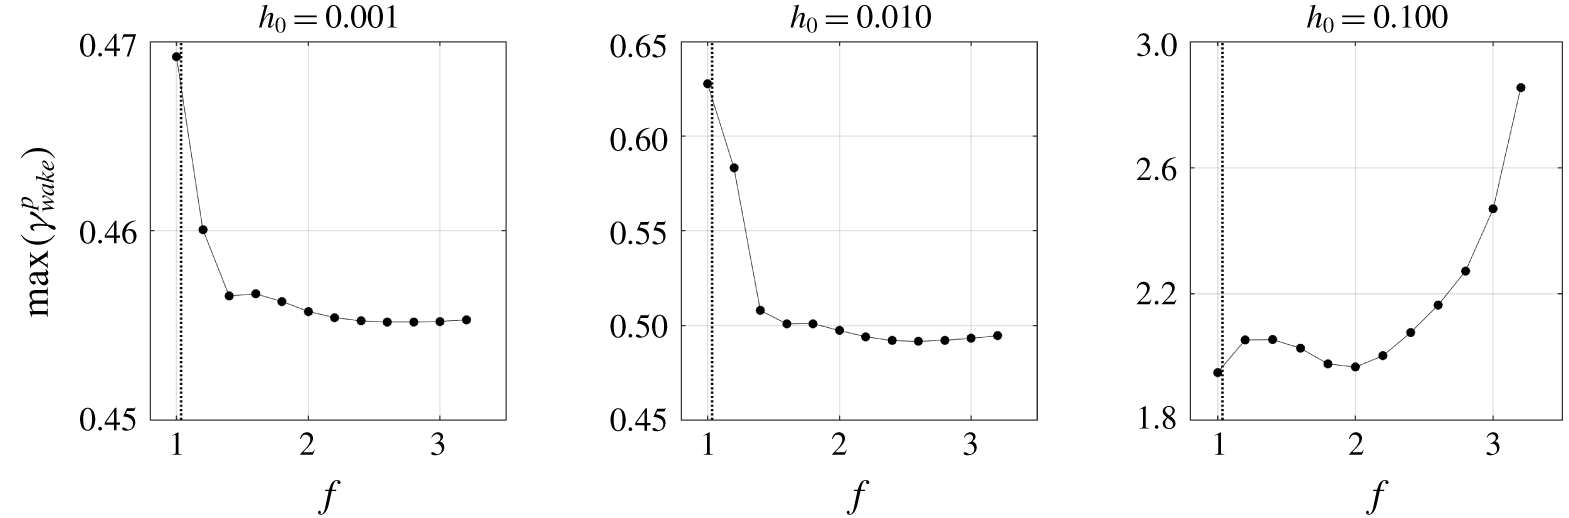
In figure 14, we again probe the connection between thrust and wake circulation by showing the maximum wake circulation (see the text surrounding figure 7 for details on how this is defined) as a function of frequency for the various heave amplitudes. For  $h_{0}=0.001,0.01$ and
 $0.1$, the maximum circulation is observed near the resonant frequency associated with the mode for which
 $E_{r}$ is maximal (although it is difficult to arrive at concrete conclusions about the role of resonance in wake circulation at this stiffness because the resonant frequency is near the maximal frequency considered in this study). Irrespective of the connection to resonance, the frequency associated with maximal wake circulation is also associated with maximal mean thrust (cf., figure 3), as was observed for more flexible plates.
Analogue of figure 7 for stiffness  $S=20$.

Finally, we note that for  $h_{0}=0.1$ at this larger stiffness, the plate–fluid system contains significant leading-edge vorticity that indicates separation; cf., figure 4. This leading-edge vorticity is most pronounced for
 $S=20$ when
 $1.8\leqslant f\leqslant 2.4$. From figure 3, it is clear that these frequencies coincide with small increases in efficiency. Moreover, unlike for
 $S=2$, the separated flow behaviour is not associated with aperiodic system dynamics for
 $S=20$, nor does it correspond to substantial changes in performance. This demonstrates that leading-edge separation and vorticity generation, while not accounted for in the linear analysis, do not necessarily indicate significant changes in performance from what one would predict through resonance-based arguments.
6 Conclusions and connections to other work
In this article, we investigated the role of resonance in finite-amplitude swimming of a flexible flat plate in a viscous fluid ( $Re=240$). First, we unambiguously defined resonance using linear stability modes of the fully coupled fluid–structure interaction system. These modes represent eigenvalues and eigenvectors that account for the viscous fluid, the plate and the coupling between them. The eigenvalues associated with modes that maximized the energy put into the plate, quantified in terms of an energy ratio (
 $E_{r}$), were shown to provide an appropriate measure for system resonance.
We then probed the connections between finite-amplitude swimming and resonant behaviour through high-fidelity nonlinear simulations of systematically increased heave amplitude. By comparing the results for different heave amplitudes with one another and with the linear stability modes, connections to and distinctions from resonant behaviour were established for finite-amplitude swimming over a wide range of stiffnesses ( $S=0.02,0.2,2,20$). The primary observations of this article (with connections to other work provided where appropriate) are:
Small heave amplitudes. For sufficiently small heave amplitudes ( $h_{0}=0.01$ in our studies) the dynamics was similar across heave amplitude, suggesting primarily linear behaviour. Beyond this, peaks in trailing-edge displacement, thrust and input power all occurred near the resonant frequency corresponding to the mode with largest
 $E_{r}$ value. The connection of performance to this energy ratio can be intuited by observing that the mode of largest
 $E_{r}$ value contains the largest per cent energy in the structure. Thus, actuation that excites this mode will produce the maximum response (and energy put into) the swimmer. Moreover, the relationship between performance and the global linear eigen-pairs of the FSI system indicates that resonance is a dominant contributor to performance in this small-amplitude regime.
Large heave amplitudes. At larger heave amplitudes more reflective of fish swimming ( $h_{0}=0.1$ in our studies), the results indicated that both resonant and non-resonant mechanisms played a role.
Regarding resonant behaviour, different plate shapes were observed depending on the plate stiffness and heave frequency, and these shapes were consistent with the shapes predicted by the global linear analysis. More flexible plates were more likely to exhibit shapes that are reminiscent of higher modes of an Euler–Bernoulli beam. This phenomenon was also observed by Quinn et al. (Reference Quinn, Lauder and Smits2014) through experiments at higher Reynolds numbers.
In addition, peaks in trailing-edge motion and thrust persisted near the resonant frequency for all stiffnesses considered, with the general trend that the peaks weakened, broadened and occurred at slightly shifted frequencies from the resonant frequency identified through the linear stability analysis. This distinction from the linear behaviour can be due to a number of phenomena, including added-mass effects from finite-amplitude heaving, leading-edge separation and nonlinear vortex generation and interaction not present for small-amplitude kinematics. Interestingly, the broader and weaker frequency response is consistent with the response of a spring–mass system subjected to damping. The aforementioned nonlinear mechanisms could therefore be providing an effective damping mechanism, which in turn could be related to the nonlinear fluid damping effect argued by Ramananarivo et al. (Reference Ramananarivo, Godoy-Diana and Thiria2011) (though the authors considered larger mass ratios and heave amplitudes than those of this study that almost certainly led to differences in the detailed system response). Clarifying the specific nonlinear mechanisms that dictate the broader, shorter peaks associated with finite-amplitude heaving is an avenue for future research efforts.
We note that connections to resonance have been argued for at higher Reynolds numbers as well. Quinn et al. (Reference Quinn, Lauder and Smits2014) identified peaks in thrust and efficiency at specific frequencies from experimental data at  $Re\sim O(10^{4})$, and used this to claim that resonance was a contributor to performance. Our results clarify that performance peaks in finite-amplitude swimming are indeed connected to resonant behaviour at lower Reynolds numbers. This observation indicates that performance peaks observed at higher Reynolds may also be related to resonance of the FSI system, although a global stability analysis at these higher Reynolds is necessary to make conclusive statements.
Despite these peaks near the resonant frequency, non-resonant behaviour was observed as well. For all stiffnesses considered, the input power exhibited a qualitatively different amplitude and phase response from the essentially linear dynamics at lower heave amplitudes. In addition, leading-edge separation (and associated vorticity generation) was present for the larger stiffness values,  $S=2,20$. These cases were associated with either marginal improvements (for
 $S=20$,
 $1.8\leqslant f\leqslant 2.4$) or substantial decreases (for
 $S=2,f\geqslant 2.4$) in efficiency. This is consistent with the observations of Quinn et al. (Reference Quinn, Lauder and Smits2015) that leading-edge separation was generally deleterious to efficiency. Quinn et al. (Reference Quinn, Lauder and Smits2015) used experiments at Reynolds numbers of
 $O(10^{3}{-}10^{4})$ to arrive at their conclusions, which suggests potential extensions of our conclusions at lower Reynolds numbers to higher Reynolds numbers.
We also note that leading-edge separation corresponded to an asymmetric wake. Zhu et al. (Reference Zhu, He and Zhang2014) did an extensive study of the parameters that led to asymmetric wake responses, and arrived at the conclusion that the wake circulation had to be above a threshold value for asymmetry to occur. Our studies suggest that sufficiently large leading-edge vorticity is another prerequisite.
Irrespective of the connections to resonance, the maximal mean thrust in large-amplitude swimming occurs at or very near the frequency for which the wake circulation is maximized. This was observed for all stiffnesses considered in this study, and is consistent with the observations of Moored et al. (Reference Moored, Dewey, Boschitsch, Smits and Haj-Hariri2014), who used a local linear analysis of the wake to demonstrate that performance gains were obtained by actuating at a frequency that maximally destabilized the wake. Moored et al. (Reference Moored, Dewey, Boschitsch, Smits and Haj-Hariri2014) considered experimental data of  $O(10^{4})$, which again indicate that there may be extensions of the conclusions drawn here for the moderate Reynolds number of 240 to higher Reynolds numbers.
Acknowledgements
The authors gratefully acknowledge funding from the Office of Naval Research (grant no. 00014-14-1-0533).
Declaration of interests
The authors report no conflict of interest.
Appendix A. Linear stability modes for a rigid stationary plate
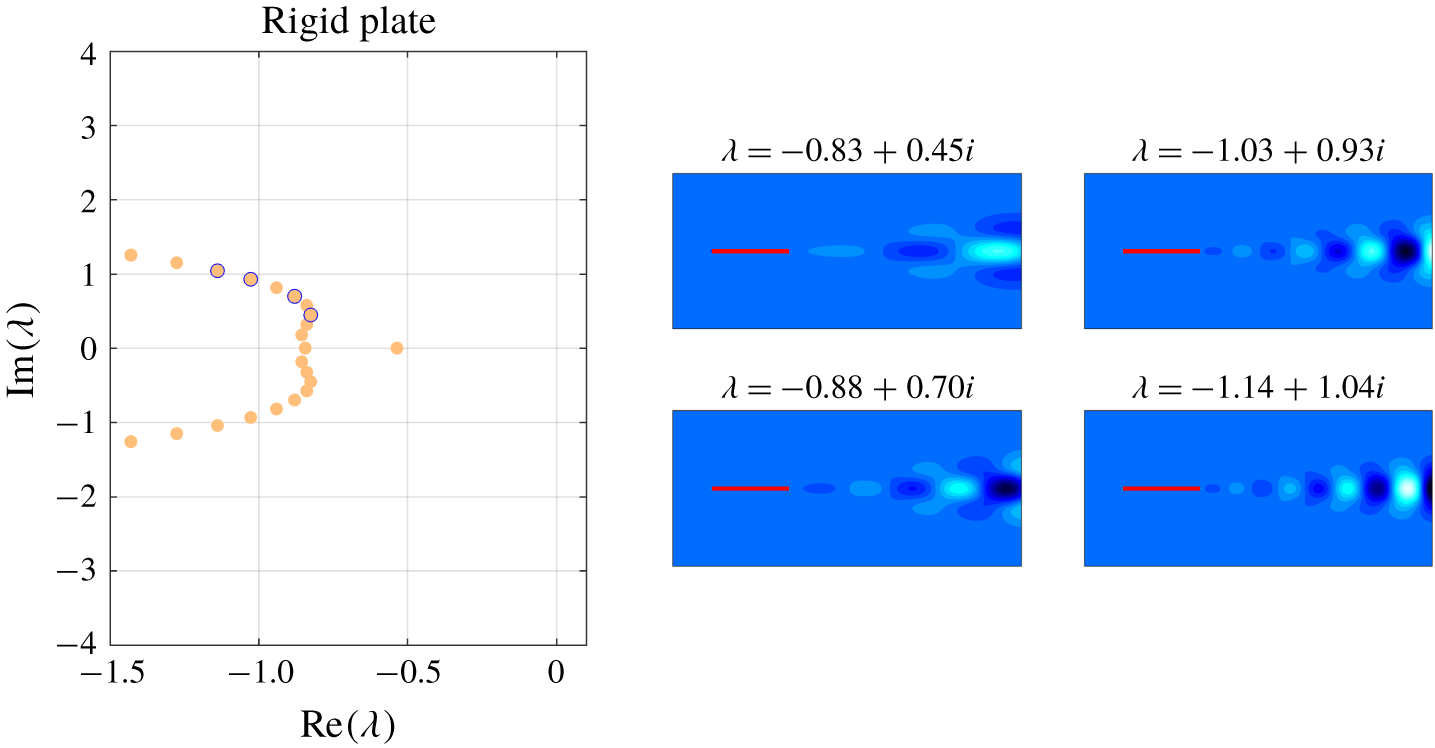
Figure 15 provides an analogue to figure 2 for a rigid, stationary plate (absent fluid–structure coupling). The eigenvalue locations and mode shapes of these rigid-body modes are similar compared with the FSI modes of low  $E_{r}$ values in figure 2. These observations suggest that the FSI modes with low
 $E_{r}$ values are wake instability modes that are not associated with significant fluid–structure interaction.
Left: eigenvalues associated with flow past a rigid stationary plate; i.e. without fluid–structure interaction. Note that all eigenvalues in the figure have corresponding eigenvectors with zero value of  $E_{r}$ since the plate is rigid. Middle and right: eigenvectors associated with the four circled eigenvalues plotted at a time instance during the response given by the real part of
 $\unicode[STIX]{x1D753}_{j}\text{e}^{\unicode[STIX]{x1D706}_{j}t}$. The eigenvectors are scaled to have unit 2-norm, and contours are plotted in 20 increments from
 $-0.05$ to 0.05.

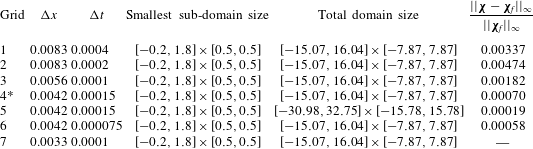
Simulation parameters for the grid convergence study. Grid 4 was used to obtain the data presented in the article.

Appendix B. Simulation parameters and grid convergence study
The flow equations are treated using a multidomain approach: the finest grid surrounds the body and grids of increasing coarseness are used at progressively larger distances (Colonius & Taira Reference Colonius and Taira2008). In all computations performed for this article, the domain size of the finest sub-domain is  $[-0.2,1.8]\times [-0.5,0.5]$ and the total domain size is
 $[-15.07,16.67]\times [-7.87,7.87]$. The grid spacing on the finest domain is
 $\unicode[STIX]{x0394}x=2/480\approx 0.0042$ and the grid spacing for the flag is
 $\unicode[STIX]{x0394}s=2\unicode[STIX]{x0394}x\approx 0.0083$. The time step is
 $\unicode[STIX]{x0394}t=0.00015$, which gives a maximum Courant–Friedrichs–Lewy number of approximately
 $0.2$.
The suitability of these parameters is demonstrated in this appendix for the case when  $S=20$,
 $f=3.2$ and
 $h_{0}=0.1$. Note that this is a strenuous test case, as this choice of parameters leads to one of the largest vorticity and plate accelerations of the physical parameters considered in this study. Table 3 contains details of the various grids used in this convergence study. The final column of the table provides the quantity
 $||\unicode[STIX]{x1D74C}-\unicode[STIX]{x1D74C}_{f}||_{\infty }/||\unicode[STIX]{x1D74C}_{f}||_{\infty }$, where
 $\unicode[STIX]{x1D74C}$ is the plate’s position computed on the grid associated with the current row at
 $t=30$ and
 $\unicode[STIX]{x1D74C}_{f}$ is the plate’s position computed on grid 7 at
 $t=30$. The position of the plate is well converged for all grids considered, which demonstrates that the chosen grid is adequate for the simulations used in this article.