1. Introduction
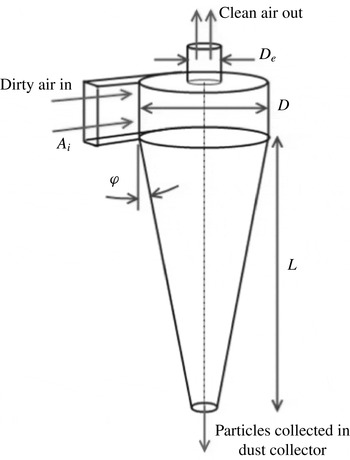
A cyclone separator is a flow device used to separate particles from a fluid by centrifugal forces in a rapidly swirling flow. Cyclone separators are typically cylindrical or conical and the swirling flow is generated by a tangential inlet. They can vary in size from large industrial machines to small devices incorporated into household vacuum cleaners. Figure 1 shows a typical configuration for a cyclone separator. Dirty air enters through the inlet with area
 $A_{i}$
, particles are separated into a collecting receptacle at the bottom of the cone, and clean fluid leaves via the outlet at the top (diameter
 $D_{e}$
).
Typical cyclone separator design with cylindrical and conical sections. This design has a tangential inlet to generate swirl with the outlet for clean fluid on the top.

Cyclones are known to generate narrow-band noise centred around one or more distinct frequencies. We will refer to the noise as cyclone hum. This hum is hypothesised to be a result of oscillations of the vortex core. For small cyclones this hum presents as unwanted noise, however in larger industrial units, the oscillations can lead to structural damage (Health and Safety Executive 2013). The aim of this paper is to characterise the hydrodynamic oscillations of a cyclone by using the acoustics as a proxy. This approach allows us to investigate both the acoustic and the hydrodynamic signatures of a cyclone separator for a wide range of flow and geometric parameters. While there have been many studies of the dynamic behaviour of the vortex core in cyclones, none of these have looked in detail at the acoustics that may result, or performed a detailed parametric study of the hydrodynamic fluctuations. The major focus of cyclone research is on performance in terms of the pressure drop and separation efficiency rather than noise (Hoffmann & Stein Reference Hoffmann and Stein2007).
Chanaud (Reference Chanaud1965) observed oscillation phenomena in a number of swirling flows, including a cyclone separator, and suggested that this behaviour derived energy from a hydrodynamic instability of the flow. The oscillation was characterised by a precession of the central vortex axis referred to as a precessing vortex core (PVC). Laser Doppler velocimetry (LDV) measurements on cyclones carried out by Yazdabadi, Griffiths & Syred (Reference Yazdabadi, Griffiths and Syred1994a ) and Solero & Coghe (Reference Solero and Coghe2002) have shown a time-dependent fluctuation in the velocity spectra. Using cyclically triggered measurements linked to the precession frequency, Yazdabadi et al. (Reference Yazdabadi, Griffiths and Syred1994a ) were able to build up the instantaneous spatial velocity distribution at a specific slice through the cycle. This showed that the centre of vorticity was displaced from the system centre. The frequency of the oscillation was found to vary with the flow rate through the device.
Peng et al. (Reference Peng, Hoffmann, Dries, Regelink and Stein2005) showed that deviations of the vortex core could lead to it deviating far enough so as to attach to the wall of the cyclone. This happened as a result of increasing the dust loading showing that this was a destabilising factor. High time resolution pressure transducers could measure the passage of the vortex core around the walls with the low pressure at the centre of vortex core producing a distinct pressure drop with each revolution, in addition to sound. The precession frequency of the vortex core in this case also varied with flow rate in a similar fashion.
Many studies have examined similar swirling flows with the phenomenon of a PVC. Dynamic behaviour of swirl burners has been extensively studied. The review of Syred (Reference Syred2006) examined various oscillation mechanisms in these combustion systems including similar PVC phenomena. The precession formed around the central region of axial flow reversal aids mixing in the flow. In such a device, the oscillation behaviour can have important effects on the combustion process and could couple with the thermo-acoustics of the system.
The oscillations of swirling jets without the forced flow reversal found in cyclone separators have also been studied in detail. Cassidy & Falvey (Reference Cassidy and Falvey1970) observed unsteady oscillations following vortex breakdown of a swirling jet. Non-dimensional frequency was found to be constant with Reynolds number, implying that the frequency increased linearly with flow rate through the device. Martinelli, Olivani & Coghe (Reference Martinelli, Olivani and Coghe2007) have studied free swirling jets using LDV techniques to measure the PVC frequency, showing a similar relationship with proportionality to flow rate.
In this paper, the governing non-dimensional groups driving hydrodynamic oscillations in a cyclone separator have been identified based on the geometry and flow parameters of the system (§ 2). In order to explore this parametric space, we found that it was convenient to use acoustics as a proxy for the hydrodynamic fluctuations. A clear coherence was found between the external acoustic field and the internal velocity fluctuations measured using a hot wire anemometer that was placed near the top of the cyclone at a radial location inside the vortex core (see § 4).
The use of acoustics simplifies the measurement requirements significantly. External microphones do not interfere with the internal flow and provide a quick way of measuring a wide range of different geometry and flow configurations. The details of the experimental set-up and the various geometric parameters studied in this paper are reported in the experimental method (§ 3). The results for the variation of cyclone hum as a function of the various parameters, along with an empirical and a physical model, follow in § 4. Finally we conclude (§ 5) with a brief summary and present the contributions of the paper and suggestions for future research.
2. Dimensional analysis
2.1. Initial dimensional analysis
The centre frequency of the acoustic hum
 $f$
generated by a cyclone separator could depend on the following fluid and geometric variables:
 $$\begin{eqnarray}f=F(Q,{\it\rho},{\it\mu},D,D_{e},A_{i},L,{\it\phi},c),\end{eqnarray}$$
where geometric parameters
 $D$
,
 $D_{e}$
,
 $A_{i}$
,
 $L$
and
 ${\it\phi}$
fix the shape and size of the cyclone and are defined in figure 1. The flow through the system is characterised by the volumetric flow rate
 $Q$
, density
 ${\it\rho}$
and dynamic viscosity
 ${\it\mu}$
,
 $c$
denotes the speed of sound. In (2.1) there are 10 dimensional variables and three physical units. From Buckingham’s Pi theorem, we expect seven non-dimensional groups. If we choose
 $Q$
,
 ${\it\rho}$
and
 $D$
as the governing parameters with independent dimensions, then the non-dimensional groups are given by:
 $$\begin{eqnarray}\frac{fD^{3}}{Q}=F\left(\frac{{\it\rho}Q}{{\it\mu}D},\frac{D_{e}}{D},\frac{A_{i}}{D^{2}},\frac{L}{D},{\it\phi},\frac{Q}{cD^{2}}\right).\end{eqnarray}$$
The resulting groups in (2.2) comprise a Strouhal number (
 $fD^{3}/Q$
) as a function of a Reynolds number (
 ${\it\rho}Q/{\it\mu}D$
) and Mach number (
 $Ma=Q/cD^{2}$
) with numerous shape parameters defining the geometry of the conical and cylindrical sections of a cyclone separator following the design in figure 1. The Strouhal number is equivalent to the non-dimensional frequency parameter used in measurements by Cassidy & Falvey (Reference Cassidy and Falvey1970) and Yazdabadi, Griffiths & Syred (Reference Yazdabadi, Griffiths and Syred1994b
).
2.2. Derivation of swirl number
The inlet and outlet of the cyclone have significant control over the resulting internal flow. Changing the inlet size affects the amount of swirl momentum introduced to the flow and the outlet controls the extent of the central vortex core and the axial velocity.
Suitable scaling for the velocity can be determined by using the vorticity equation for incompressible flow:
 $$\begin{eqnarray}\frac{\partial \underline{{\bf\omega}}}{\partial t}+\underline{\boldsymbol{u}}\boldsymbol{\cdot }\boldsymbol{{\rm\nabla}}\underline{{\bf\omega}}={\it\nu}{\rm\nabla}^{2}\underline{{\bf\omega}}+\underline{{\bf\omega}}\boldsymbol{\cdot }\boldsymbol{{\rm\nabla}}\underline{\boldsymbol{u}},\end{eqnarray}$$
where
 $\underline{{\bf\omega}}=\boldsymbol{{\rm\nabla}}\times \underline{\boldsymbol{u}}$
represents the vorticity in the flow field whose primary component comes from the tangential velocity
 $U_{{\it\theta}}$
.
We chose the reference vorticity as the frequency
 ${\it\Omega}$
of the central vortex core modelled by solid body rotation, the reference length scale as
 $D_{e}$
and the velocity scale as
 $U_{x}$
. The relevant time scale of the swirling motion is given by
 ${\it\Omega}^{-1}$
, and these reference scales give the non-dimensional form of the vorticity equation:
 $$\begin{eqnarray}\frac{\partial \hat{\underline{{\bf\omega}}}}{\partial \hat{t}}+\frac{U_{x}}{{\it\Omega}D_{e}}\hat{\underline{\boldsymbol{u}}}\boldsymbol{\cdot }\hat{\boldsymbol{{\rm\nabla}}}\hat{\underline{{\bf\omega}}}=\frac{{\it\nu}}{{\it\Omega}L^{2}}\hat{{\rm\nabla}}^{2}\hat{\underline{{\bf\omega}}}+\frac{U_{x}}{{\it\Omega}D_{e}}\hat{\underline{{\bf\omega}}}\boldsymbol{\cdot }\hat{\boldsymbol{{\rm\nabla}}}\underline{\hat{\boldsymbol{u}}},\end{eqnarray}$$
where
 $\hat{\,}$
denotes non-dimensional quantities. Equation (2.4) can be written as:
 $$\begin{eqnarray}\frac{\partial \hat{\underline{{\bf\omega}}}}{\partial \hat{t}}+\frac{1}{Sw}\left(\hat{\underline{\boldsymbol{u}}}\boldsymbol{\cdot }\hat{\boldsymbol{{\rm\nabla}}}\hat{\underline{{\bf\omega}}}-\hat{\underline{{\bf\omega}}}\boldsymbol{\cdot }\hat{\boldsymbol{{\rm\nabla}}}\underline{\hat{\boldsymbol{u}}}\right)=\frac{1}{ReSw}\hat{{\rm\nabla}}^{2}\hat{\underline{{\bf\omega}}}.\end{eqnarray}$$
The two non-dimensional groups that result are the ratio of typical swirl to axial velocity scales,
 $Sw\equiv {\it\Omega}D_{e}/U_{x}$
, known as the swirl number and the axial Reynolds number,
 $\mathit{Re}=U_{x}D_{e}/{\it\nu}$
. These numbers respectively describe the relative importance of swirling flow compared to the axial flow, and the importance of viscous forces compared to the inertial forces within the vortex core.
For the case of a cyclone separator considered in this paper, the Reynolds number is typically large, of the order of
 $10^{4}$
. This leaves the swirl number (the inverse of the Rossby number) as the determining group for a cyclone flow. The swirl number is often used instead of the Rossby number for cyclonic flows.
A geometry based swirl number can be defined by considering the swirl momentum at the inlet and the axial momentum at the outlet and characterising these based on the scales of the cyclone. At the inlet the mean axial flow speed is given by
 $Q/A_{i}$
. At the outlet, we assume that the axial velocity has uniform value
 $U_{x}$
and the flow is undergoing solid body rotation with angular frequency
 ${\it\Omega}$
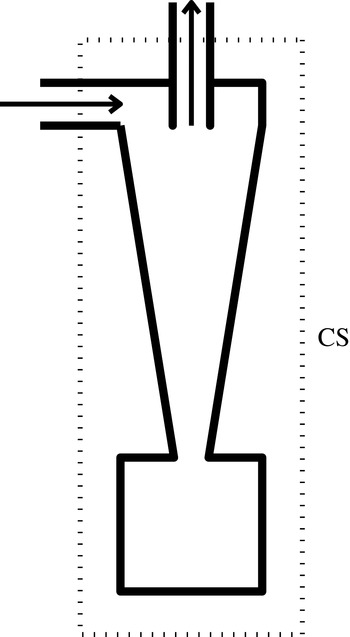
. Considering a control surface (CS) around the cyclone separator, as shown by the dashed lines in figure 2, and neglecting unsteady effects, frictional and external forces, the conservation of angular momentum across the CS in the axial direction can be written as:
 $$\begin{eqnarray}{\dot{m}}_{in}\frac{QD}{A_{i}}\sim {\dot{m}}_{out}{\it\Omega}{D_{e}}^{2},\end{eqnarray}$$
where
 ${\dot{m}}_{in}$
and
 ${\dot{m}}_{out}$
represent mass flow rate at the inlet and outlet respectively. From conservation of mass, these must be equal. Neglecting the variation of density between inlet and outlet:
 $$\begin{eqnarray}Q\sim U_{x}{D_{e}}^{2},\end{eqnarray}$$
i.e. volumetric flow rate going in is the same as that going out. Combining (2.6) and (2.7) yields a geometric swirl number:
 $$\begin{eqnarray}Sw=\frac{DD_{e}}{A_{i}}.\end{eqnarray}$$
This swirl number group can replace the non-dimensional inlet area in (2.2) as this is an independent group made from a combination of
 $D_{e}/D$
and
 $A_{i}/D^{2}$
. The derivation is based on the work of Gupta, Lilley & Syred (Reference Gupta, Lilley and Syred1984) and has been used in many studies of swirling flows, including the work of Yazdabadi et al. (Reference Yazdabadi, Griffiths and Syred1994a
) and Martinelli et al. (Reference Martinelli, Olivani and Coghe2007).
Control surface (CS) around cyclone separator for consideration of angular momentum balance.

2.3. Strouhal number based on cyclone core
Initial observations of the cyclone hum behaviour did not lead to a good collapse of data for Strouhal number using the parameters of (2.2). Hot wire measurements of the hydrodynamic oscillations and visualisation of the cyclone flow suggested that the oscillation was strictly limited to the vortex core. The Strouhal number used by Gupta et al. (Reference Gupta, Lilley and Syred1984) to characterise PVC phenomena was based on the exit duct rather than cyclone diameter. Based on this, and using the characteristic length and velocity scales of the core region, we can redefine the Strouhal number as follows:
 $$\begin{eqnarray}\frac{fD_{e}}{U_{{\it\theta}}}\sim \frac{f{D_{e}}^{2}A_{i}}{QD}=\frac{f{D_{e}}^{3}}{QSw}.\end{eqnarray}$$
Combining the results of the swirl number (2.8) and Strouhal number (2.9) conversions into the initial analysis in (2.2) provides a new non-dimensional relationship for the cyclone:
 $$\begin{eqnarray}\displaystyle & \displaystyle \frac{f{D_{e}}^{3}}{QSw}=F\left(\frac{{\it\rho}Q}{{\it\mu}D_{e}},\frac{D}{D_{e}},\frac{DD_{e}}{A_{i}},\frac{L}{D_{e}},{\it\phi},\frac{Q}{c{D_{e}}^{2}}\right), & \displaystyle\end{eqnarray}$$
 $$\begin{eqnarray}\displaystyle & \displaystyle St=F\left(Re,\frac{D}{D_{e}},Sw,\frac{L}{D_{e}},{\it\phi},Ma\right). & \displaystyle\end{eqnarray}$$
3. Experimental method
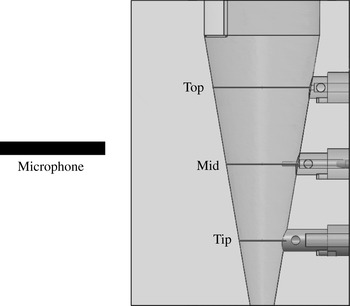
To confirm a connection between internal flow fluctuations and external acoustics, an experiment was designed to simultaneously measure the two fields. Figure 3 shows the design of a cyclone bored into a solid Perspex block. A microphone positioned outside the rig was used to detect the cyclone hum while a hot wire anemometer was used to measure fluctuations in velocity. The hot wire could be traversed radially at one of three axial stations, as labelled in figure 3, in order to detect spatial variations in the oscillations.
Hot wire rig layout showing cyclone cone bored into a solid Perspex block. The radial traverse positions are shown spanning the diameter of the cyclone at three axial stations inside the cyclone: top, mid and tip.

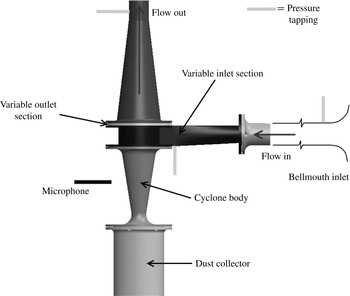
Another cyclone rig shown in figure 4 was designed to be modular to enable variations in inlet and outlet areas. This allowed variation of
 $D/D_{e}$
and swirl number by changing both inlet area and outlet diameter independently. The components were rapid prototyped in plastic for easy manufacture. These geometry changes were not possible with the solid Perspex rig, hence the use of a different design. The two rigs had different acoustic properties, however the cyclone hum was easily detected in both cases.
Schematic of acoustic rig and air flow.

The cyclone was set up inside a hemi-anechoic chamber to provide a controlled environment for noise measurement. The chamber cutoff frequency was 250 Hz. This is well below the frequencies of interest in the experiment. Suction was supplied by a compressor far downstream of the rig to isolate this noise source from the experiment. In addition a silencer was added along the exhaust duct to further reduce external noise.
The inlet air was ducted from outside of the chamber. The inlet comprised a bell-mouth flow meter designed in accordance with ISO 5801, to facilitate volumetric flow rate measurement. The airflow system and microphone set-up is detailed in figure 4 with the microphone and pressure tapping locations around the cyclone shown. The sealed dust collector of the device was lined with foam to prevent any acoustic resonances of this cavity as these typically coincided with the cyclone hum frequency.
An array of microphones was set up in a 1.5 m diameter hemisphere centred on the cyclone rig. In addition, a further microphone was set up 5 cm from the side of the main cone to make close up measurements. The microphones used were Linear X M51. These have a measurement frequency range from 10 Hz to 40 kHz. The cyclone hum frequencies are well within this range.
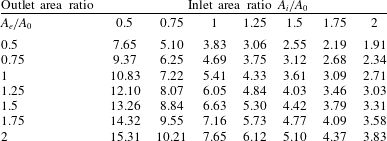
Acoustic measurements were taken with the array of microphones on all combinations of inlet and outlet geometry. Table 1 describes the swirl number of each configuration as a function of its inlet and outlet areas. Seven sizes of inlet and outlet area were used representing 49 variations in swirl number. An area of
 $A_{0}$
at the outlet corresponds to an outlet diameter ratio of
 $D_{e}/D=0.23$
. The experiment was operated with the same cone dimensions throughout of
 $L/D_{e}=11.5$
and
 ${\it\phi}=9^{\circ }$
. Multiple flow rates were used for each test set-up to determine the effects of varying Reynolds number. Measurements were taken at a sampling frequency of 30 kHz for a duration of 30 s.
Swirl number evaluated for the range of inlet and outlet areas. All inlet and outlet geometry is scaled relative to a reference area
 $A_{0}$
and quoted as a ratio of this value.

Cyclone hum frequency was identified from the spectra of each measurement in order to determine a non-dimensional formulation with which to characterise the sound across the range of cyclone geometries. Identification of the cyclone hum relied on the variation of flow rate. This allowed the flow-dependent spectral features to be distinguished from other noise peaks.
4. Results and discussion
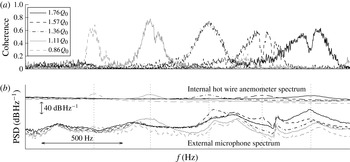
Figure 5(b) shows the comparison between external acoustics and internal velocity measurements using the hot wire anemometer at various flow rates. There are clear peaks in both spectra that vary with flow rate. The coherence between the two sets of spectra are shown in figure 5(a). The coherence (
 $C_{xy}(f)$
) is defined based on the cross-spectral (
 $G_{xy}(f)$
) and auto-spectral densities (
 $G_{xx}(f),G_{yy}(f)$
) of the two signals
 $x$
and
 $y$
respectively as:
 $$\begin{eqnarray}C_{xy}(f)=\frac{|G_{xy}(f)|^{2}}{G_{xx}(f)G_{yy}(f)}.\end{eqnarray}$$
Coherence (a) and comparison of the internal hot wire anemometer and external microphone spectra (b) at five different flow rates. The spectra show matching peaks corresponding to the frequencies of interest. Each frequency also displays high coherence between the two measurements. Similar coherence was found for all the cases reported in this paper.

The cyclone hum frequencies registered by the external microphones are represented by dotted vertical lines in figure 5(b) overlaid on the power spectral density (PSD) from each flow rate. These align well with the frequency humps in the hot wire measurement and the peaks in coherence values in figure 5(a). This suggests that the acoustic hum is a good proxy for the hydrodynamic oscillations inside the cyclone.
The hot wire measurement shown in figure 5 is taken at the top axial station. The oscillations shown are only observed close to the centre (core) of the cyclone. This indicates that the oscillations are confined in a narrow region around the cyclone core. Narrow-band hydrodynamic oscillations can also be detected, at much lower amplitudes, at the other axial stations in the hot wire measurement rig. The frequency of these fluctuations also varied with flow rate, but did not align well with the frequency of cyclone hum.
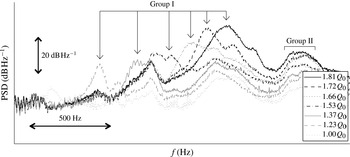
Figure 6 shows a typical power spectral density plot for the various flow rates tested on a single configuration of the rig. This configuration corresponds to an inlet and outlet area of
 $1.25A_{0}$
and swirl number of
 $4.84$
. There are two sets of humps that are evident from the spectra. One (group I) for when the centre frequencies increase with increasing flow rate, the other (group II) for when it remains roughly constant.
Power spectral density for multiple flow rates through a typical rig assembly.

The latter correspond to constant Helmholtz numbers and are a product of an acoustic resonance within the geometry of the cyclone. The group I centre frequencies represent cyclone hums. When the hum coincides with one of the fixed peaks in group II, they are amplified because of acoustic resonance. Note that the humps in group II do not correspond to cyclone hum as they are not linked with the hydrodynamic fluctuations inside the cyclone. This can be seen from the lack of coherence between the frequencies corresponding to group II humps between the hot wire inside and the microphone outside the cyclone (see figure 5).
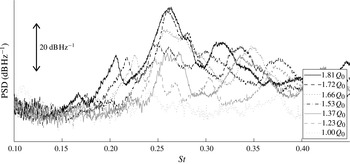
Non-dimensional power spectral density for multiple flow rates through a typical rig assembly.

Converting these results into the non-dimensional groups shows that the Strouhal numbers for the centre frequencies remain approximately constant for a fixed geometry (figure 7). This implies that the centre frequency of the hum is related linearly to volumetric flow rate. This is further seen by examining the Strouhal number against Reynolds number for any particular rig configuration (table 2). This is consistent with frequency measurements of cyclone oscillations in the literature (Solero & Coghe Reference Solero and Coghe2002; Peng et al.
Reference Peng, Hoffmann, Dries, Regelink and Stein2005). There is a slight drop in
 $St$
at lower
 $\mathit{Re}$
, but this effect is small. The hum asymptotes to a constant
 $St$
at high
 $\mathit{Re}$
as observed by Yazdabadi et al. (Reference Yazdabadi, Griffiths and Syred1994b
).
Strouhal numbers measured for a range of different Reynolds numbers on a single cyclone configuration.

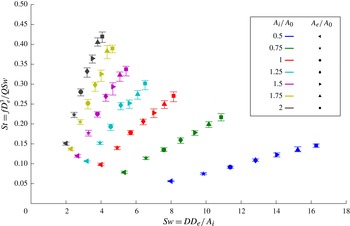
Across the range of swirl numbers tested, the distinct cyclone hum was detected in each case. The Strouhal numbers for each rig configuration and swirl number can be seen in figure 8 based on the inlet and outlet area ratios outlined in table 1. This variation of inlet and outlet areas allowed the parameter space of both swirl number and inlet to outlet area ratio to be investigated. The swirl numbers in this experiment were typically all large and therefore precessing vortex oscillations were expected in all cases according to accumulated results in the review of Cortes & Gil (Reference Cortes and Gil2007).
Strouhal number versus swirl number for all rig configurations. Error bars indicate the range of Strouhal numbers measured for different flow rates in each.

The colours in figure 8 represent the different inlet areas tested, whereas the symbols denote the different outlet areas. For a fixed inlet area, increasing the swirl number by using a larger outlet area produces an almost linear increase in Strouhal number. With a constant outlet area, increasing the swirl number using a smaller inlet area results in a reduction in Strouhal number.
Each configuration was tested for a range of Reynolds numbers, which leads to a small variation in Strouhal number as seen in table 2. The error bars overlaid on each symbol in figure 8 show the range of Reynolds number variation, with the symbol positioned at the mean value. In all cases this is a small contribution and suggests that the Strouhal number is only weakly dependent on the Reynolds number. The non-dimensional frequency measurements of Yazdabadi et al. (Reference Yazdabadi, Griffiths and Syred1994b ) for changing Reynolds number show the same behaviour, where the Reynolds variation is only significant at extreme ranges of very low flow rates and low swirl numbers.
The figures in this paper have been presented in non-dimensional form. In order to recreate the results, one would have to pick a particular dimension for the cyclone, say the outer diameter
 $D$
, keeping all other ratios the same as reported in our paper. This would result in the same non-dimensional results presented in figure 8. For figure 6, one would obtain a spectrum of SPL (in
 $\text{dB}~\text{Hz}^{-1}$
) versus frequency (in Hz). In order to compare against our results, one would only need to do a linear translation of the results (in both frequency and amplitude) and identify and isolate the flow rate dependent features within the spectrum. This should ensure repeatability of all the results.
Dimensional analysis alone would not give us the dependence of Strouhal number as a function of Reynolds and swirl numbers without further information of the physical source and mechanisms involved in the oscillation. However empirical analysis was carried out to explore a relationship for Strouhal number based on the parametric data.
For a given shape of cyclone, it can be seen from (2.11) that the Strouhal number depends mainly on
 $D/D_{e}$
and
 $Sw$
(the
 $Re$
dependence is weak). Numerous powers of
 $D/D_{e}$
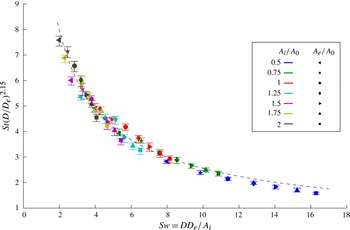
were tested to find the optimum collapse of data. It was found to be 2.15. By using this observation, the two variables determining the Strouhal number could be independently fitted to produce a model for the dependency. Figure 9 shows all the data points for the modified Strouhal number,
 $St(D/D_{e})^{2.15}$
, plotted against the swirl number. The collapse of all 343 data points is remarkable.
Strouhal number collapse with the fitted curve model (dashed line) from (4.2).

The best-fit curve through the data points, obtained by least-squares regression (correlation coefficient 0.979), has the form:
 $$\begin{eqnarray}St\propto \;Sw^{-0.71}\left(\frac{D_{e}}{D}\right)^{2.15}.\end{eqnarray}$$
This collapse shows that the swirl number and outlet diameter ratio groups have dynamic importance in determining the cyclone oscillation frequency and provide a simple empirical model for prediction.
Equation 4.2 shows that the level of confinement of the central vortex core is also a factor in the determination of oscillation frequency. It was shown in the review of Syred (Reference Syred2006) that the level of confinement in a swirl burner device affected the region of reverse flow, upon which the precessing vortex is dependent.
4.1. A simple model
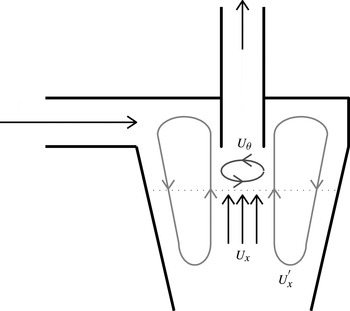
The inclusion of a swirl number dependence in (4.2) shows that the frequency is affected by the interplay of azimuthal and axial velocities. Characteristic recirculating motions can be defined for two flow directions (figure 10). The azimuthal flow around the axis of the cyclone has a typical length scale of
 $D_{e}$
and velocity
 $U_{{\it\theta}}$
in the core of the vortex. The axial recirculation can be characterised by the region outside of the core with length scale
 $D$
and velocity
 $U_{x}^{\prime }$
.
Characteristic axial and azimuthal recirculation patterns.

A characteristic frequency can be defined for each of these recirculating motions. The frequency for the axial motion scales as:
 $$\begin{eqnarray}f_{x}\sim \frac{U_{x}^{\prime }}{D}.\end{eqnarray}$$
For mass conservation, the net mass flow at any internal cross-section, such as that shown by a dotted line in figure 10, of the cyclone must be zero. Therefore
 $U_{x}^{\prime }(D^{2}-{D_{e}}^{2})\sim U_{x}{D_{e}}^{2}$
, where
 $U_{x}$
is the axial velocity scale in the core of the cyclone. If it is assumed that
 $D_{e}\ll D$
(as is the case for the cyclone studied in this work), then
 $$\begin{eqnarray}\frac{U_{x}^{\prime }}{U_{x}}\sim \frac{{D_{e}}^{2}}{D^{2}}.\end{eqnarray}$$
From (4.3) and (4.4), the characteristic axial motion results in a Strouhal number that scales as:
 $$\begin{eqnarray}St_{x}=\frac{f_{x}D_{e}}{U_{{\it\theta}}}\sim \frac{U_{x}}{U_{{\it\theta}}}\left(\frac{D_{e}}{D}\right)^{3}\sim Sw^{-1}\left(\frac{D_{e}}{D}\right)^{3}.\end{eqnarray}$$
The frequency imposed by the azimuthal motions scales as
 $f_{{\it\theta}}\sim U_{{\it\theta}}/D_{e}$
. Therefore the Strouhal number for this motions scales as:
 $$\begin{eqnarray}St_{{\it\theta}}=\frac{f_{{\it\theta}}D_{e}}{U_{{\it\theta}}}\sim 1=Sw^{0}\left(\frac{D_{e}}{D}\right)^{0}.\end{eqnarray}$$
The scalings
 $St_{x}$
and
 $St_{{\it\theta}}$
can be thought of as the limiting value of the Strouhal number as
 $Sw$
tends to 0 and
 $\infty$
, respectively. This is because as
 $Sw\rightarrow 0$
, the axial flow dominates and the azimuthal flow is negligible. The situation is reversed as
 $Sw\rightarrow \infty$
. It is observed that the swirl and diameter ratio dependence of the experimental results (4.2) lies between the two cases defined by axial and azimuthal recirculation. The overall frequency (or Strouhal number) can then be thought of as some sort of average of the axial and azimuthal frequencies.
If we consider a weighted geometric average of the form
 $St={St_{{\it\theta}}}^{1-p}{St_{x}}^{p}$
, then it is clear that for
 $p=0.71$
, we obtain
 $St\sim Sw^{-0.71}\left(D_{e}/D\right)^{2.15}$
. This expression is the desired dependence obtained by the curve fit results in (4.2). Using this simple model of two recirculating motions shows that the interaction between axial and azimuthal recirculation in a given design of cyclone is the determining factor for the oscillations of the flow and also the noise generated.
4.2. Experimental uncertainty
The primary source of uncertainty within the experiment was the measure of the volumetric flow rate through pressure measurement. During a 30 s measurement, the flow rate did not remain completely constant. This was most pronounced at higher flow rates. Estimates were made of the variation in inlet pressure measurement and atmospheric conditions and the effect these had on the values of Strouhal number. The errors bars on figure 8 represent the range of Strouhal numbers measured across all flows rates tested and the additional uncertainty from pressure measurement. The frequency determination from PSD was carried out systematically using the maximum magnitude in the frequency domain. All dimensions in the system were machined and measured accurately, leaving negligible uncertainty in the swirl number or other geometry based parameters.
Before each rig configuration was run, the apparatus was rigorously sealed and checked for any leaks to ensure no flow could bypass the volumetric flow measurement or change the dynamics of the system.
5. Conclusions
The key findings of the paper are:
-
(i) There is a clear link between the hydrodynamic fluctuations of the vortex core and the acoustic field produced by the cyclone separator.
-
(ii) Cyclones produce a narrow-band noise, called cyclone hum, that varies with flow rate.
-
(iii) The hypothesis that the cyclone hum is a result of internal hydrodynamic oscillations has been verified with direct measurements of velocity fluctuations inside the cyclone correlated to the acoustic noise. The correlation was only observed near the top of the cyclone close to the vortex core.
-
(iv) The key non-dimensional parameters governing the dynamics of the hydrodynamic fluctuations have been identified.
-
(v) The key scales for the flow were chosen to be the diameter of the vortex core and the swirling velocity in this region. This was used to define a Strouhal number based on these parameters.
-
(vi) The Strouhal number measured from experiments collapsed onto a single curve using power law relations of the geometric swirl number and diameter ratio of the cyclone. This could be used as a prediction model for similarly designed cyclones.
-
(vii) A physical model of the flow oscillations is proposed by considering a combination of axial and azimuthal recirculation of the flow inside the cyclone. These two motions have different dependencies on the geometric parameters, but a weighted geometric average of the two results in the exact functional dependence derived from experiment.
In this analysis it has been assumed that
 $D_{e}\ll D$
(
 $D_{e}<0.33D$
is representative of cyclones used in domestic vacuum cleaners). Based on our physical model, we expect that the empirical result of (4.2) would no longer hold for larger outlets. Variations in cone geometry could also have significant impact on the axial recirculation of the flow. Variations in
 $L$
and
 ${\it\phi}$
have not been considered in this work. These would likely have an impact on the effective length scale for axial recirculation and hence affect the hum frequency scaling.
The relationship between Strouhal number and cyclone geometry has presented a method of predicting the occurrence of cyclone hum and could be employed to reduce noise in vacuum cleaners and prevent damage from vibration in industrial cyclones. For example, this could be achieved by ensuring that the oscillation frequency does not coincide with any of the acoustic resonant modes.
The acoustic method used could easily be applied to other swirling systems such as swirl combustors and unconfined vortex flows. It offers a way to measure the swirling flow without directly probing inside of the system by taking advantage of inherent instabilities. This means that the structure of the flow could remain undisturbed by instrumentation and would also provide a method of studying the internal dynamics of flows that are too hazardous or impossible to measure directly.
Acknowledgements
We gratefully acknowledge Dyson Ltd. for funding this project. We are grateful to Frederic Nicolas’ group at Dyson for their generous technical and administrative support. We would also like to thank J. Lamb from Dyson and A. Dowling from Cambridge for many useful discussions, and J. Hazlewood for his help with setting up and manufacturing the experimental rig.