Introduction
In the most recent (2008) US Department of Agriculture (USDA) statistics on organic agriculture, land under certified organic production increased to 1.9 million ha1, with 78,767 ha of organic corn (Zea mays L.), 50,837 ha of organic soybean [Glycine max (L.) Merr.] and 66,380 ha of organic vegetable crops. Consumer demand continues to drive the organic industry due to individual preferences for lower pesticide residues in foodReference Baker, Benbrook, Groth and Benbrook2 and consistent federal standards for products marketed as ‘organic’3. At the heart of organic regulations is the protection or enhancement of carbon (C) and other nutrients in soil organic matter, which maintains soil fertility and soil structure in sustainable systemsReference Manley, Feller and Swift4. In order to enter the expanding organic market and meet certified organic requirements, producers must implement a soil-building plan in accordance with sections 205.203 and 205.205 of the USDA National Organic Program (NOP), Agriculture Marketing Service3. Although weeds in organic systems are managed through a multi-pronged approach that includes cultural, biological and mechanical methods, currently, organic producers primarily rely on C-intensive tillage systems for weed management and field preparation. Increased use of strategies that enhance or sequester soil C on organic farms, such as reduced or no-tillage systems, will lead to decreased erosion and facilitate participation in government programs supporting reductions in C emissions. Some of the most critical needs of transitioning and certified organic growers are methods for enhancing soil fertility and managing weedsReference Delate and DeWitt5, Reference Reimens, Groeneveld, Lotz and Kropff6. The potentially negative effects of mechanical tillage on soil C can be mitigated by C additions from crop residues, cover crops and compostReference Delate and Cambardella7, but organic farmers also have expressed interest in reducing tillage operationsReference Sooby, Landeck and Lipson8. Although plastic mulch is allowed in certified organic vegetable systems for weed management, many organic and conventional vegetable farmers are seeking alternatives to plastic mulch, which is expensive, difficult to dispose of and may have negative impacts on soil microbial activityReference Rogers, Little, Silcock and Williams9. Natural mulches, including crushed and desiccated cover crops, have been proposed as an option in organic weed management. The most common cover crops planted in organic systems have included single species or combinations of rye (Secale cereale L.), barley (Hordeum vulgare L.), wheat (Triticum vulgare L.), hairy vetch (Vicia villosa Roth) and crimson clover (Trifolium incarnatum L.), due to their quick establishment, ability to over-winter, competitiveness with weeds and ease of termination using mechanical methodsReference Creamer and Bennett10, Reference Nelson, Kahn and Roberts11. The cover crop combination of winter rye and hairy vetch offers great potential for enhancing crop yields and soil quality. Benefits ascribed to winter rye include C acquisition through biomass accumulation, residual soil nitrogen (N) scavenging and reduced nitrate leachingReference Feyereisen, Wilson, Sands, Strock and Porter12, Reference Snapp, Swinton, Labarta, Mutch, Black, Leep, Nyiraneza and O'Neil13. In addition, increased weed management from rye cover crops can be obtained through physical interference, antagonism and allelopathyReference Ngouajio and McGiffen14, Reference Teasdale and Mohler15. Hairy vetch is considered an excellent cover crop in terms of biomass production, providing some degree of weed suppression and N supplementation up to 138 kg N ha−1Reference Brandsæter and Netland16–Reference Teasdale, Beste and Potts18.
Cover crop termination methods utilizing reduced tillage approaches offer the greatest potential for the dual purpose of weed management and enhancement of soil quality, as demonstrated by many conventional no-till studiesReference Ismail, Blevins and Frye19, Reference Karlen, Wollenhaupt, Erbach, Berry, Swan, Eash and Jordahl20. Despite soil quality enhancement, however, grain crop yields are often equivalent or inferior in no-till systems; results from over 80 studies involving barley, corn, soybean, wheat and other grain crops failed to reveal a consistent yield advantage for no-till compared with tilled systemsReference Franzluebbers, Magdoff and Weil21. In semi-arid portions of the North Central region, however, crop performance has been shown to improve by eliminating tillage, due to the proposed more efficient plant water useReference Carr, Martin and Horsley22–Reference Tanaka, Krupinsky, Liebig, Merrill, Ries, Hendrickson, Johnson and Hanson24. In comparisons between organic and conventional no-tillage systems, Miller et al.Reference Miller, Buschena, Jones and Holmes25 found equal or greater winter wheat yields in an organic system compared to a conventional, no-tillage cropping system in a 4-year study. No-till vegetable systems have also produced mixed results. In a review of no-till vegetable systems by Rogers et al.Reference Rogers, Little, Silcock and Williams9, increased yields over tilled systems were determined in 10 out of 16 comparisons. Despite inconsistent yield advantages, planting small grains and N-fixing cover crops together may be an effective management strategy to simultaneously increase soil C and optimize the soil N cycling processes, thereby reducing leaching loss of N.
While typical methods for terminating cover crops in organic systems can include mowing, roll-chopping, undercutting and roto-tillingReference Carrera, Abdul-Baki and Teasdale26, the rolling or rolling/crimping system recently has been promoted for optimum termination and mulch layering. Steel rollers with blunt blades welded onto cylindrical drums have been used to terminate cover crops in conservation tillage systems for many years in South AmericaReference Ashford and Reeves27, but the roller/crimper designed by The Rodale Institute (Kutztown, Pennsylvania, USA) in 2002 consists of steel blades welded on a large steel cylinder in a chevron pattern to facilitate a crimping motion to more effectively terminate fall-planted cover crops in the following springReference Sayre28. Prior to cover-crop termination, the roller/crimper is filled with water to provide an additional 907 kg to aid in mechanical termination, with the goal of creating a dense cover-crop mulch capable of suppressing weeds and eliminating additional weed control throughout the season. In contrast to mowing, the roller/crimper is a more controlled operation, typically resulting in a more flattened, uniform mulch layer amenable to no-tillage planting equipment. Grain and vegetable seeds or transplants are planted simultaneously or in another pass into the flattened cover crop, using no-till drilling of seeds, high-residue transplanters, or hand-transplanting. The ability to mount the roller/crimper on the front of the tractor so that cover crop termination and no-till seeding of the subsequent crop can occur in a single pass has led to successful production of corn, soybean, tomatoes, pumpkins (Cucurbita pepo L.) and strawberries (Fragaria×ananassa) in Pennsylvania using the Rodale roller/crimperReference Sayre28.
The objective of the present experiment was to compare: (1) the effects of an organic no-tillage system using a roller/crimper and two cover crop combinations (hairy vetch/rye and winter wheat/Austrian winter pea) with a tilled organic system on corn, soybean and irrigated tomato plant growth, pest (weeds, insects and disease) management and yield; and (2) the economic performance of the organic no-tillage system to the tilled organic system. This systems research was conducted on a certified organic site at an Iowa State University research farm to demonstrate the feasibility of these techniques to meet certified organic regulations.
Materials and Methods
A site at the Iowa State University Neely-Kinyon Farm in Greenfield, Iowa, was selected for this experiment, where the predominant soil was a moderately well-drained Macksburg silty clay loam (fine, smectitic, mesic Aquic Argiudolls) with a uniform slope of 0–2%. All operations and inputs were in compliance with organic regulations3, and the Iowa Department of Agriculture and Land Stewardship (Des Moines, Iowa) certified the site as organic. Prior to this experiment, no research on organic no-tillage production had occurred in Iowa. Individual plots measuring 6×33.5 m (corn and soybean) or 1×1.2 m (tomato) were laid out in a randomized complete block design of three treatments with three replications in three separate areas of the farm in fall 2005 and 2006. The treatments in this systems experiment: (1) tilled, with tillage used before and after commercial crop planting; (2) no-tillage cover crop combination of winter wheat (‘Expedition’ in 2005 and ‘Arapahoe’ in 2006, Albert Lea Seed House, Albert Lea, Minnesota, USA) (63 kg ha−1) and Austrian winter pea (Pisum sativum L. ssp. arvense (L.) Poir.) (21 kg ha−1); and (3) no-tillage cover crop combination of rye (VNS) (72 kg ha−1) and hairy vetch (VNS; Albert Lea Seed House) (36 kg ha−1) were established in each crop section. The no-tillage experiment was established in a new site on the farm each year with an intercrop of organic oats (Avena sativa L.) and alfalfa (Medicago sativa L.) as the previous crop in the rotation for all fields in both years. Following the experiment each year, fields were left with cover crop and commercial crop residue during the winter, and the typical Neely-Kinyon Farm crop rotation (corn to soybeans; soybeans to oats/alfalfa; tomatoes to corn) was followed the next spring, but this rotation was not part of the experiment described herein. Field operations and data collections were conducted at approximately the same time each year, or as close to the same date as weather permitted.
Field operations
Cover crops were planted with a no-till drill (John Deere, Ankeny, Iowa, USA) in no-tillage plots in fall 2005 (September 12) and 2006 (October 31, due to a wet fall). In spring, one disking operation and one field cultivation were conducted in the tilled treatment plots 3 weeks prior to cover-crop termination in no-tillage plots, with an additional field cultivation the day before planting. The cover crops in no-tillage plots were crushed with a roller/crimper implement (3.2 m wide×41 cm diameter) mounted on a tractor in late May of both years. All cover crop plots were rolled/crimped in one direction, with no roller overlap between passes. In the smaller tomato plots, the same rolling technique was used, with the roller/crimper centered on plot middles, and the edges of the roller/crimper in plot borders. Cover crops were rolled/crimped when the wheat and rye in the mixture reached anthesis or Zadoks growth stage 60 (visible pollen shedding), following protocols from previous researchReference Ashford and Reeves27. Before rolling/crimping, the roller/crimper was filled with water to aid in crushing cover crops. Corn and soybean crops were planted in all plots on the same day as rolling/crimping. Organic soybean seed (‘Blue River 3F43’ in 2006 and ‘BR34A7’ in 2007) was planted at 494,210 seeds ha−1 in 76-cm rows in organic-tilled treatment plots (John Deere planter, Ankeny, Iowa, USA), following typical planting rates for organic farmers in the area, while soybeans in no-tillage plots were drilled into the crushed cover crop at the same plant population as the tilled treatment in 19-cm rows (John Deere no-till drill, Ankeny, Iowa, USA). The newer organic soybean variety in 2007 contained a similar genetic profile (large-seeded, high-protein and soymilk variety) as the 2006 variety. Corn seed (‘BR67M07’ in 2006, and the similar ‘BR63H07’ in 2007) was planted at 79,073 seeds ha−1 in 76-cm rows in all plots. No fertilization was applied to corn plots, due to the farmer-expressed need for evaluating no-tillage corn performance using cover crops as the sole nutrient source. Weed management in the organic tilled treatment plots consisted of two rotary hoeings and two row cultivations, per local organic-farming recommendations. No weed management was conducted in no-tillage plots. Corn and soybeans were harvested with a combine (John Deere) equipped with an on-board weighing system in late October 2006 and early November 2007.
Tomato plots were managed following local organic protocols that included hand-transplanting tomato seedlings (30.5×61 cm spacing) into each rolled cover crop or tilled treatment plot. Transplants were side-dressed with 2300 kg ha−1 of composted swine manure at the time of transplanting, per local farmer practices. Average nutrient content of the compost was 1.9, 2.4 and 3.5 kg t−1 N, P and K, respectively, providing an estimated 44 kg N ha−1. Weeds in the tilled plots were hand-hoed every 2 weeks during the growing season. Irrigation was applied through overhead sprinklers, as needed, based on rainfall events. Ripe tomato fruits (⩾7.6 cm) were hand-harvested from 10 randomly selected plants per plot from August 14 to September 26, 2006 and from August 20 to September 12, 2007. Fruits were counted and immediately weighed for yield estimates.
Data collection
Soybean and corn plant populations were estimated in the month following planting, following protocols in previous organic researchReference Delate and Cambardella7. Corn and soybean plant heights were estimated only in the first season by measuring the highest point of three randomly selected plants per plot to determine whether there was a difference in early plant growth between treatments. Weed populations were estimated in corn and soybean plots in 2007 by counting broadleaf and grass weeds within a 0.84-m2 quadrat in three randomly selected areas within each plot in JuneReference Delate and Cambardella7. Sampling for corn borer [Ostrinia nubilalis (Hübner)] occurred in late June 2007 (none detected in 2006) by inspecting the whorl of three corn plants (V-6 stage) per plot and recording corn borer larvae presence. At harvest, corn and soybean grain weights were immediately determined, followed by standardization of weights to kg ha−1 at 15.5 and 13% moisture, respectively.
Tomato plant height was estimated by measuring the highest point of three randomly selected plants per plot in July and August each year. Weed populations were estimated in the same months each year, with an additional assessment in September 2006. Weed management in organic tilled plots did not occur until after weed populations were counted. In order to determine any differences in reproductive capacity between treatments, early season fruit numbers were determined in July each year and in August 2006 on three plants per plot. Tomato plants were assessed for disease symptoms in July 2006; no disease was detected in 2007. Diseased leaves were collected and plant pathogen diagnosis was confirmed by the Iowa State University Plant Disease Clinic (Ames, Iowa).
Economic analysis
An enterprise budget, which included an estimate of the costs and returns of producing organic corn, soybean and tomato, was developed for this study, following methods of Chase et al.Reference Chase, Delate and Johanns29. In economic terms, enterprise budgets help to allocate costs for land, labor and capital to the most appropriate use, as prioritized by the producer. The economic analysis included detailed accounting of fixed and variable costs for inputs (fuel, equipment depreciation, seeds, crop fertility sources and labor), subsequent yields and selling price of organic crops. Machinery costs for field operations were determined by applying standardized cost estimates for cultural practices in each tillage system using Iowa State University surveysReference Duffy and Smith30, Reference Duffy and Smith31. Gross revenue was determined by multiplying certified organic prices received for the crop by the average yield obtained in each treatment. Returns to management were calculated by subtracting production costs, including labor and land charges, from gross revenues.
Data analysis
With rainfall differences between years, there was also a significant difference in treatment effects between years (data not shown). Thus, data are presented by each year separately. Individual year crop growth, yield, weed and pest population data were subjected to analysis of variance and mean separation using Fisher's Protected LSD at P⩽0.05.
Results and Discussion
Cover crop growth and termination
Germination of the hairy vetch, rye, wheat and winter pea cover crop seed was excellent in both years of the experiment. Thirty days after cover-crop planting in both years, cover was established on 95% of the plot area, with legume plants in each treatment averaging 7.6 cm in height (data not shown). In Spring 2006 and 2007, when cover crops were rolled/crimped prior to planting field crops, two to three rolling/crimping operations were required to completely terminate any erect cover crop plants after each pass, in contrast to the desired ‘one-pass’ system. Wheat/winter pea mixture plots were rolled/crimped two times while those in the rye/hairy vetch mixture were rolled/crimped three times. Even after the third rolling/crimping, hairy vetch plants continued to grow in approximately 10% of the plot area. With the exception of some of the vetch plants, rolled/crimped cover crops lost vigor and appeared as a dry, killed mulch layer approximately 3 weeks after rolling/crimping.
Crop growth and yield
Corn response
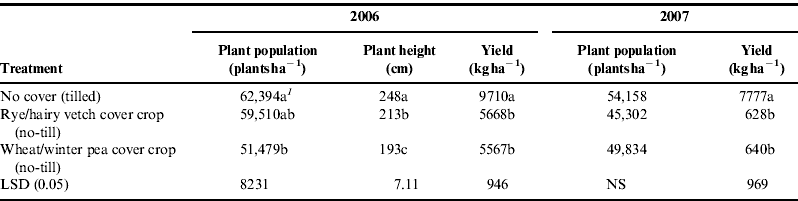
Limited rain in June and July 2006 increased soil moisture competition between cover crops and corn and soybean plants. Rainfall during June 2006 was 8.1 cm below the 30-year average monthly precipitation; July rainfall was 2.8 cm below normal amounts, while 2007 rainfall met the 30-year averages. As a result of low rainfall in 2006, cover crop competition, and potential N immobilization (not directly measured), no-tillage corn plants were smaller and had lower plant stands than tilled plants (Table 1). Corn yield was greatly reduced (by 42% in 2006 and 92% in 2007) in the no-tillage treatments compared to the tilled system. These results contrasted with Pennsylvania organic no-till corn yields, which reached 9598 kg ha−1 in a rolled hairy vetch cover cropReference Mischler, Duiker, Curran and Wilson32. Yield reductions in conventional reduced tillage systems have been associated with cooler soilsReference Walters and Young33, Reference Licht and Al-Kaisi34, insufficient fertilityReference Bermudez and Mallarino35, or less effective weed management in some casesReference Davis, Renner and Gross36. Differences between the more promising yields in other states and the poor corn growth and yield in the organic no-tillage system in Iowa may be correlated with several factors: less severe winter weather in the mid-Atlantic states supporting enhanced hairy vetch survival; later physiological stage of cover crop at rolling/crimping; and sandier soil allowing more consistent crimping of cover crop stems. Associated with higher yields, hairy vetch was terminated in the early-pod stage in WisconsinReference Bernstein, Posner, Stoltenberg and Hedtcke37 compared to a 25% bloom stage in Iowa. By delaying rolling until hairy vetch early-pod stage, cover crop termination would likely improve, since the rye cover crop in the mixture would be past anthesis, which was found to improve the effectiveness of rolling/crimpingReference Mirsky, Curran, Mortensen, Ryan and Shumway38. The most critical issue with delayed planting, however, would be obtaining adequate grain yields with a shorter-maturity corn variety.
Corn growth and yield in the organic no-tillage experiment, 2006 and 2007, Greenfield, Iowa.
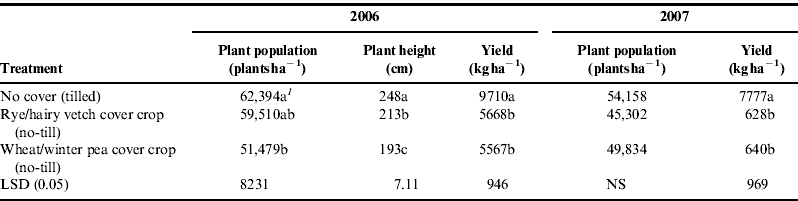
1 Means followed by the same letter down the column for each year are not significantly different at P⩽0.05 according to Fisher's protected LSD test. Yield based on 15.5% moisture.
Soybean response
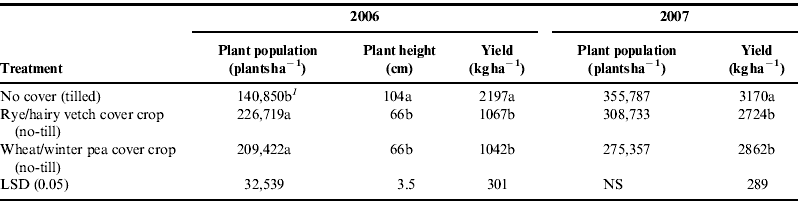
Rotary-hoeing operations appeared to negatively affect soybean plant populations in the tilled treatment in 2006, which had lower plant populations than both no-tillage cover-crop treatments (Table 2), but crop stand differences were not observed in 2007. Similar to corn response, soybean plant height and yields were reduced in the no-tillage treatments. In one of the two years (2007), no-tillage soybeans averaged 2793 kg ha−1, which was similar to the tilled organic soybean yield of 3170 kg ha−1, but statistically lower. Bernstein et al.Reference Bernstein, Posner, Stoltenberg and Hedtcke37 obtained organic no-tillage soybean yields in Wisconsin similar to our results, with 24% greater yields in tilled over no-tilled fields. Thelen et al.Reference Thelen, Mutch and Martin39, however, obtained 4167 kg ha−1 in soybean intercropped with rye in Michigan, suggesting a higher yield potential with this system.
Soybean growth and yield in the organic no-tillage experiment, 2006 and 2007, Greenfield, Iowa.
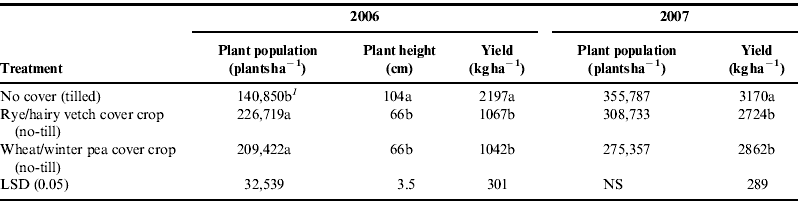
1 Means followed by the same letter down the column each year are not significantly different at P⩽0.05 according to Fisher's protected LSD test. Yield based on 13% moisture.
Tomato response
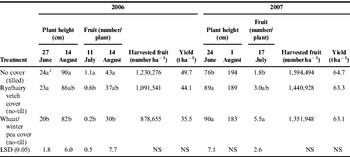
In contrast to no-tillage corn and soybean, the irrigated no-tillage tomato system had similar agronomic responses as the tilled system (Table 3). Plant height and early fruit number varied between sampling periods, but in general, the no-tillage treatments did not decrease plant growth compared to the tilled treatment. Irrigated tomato yields averaged 40 t ha−1 in 2006 and 63 t ha−1 in 2007, with no statistical differences between treatments. Of the two no-tillage treatments, the hairy vetch/rye cover crop produced numerically higher yields, which were only 2% lower than tilled plots each year. Our results were similar to those of Teasdale and Abdul-BakiReference Teasdale and Abdul-Baki40 and Abdul-Baki et al.Reference Abdul-Baki, Strommel, Watada, Teasdale and Morse41 who obtained statistically equal yields in tilled and no-tillage tomatoes planted into a hairy vetch mulch. Creamer et al.Reference Creamer, Bennett, Stinner and Cardina42 also demonstrated statistically equal yields between organic tomatoes grown in an undercut cover-crop mixture of hairy vetch, rye, crimson clover and barley and conventionally fertilized tomatoes. In California, organic tomato yields were found to be statistically equal in no-tillage and tilled treatments only when cover crop re-growth did not occurReference Madden, Mitchell, Lanini, Cahn, Herrero, Park, Temple and Van-Horn43. During periods of low rainfall, Mills et al.Reference Mills, Coffman and Teasdale44 reported 29% lower no-till tomato yields compared to those grown with black plastic mulch. Thus, in order to obtain the highest returns with no-tillage vegetable crop systems, adequate irrigation must be provided. While the response to no-tillage conditions has been generally positive with tomato crops, results from reduced-tillage bell pepper (Capsicum annuum L.) and zucchini (Cucurbita pepo L.) production have ranged from statistically equalReference Delate, Cambardella and McKern45 to 20–50% reduced no-tillage yieldsReference Walters and Young33, Reference Diaz-Perez, Silvoy, Phatak, Ruberson, Morse, Prange and Bishop46. In those cases where yield reductions occurred, poor cover crop seed coverage, reduced soil temperatures and N immobilization during cover crop decomposition were reported. In previous research in Iowa, higher soil N was present when cover crops were tilled compared to strip-tilled, leading to recommendations for side-dressing composted manure in organic strip-tilled organic pepper production to improve yieldsReference Delate, Cambardella and McKern45. Success of conservation tillage systems has also been reported to be dependent on minimum cover crop mulch disturbance during seeding or transplanting operationsReference Morse47.
Tomato plant growth and yield in the organic no-tillage experiment, 2006 and 2007, Greenfield, Iowa.

1 Means followed by the same letter down the column each year are not significantly different at P⩽0.05 according to Fisher's protected LSD test.
Weed populations and pest levels
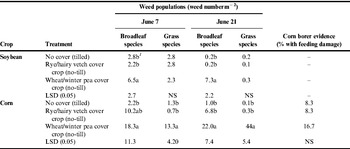
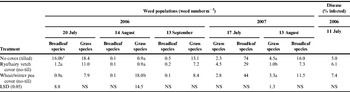
Weed populations were greater overall in corn and soybean no-tillage plots than in tilled plots in 2007 (Table 4). Despite the initial adequate mulch layer provided by both rolled/crimped cover crops, the rye/hairy vetch mulch tended to suppress weeds more than the wheat/winter pea treatment over all comparisons. Throughout the season, the wheat/winter pea mulch layer degraded at a greater rate than the rye/hairy vetch mulch (data not shown), leading to more open sites for weeds. In the tomato plots, weeds in no-tillage plots were lower or statistically equal to tilled plots (Table 5), particularly in the hairy vetch/rye plots, but the potential for increasing the weed seedbank when weeds are not managed below economic threshold levels is a concern in long-term organic no-tillage fields. Greater weed management can be obtained in organic no-tillage systems, provided fields have adequate mulch biomass and complete cover crop termination, as Walters and YoungReference Walters and Young33 have reported up to 80% control of common annual weeds in winter rye stands. Other research, however, has demonstrated greater weed populations in organic wheat, tomato and bell pepper no-tillage systems, respectivelyReference Miller, Buschena, Jones and Holmes25, Reference Madden, Mitchell, Lanini, Cahn, Herrero, Park, Temple and Van-Horn43, Reference Diaz-Perez, Silvoy, Phatak, Ruberson, Morse, Prange and Bishop46. In our results, weed populations were not found to interfere with irrigated tomato production as much as in rain-fed no-tillage corn and soybean plots, where weeds and hairy vetch re-growth extensively competed with crop growth.
Soybean and corn pest parameters in the organic no-tillage experiment, 2007, Greenfield, Iowa.

1 Means followed by the same letter down the column each year for each crop are not significantly different at P⩽0.05 according to Fisher's protected LSD test.
Tomato pest parameters in the organic no-tillage experiment, 2006 and 2007.

1 Means followed by the same letter down the column each year are not significantly different at P⩽0.05 according to Fisher's protected LSD test.
Pest insect response occurred in corn plots only. Corn borer damage in 2007 ranged from 8% in tilled and no-tillage hairy vetch/rye plots to 17% in the no-tillage wheat/winter pea treatment (Table 4), with no significant difference between treatments. Overall, there was a low rate of Septoria lycopersici leaf spot in tomato plots (<8% in 2006; none detected in 2007), with no statistical differences observed between treatments.
Economic comparisons
Corn production costs and returns
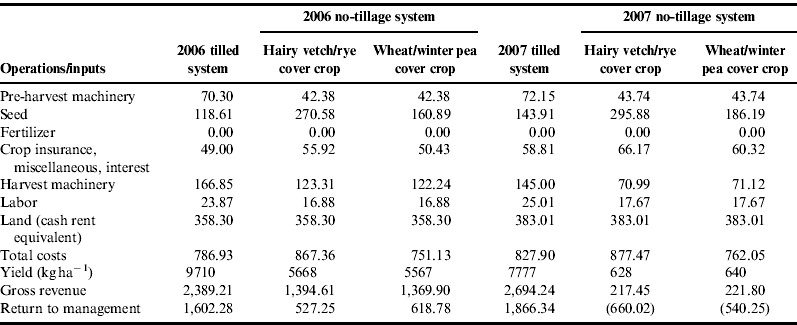
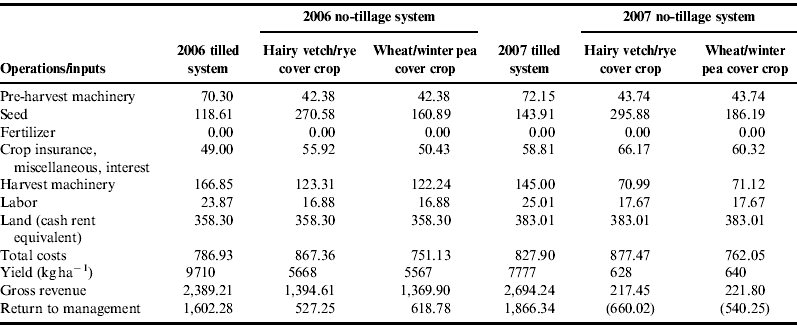
Organic corn production costs differed by the tillage system in both the years of experiment, with similar costs across all systems in hourly labor rate at US$10.50 h−1 (2006) and US$11.00 h−1 (2007); interest, charged on all pre-harvest variable costs, including field operations, seed and labor, at a rate of 7.5% in 2006 and 8% in 2007; and land rent at US$358 ha−1 (2006) and US$383 ha−1 (2007). Machine labor was assessed on the basis of time involved in conducting field operations. Total costs in 2006 ranged from US$786 ha−1 in the tilled system to US$867 ha−1 in the hairy vetch/rye no-tillage system (Table 6). Three cost categories—pre-harvest machinery, seed and harvest machinery—contributed the most to cost variation, with the cover-crop system contributing additional costs for seed and management. In this analysis, pre-harvest machinery costs included fixed and variable costs for field operations prior to harvest, while harvest machinery cost included fixed and variable costs for combining plus handling, hauling and drying. The latter three costs were incurred on a ‘per kg of grain’ basis so there was a direct relationship between total harvest machinery costs and yield. Total production costs for 2007 segregated in the same fashion as 2006, ranging from US$762 to US$877 ha−1, with the same three categories contributing to differences between systems. Selling price for organic corn in 2006 was US$0.24 kg−1 and US$0.35 kg−1 in 2007. Returns to management by tillage system for organic corn crops ranged from US$527 ha−1 in the hairy vetch/rye no-tillage system to US$1601 ha−1 in the tilled system in 2006. In 2007, when no-tilled corn yields were extremely low, there were substantial losses of –US$660 ha−1 and –US$540 ha−1 in the hairy vetch/rye and the wheat/winter pea no-tillage systems, respectively. With no-tillage corn yields averaging 58% of those in tilled plots in 2006 and 8% of those in tilled plots in 2007, the economic analysis showed that yields and the resulting gross revenue contributed more to returns per hectare than differences in costs, showing the organic no-tillage corn system as financially unviable for those years.
Economic analysis of organic corn under tilled and no-tillage production, Greenfield, Iowa, 2006 and 2007 (US$ ha−1).
Soybean production costs and returns
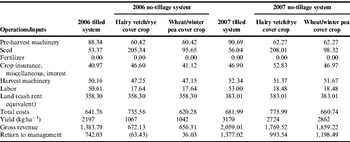
Soybean production costs in 2006 were US$642 ha−1 in the tilled system and US$736 ha−1 in the hairy vetch/rye no-tillage system (Table 7). Costs in the wheat/winter pea no-tillage system were similar to the tilled system, accruing US$620 ha−1. Soybean production costs varied between systems in the same categories as shown for the corn production system. Total production costs for 2007 ranged from US$682 ha−1 in the tilled system to an average of US$718 ha−1 in the no-tillage system. Management in the tilled system included both the time involved for the field operations and for ‘walking’ soybeans (hand-weeding) at 2.5 h ha−1. Hand-weeding was not conducted in the no-tillage treatments, due to a sufficient mulch layer formed by the cover crop after termination. Soybean prices were US$0.63 kg−1 in 2006 and US$0.65 kg−1 in 2007. Similar to the corn economic analysis, tilled soybeans returned more to management, due to higher yields and higher gross revenues. Tilled soybeans returned US$742 ha−1 in 2006 compared to a loss of US$14 ha−1 from the no-tillage plots, which averaged 55% lower yields than tilled plots. In 2007, when average no-tillage soybean yields were only 12% lower than tilled soybeans, no-till returns to management averaged US$1096 ha−1 compared to US$1377 ha−1 for tilled soybeans, suggesting that no-tillage soybean production can be competitive in years of adequate rainfall. The economic returns for organic no-till soybeans were similar to those obtained in previous experiments, where higher organic soybean yields concomitantly matched 25% greater economic returns in the tilled systemReference Bernstein, Posner, Stoltenberg and Hedtcke37.
Economic analysis of organic soybean under tilled and no-tillage production, Greenfield, Iowa, 2006 and 2007 (US$ ha−1).

Tomato production costs and returns
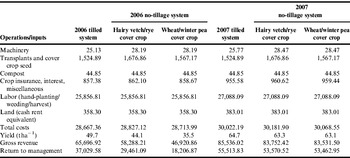
Tomato production costs by tillage system ranged from US$28,667 ha−1 in 2006 to US$30,022 ha−1 in 2007 in the tilled system, to an average of US$28,771 ha−1 in the no-tillage system in 2006 and US$30,125 ha−1 in 2007, reflecting few differences in production costs among systems (Table 8). Field operations, except for plot preparations, were based on manual labor, representative of small-scale organic vegetable operations in the area. Compost rates included a unit cost of US$0.02 kg−1, averaging US$45 ha−1 across all treatments. Tomato prices were held constant at US$1.30 kg−1 for the 2-year period. Because production costs were stable each year among tillage treatments, differences in returns to management primarily resulted from yield differences. As previously indicated, the highest numerical yields were obtained in the tillage treatment in both the years of study, and the additional costs for cover crops and rolling/crimping lowered no-tillage economic returns.
Economic analysis of organic tomatoes under tilled and no-tillage production, Greenfield, Iowa, 2006 and 2007 (US$ ha−1).

Conclusions
Economic risks from low no-tillage yields are often weighed against the positive benefits of soil erosion prevention and improvements in soil quality in no-tillage productionReference Schillinger, Kennedy and Young48. Methods to decrease tillage in organic crop production will greatly advance soil conservation on organic farms, but ‘green payments’ for soil conservation effortsReference Singerman, Delate, Chase, Greene, Livingston, Lence and Hart49 are needed to offset yield and economic losses. While the development of a successful no-tillage system for organic production remains our goal, organic systems that rely on tillage may not necessarily decrease soil quality if additional C sources are routinely added to the soil, as required under certified organic rules. Teasdale et al.Reference Teasdale, Coffman and Mangum50 reported higher soil combustible C and N after 9 years in an organic system that included cover crops compared with three conventional, no-tillage systems, two of which included cover crops. C budgets developed after 10 years of organic production in Iowa showed that a 4-year organic cropping system (corn–soybean–oats–alfalfa) can potentially sequester as much soil organic C (0.53 Mg C ha−1 yr−1 in the top 15 cm) as a conventional no-tillage systemReference Cambardella and Delate51 based on prudent amounts of tillage, coupled with crop rotations, cover crops and compost applications. Additional research in organic no-tillage systems in Iowa will examine soil quality aspects, particularly for organic no-till soybeans, where successful yields consistently have been obtainedReference Delate, Cwach, Fiscus and Emley52. The development of cover crop varieties that mature in early spring under Midwest conditions and continued research on improved roller/crimper prototype design to allow complete termination of cover crops in one pass is needed to advance organic reduced- or no-tillage systemsReference Kornecki, Price and Raper53.
Acknowledgments
We would like to thank the USDA-CSREES Integrated Organic Program, Leopold Center for Sustainable Agriculture and the Neely-Kinyon Farm Association; and Robert Burcham, Andrea McKern, Mark Rosmann and Robert Turnbull for assistance with this project.