I. INTRODUCTION
Research efforts in the solution-based surface functionalization of inorganic materials have sought to expand the knowledge base of the effects of surface bound molecules on their properties. Of these semiconducting materials, gallium nitride (GaN), a III–V material with a band gap of 3.4 eV, is of significant interest. Reference Morkoc1 The surface modification of GaN has been used to develop field effect transistors with a myriad of surface treatments, such as recognition peptides, Reference Rohrbaugh, Bryan, Bryan, Arellano, Collazo and Ivanisevic2 attached thiols, Reference Bermudez3 and alkyl groups, Reference Peczonczyk, Mukherjee, Carim and Maldonado4 nucleic acids binders, such as olefins, Reference Kim, Colavita, Metz, Nichols, Sun, Uhlrich, Wang, Kuech and Hamers5 1-alkenes, Reference Schwarz, Cimalla, Eichapfel, Himmerlich, Krischok and Ambacher6 atomic layer deposition thin films, Reference Guo, Abdulagatov, Rourke, Bertness, George, Lee and Tan7 and alkylphosphonic acids Reference Ito, Forman, Cao, Li, Eddy, Mastro, Holm, Henry, Hohn and Edgar8 for unique properties. The chemisorption of multiple molecules (haloanilines, Reference Bermudez9 aniline, Reference Bermudez10 pyrroline, Reference Bermudez11 water, Reference Bermudez and Long12 and fluorine Reference Bermudez13 ) on GaN surfaces has traditionally been studied within controlled environments. Of the properties altered with surface chemistry, the modulation of optical properties of GaN is well documented Reference Wilkins, Paskova and Ivanisevic14 and remains a continuing endeavor. The rise in applications of functionalized gallium nitride is attributed to their documented chemical inertness Reference Arisio, Cassou and Lieberman15 and biocompatibility through aqueous stability Reference Foster, Collazo, Sitar and Ivanisevic16 when compared to other III–V semiconductors. Recent work has shown that wet etching gallium nitride with phosphoric acid in the presence of adsorbates alters the surface morphology as well as the surface chemical composition. Reference Jung, Ahn, Baik, Kim, Pearton, Ren and Kim17 This combined process opens up the ability to change the semiconductor surface, which introduces opportunities for the development of functional interfaces as well as biosensing applications.
The attachment of dye molecules to semiconductor interfaces is beneficial for applications, such as dye-sensitized solar cells (DSSCs) and optical sensors. Reference Lopez-Gejo, Navarro-Tobar, Arranz, Palacio, Munoz and Orellana18 In DSSCs, the dye is crucial as it allows a wider bandwidth of light to be absorbed. Previous research has documented evidence that the porphyrin sensitizers provide high photon-to-electron conversion efficiency. Reference Odobel, Blart, Lagree, Villieras, Boujtita, El Murr, Caramori and Bignozzi19 The most studied semiconductor in DSSCs so far is TiO2. Due to a low-electron mobility of TiO2 (less than 1 cm2/V s), Reference Hendry, Koeberg, O'Regan and Bonn20 there is a focused effort in identifying alternative wide band gap materials. One alternative to TiO2 that has been investigated is ZnO Reference Klaumunzer, Kahnt, Burger, Mackovic, Munzel, Srikantharajah, Spiecker, Hirsch, Peukert and Guldi21 ; however, the instability of the surface interaction between the dye and semiconductor is cited for the recorded low-conversion efficiency. Recent use of GaN for DSSC applications has shown promise compared to transition metal oxides. Reference Sunkara, Pendyala, Cummins, Meduri, Jasinski, Kumar, Russell, Clark and Kim22 Incorporating GaN into DSSCs provides a semiconductor with higher electron mobility than traditional TiO2. Additionally, the high-chemical stability of GaN under different environmental conditions and various solvents is beneficial for future solar cell devices. Reference Jewett, Makowski, Andrews, Manfra and Ivanisevic23
In this study, we report the surface modification of milled GaN powder with a porphyrin dye. The reported characterization focuses on the chemical stability of the bound dye to GaN and nature of the dye bonding. The use of milled powder was originally used due to its ease and cost when compared to traditional methods, such as chemical vapor deposition. Reference Millet, Calka, Williams and Vantenaar24 Improvements in the milling process have allowed for the possibility of high-quality crystal growth. Reference Swamy, Shafirovich and Ramana25 The high-surface area of the powder GaN is beneficial for applications, such as solar cells where one tries to maximize light conversion. In addition to the large surface area, the ability to convert the powder into a paste and to deposit it onto large planar surfaces provides simplified processing beneficial for DSSC fabrication. By altering the surface morphology with the aforementioned etching technique, the chemical stability of the porphyrin salt in the presence of phosphoric acid as well as in an aqueous environment was tested. The GaN powder was imaged with scanning electron microscopy (SEM) to probe the size and homogeneity of the powder. Fourier transformed infrared (FTIR) spectroscopy was utilized to observe the incorporation of the organic dye into the GaN surface. Quantitative x-ray photoelectron spectroscopy (XPS) determined elemental composition, binding shifts, and the presence of surface species after porphyrin dye attachment. The stability of the attachment of the dye to GaN is important to assess since it is directly related to device efficiency. Reference Arisio, Cassou and Lieberman15 Fluorescence spectroscopy tracked the presence and possible leaching of dye from the powder after immersion in aqueous solutions for up to 20 days.
II. MATERIALS AND METHODS
A. Powder functionalization
The gallium nitride powder was obtained from Sigma-Aldrich (99.99% trace metals basis) without pretreatment. The powder was washed three times with acetone (Fisher Scientific) and three times with methanol (Sigma Aldrich). The samples were then rinsed with hydrochloric acid (Sigma Aldrich, 35–38 vol%) three times followed by three washes with deionized (DI) water (18.2 MΩ cm).
A 7.125 μM solution of meso-tetra(4-phosphonomethylphenyl) porphine tetrasodium salt (TTP-PO3) (Frontier Scientific) with DI water was prepared. This solution was added in a 1:1 (v:v) ratio to phosphoric acid (Fisher Scientific, 95%). The resulting solution was added to the washed and treated GaN powder and heated for a period of 120 min at 40 °C. The powder was stirred throughout the duration of the treatment. A separate batch of powder was washed and stirred in phosphoric acid etchant only for the same time and under the same conditions. After 120 min, the GaN powder was washed with DI water three times and left overnight in a desiccator to dry.
B. Characterization
An Agilent Technologies Cary Series Ultraviolet–Visible Spectrophotometer (UV–Vis) was used to collect absorbance data. The 7.125 μM solution of TTP-PO3 as well as a solution of 50 vol% 7.125 μM TTP-PO3 and 50 vol% phosphoric acid were tested. All spectra were collected in quartz cuvettes.
Pretreatment GaN powder was imaged with a JEOL 6010 LE SEM (Peabody, MA) with an accelerating voltage of 20 kV. The working distance for the image was 10 mm with a spot size of 50. A magnification of 3000x was used to take the micrograph. The IR data were gathered with a Bruker 1 95 9670 ALPHA Fourier Transform Infrared (FTIR) Spectrometer equipped with a KBr beam splitter. Using the instrument OPUS software, the resolution was set to 2 cm−1 for all scans. The samples were evaluated by averaging 36 scans in transmittance mode. All semiconductor samples were prepared using 50 g of KBr to 1 g of GaN powder. For the TTP-PO3 data collection, 100 g of KBr to 0.1 g of TTP-PO3 was utilized. The OPUS software was used to perform a background subtraction and smooth line profiles.
All XPS evaluation was performed on an Axis Ultra XPS manufactured by Kratos. The x-ray source was a monochromated Al Kα with a beam energy of 1486.7 eV. A charge neutralizer was used with 2.0 A filament current to account for charging the samples. The pressure was maintained within the sample chamber to 3 × 10⁻⁸ Torr. The samples were mounted onto an aluminum sliding sample holder using adhesive-coated copper tape. For each sample, a survey scan was collected at a sweep pass energy of 160 eV. High-resolution regional scans were gathered at a pass energy of 20 eV for C 1s, Ga 2p, N 1s, O 1s, and P 2p spectra. The software used to deconvolute and calibrate the peaks was CASA XPS version 2.3.12.8. A Shirley approximation was used to remove the background before peak deconvolution. The data were calibrated by setting the adventitious carbon C 1s peak to 284.8 eV. A Lorentzian fit was used to constrain the full width half-maximum of the deconvoluted peaks to the primary peaks. A second calibration was performed to adjust for the high degree of charging evident in the N 1s region scan. The N–Ga peaks for each sample were calibrated to 397.3 eV. Reference Carin, Deville and Werckmann26
The fluorescence data were obtained with an excitation wave length of 455 nm at maximum light emitting diodes (LED) source intensity. The sample was sonicated before testing to ensure dispersion of particles within the solution. All data were plotted and analyzed with Origin 9.0.
III. RESULTS AND DISCUSSION
A. In situ functionalization of GaN powder with porphyrin
Porphyrin molecules show promise for sensitization due to their reported high-conversion efficiencies. Reference Cherian and Wamser27 Stable bonding between the semiconductor and dye molecules is critical for stability and optimal electronic properties in photonic devices, which has been explored by a number of research groups. Brennan et al. investigated various anchoring groups for attaching porphyrin molecules to semiconductor surfaces. Reference Brennan, Portoles, Liddell, Moore, Moore and Gust28 The use of porphyrin dyes to successfully sensitize TiO2 was described by Odobel et al. Reference Odobel, Blart, Lagree, Villieras, Boujtita, El Murr, Caramori and Bignozzi19 In this study, we performed an in situ functionalization of GaN powder with a porphyrin derivative TTP-PO3 using a recently reported in situ approach. Reference Wilkins, Greenough, Arellano, Paskova and Ivanisevic29 The covalent attachment of the porphyrin to GaN was investigated to determine the success and stability of the reaction.
The selection of porphyrin derivative for this study was based primarily on the side groups and the ability to bind to GaN in addition to containing a desirable structure to modulate the optical response. The attachment of phosphonate groups to gallium nitride through in situ functionalization was recently quantitatively studied. Reference Wilkins, Greenough, Arellano, Paskova and Ivanisevic29 A water-soluble porphyrin was needed to be compatible with phosphoric acid used during the in situ procedure. The TTP-PO3 salt provides a water-soluble molecule containing phosphonate side groups available for attachment through a bidentate mode. In future studies on porphyrin dye attachment to GaN, the incorporation of a metal center within the molecule will be explored.
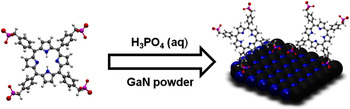
Prior to the functionalization method displayed in Fig. 1, the GaN powder was washed with various solvents and treated with hydrochloric acid. The hydrochloric acid was used to remove the native thin oxide layer, which forms on GaN during storage under normal room temperature and humidity environmental conditions. During functionalization, H3PO4 serves as an etchant that encourages the formation of a controlled oxide layer in addition to removing nitrogen-rich regions from the surface. By adding TTP-PO3 while etching, phosphonic groups preferentially bind to metal-rich areas on the surface as well as to protonated and hydroxyl terminated regions. This, in turn, provides a binding site for TTP-PO3 as well as caps existing gallium oxide to hinder dissolution in water. The 7.125 μM solution of TTP-PO3 used in this study falls within the concentration ranges that other surface modification procedures have utilized (1 μM–1 mM). Reference Vericat, Vela, Corthey, Pensa, Cortes, Fonticelli, Ibanez, Benitez, Carro and Salvarezza30 Identification of bonding and subsequent changes in surface chemistry at the GaN interface are best performed with surface sensitive techniques, such as XPS. XPS gathers information about the binding energies of species at the sample surface and provides qualitative as well as quantitative information of changes in chemical composition following chemical treatments. FTIR assesses the presence of distinct functional groups. An additional advantage of using porphyrin as an adsorbate is its distinct fluorescent spectra with peaks with strong intensity. This provides a method of both testing successful functionalization as well as quantification of the stability of the dye attachment to the GaN interface.
Schematic diagram of the in situ functionalization process showing bidentate binding of the porphyrin on the surface of the GaN powder.

B. Stability of porphyrin in phosphoric acid
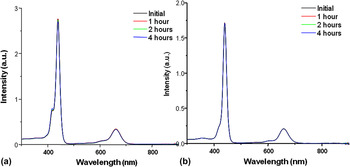
An important consideration in this study was the possible aggregation or degradation of TTP-PO3 in solution, DI water, or with phosphoric acid. In a typical UV–Vis absorbance spectrum, a sharp Q band is used to provide evidence of the monomeric species of TTP-PO3. If aggregation occurs, this peak will blue-shift as well as broaden in the UV–Vis spectrum. In Fig. 2, no aggregation or degradation was observed in TTP-PO3 dissolved in water or mixed with phosphoric acid etching solution. The solutions were left for 4 h before they were tested to allow enough time for aggregates to form. These results provided evidence that TTP-PO3 was compatible with the solution conditions necessary for the in situ method of functionalization.
Room temperature UV–Vis spectra of (a) 7.125 μM TTP-PO3 in DI water and (b) 50% 7.125 μM TTP-PO3 in DI water and 50% phosphoric acid.

C. Morphological characterization by SEM
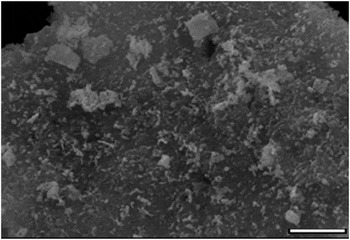
SEM quantified the homogeneity of the GaN powder. Images, such as those seen in Fig. 3, show that the aggregate size of the GaN powder varies widely, and the overall surface holds little homogeneity. SEM was also used to probe for evidence of aggregation of organic contamination and TTP-PO3. We observed that the powder was free of organic particulates from environmental contamination. The overall aggregate size was recorded to be dissimilar in various batches and ranged from less than 1 μm up to sizes greater than 5 μm. For this study, uniformity of the particulates making up the powder was not a concern as the binding at the GaN powder interface was the primary focus. The aggregates appeared amorphous with no consistent shared geometry shapes, which let to the conclusion that the aggregate composition was heterogeneous.
SEM image of GaN powder showing the size and heterogeneity of aggregates within the powder. Scale bar is 5 μm.

D. Surface characterization
1. X-ray photoelectron spectroscopy
XPS was utilized to confirm successful attachment of TTP-PO3 to the GaN powder. Multiple survey and high-resolution regional scans were collected following cleaning, etching, and functionalization. In the samples that underwent etching, the presence of a P 2p peak was expected due to residual phosphonic acid groups on the surface. The collection of C 1s spectra provides a calibration technique as well as probing mechanism into TTP-PO3. Reference Silipigni, De Luca, Quattrone, Scolaro, Salvato and Grasso31 However, the adventitious carbon peak lies in close proximity with the expected peak for the porphyrin (285.0 eV). The Ga 2p region was collected to determine the presence of specific gallium species on the surface. These regional scans offer evidence of oxide species, Ga2O3, and other sub oxides, forming on the surface. Reference Wilkins, Paskova and Ivanisevic32
A peak centered near 1120 eV was present in the survey scan for each of the samples. This peak was attributed to gallium content from both the powder and surface oxide seen within the Ga 2p spectra. Another peak near 530 eV, again recorded in the survey scans for all three types of samples, indicates the presence of oxide groups on the surface as seen from the O 1s region. In accordance with the identification of gallium, the peak centered near 400 eV confirmed the presence of nitrogen, which is as expected and was observed within the high-resolution N 1s spectra. A peak centered near 135 eV was present for the etched only GaN powder, as well as the etched and functionalized GaN powder, which was distinctly absent for the cleaned powder. This peak was attributed to P 2p as a result of etching and functionalization. For all three types of samples, carbon contamination was present and verified due to the emergence of a peak centered at 284.8 eV.
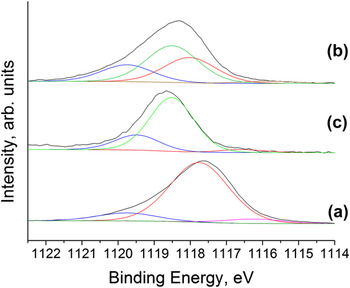
The high-resolution regional scan of Ga 2p (Fig. 4) was used to determine the nature of the gallium species on the surface of the samples. The Ga 2p spectra are preferred over the Ga 3d spectra for high-resolution scans for their lower kinetic energy of radiation, therefore, providing higher surface sensitivity. Reference Makowski, Zemlyanov, Lindsey, Bernhard, Hagen, Chan, Petersohn, Medow, Wendel, Chen, Canter and Ivanisevic33 CASA XPS was used to analyze and fit the data. For all three samples, a peak was present and centered near 1118 eV, which was attributed to the Ga–N bonding expected on the surface. Reference Watkins, Wicks and Gao34 Each sample contained a species centered near 1116 eV, which was due to Ga–Ga bonding near the surface. Reference Evans35 The species present in each sample near 1119.75 eV was attributed to Ga2O3. Reference Watkins, Wicks and Gao34 The existence of suboxide species, such as Ga2O, GaO, GaOOH, and GaO2, can be verified by peaks found at 1118.5 eV.
Ga 2p regional XPS spectra of (a) clean GaN powder, (b) clean, etched GaN powder, and (c) functionalized GaN powder.

The ratio of gallium species recorded in the spectra provided information about the nature of the gallium on the surface of the samples. In the clean GaN powder, the presence of suboxide species was not evident from the data. The percent area of Ga2O3 in the Ga 2p peak of the clean GaN powder was 11.43%, and the percent area of Ga–N was 82.08%. In the etched only sample of GaN, the suboxide species were a significant portion of the peak. The percent area of Ga2O3 was 20.12%, of sub oxides was 67.51%, and of Ga–N was 8.69%. In the functionalized samples of GaN powder, the percent area of Ga2O3 was 20.69%, of suboxide species was 45.46%, and of Ga–N was 31.11%. As expected, the etching process shows evidence of the production of oxide and suboxide species in the GaN powder samples that were used.
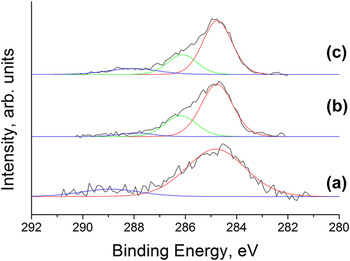
The peak centered near 285 eV was attributed to C 1s and was used for calibration of the data in CASA XPS (Fig. 5). The C 1s peak was analyzed, and for each sample, the existence of two species contributing to this peak was evident. The species with the lowest binding energy was attributed to adventitious carbon and was calibrated to 284.8 eV. Reference Fairley36 The atmospheric contamination of samples with hydrocarbon molecules was evident due to the C 1s spectra. The presence of a species near 286 eV in the fitted peak can be contributed to the C–N bond present in the porphyrin. Reference Makowski, Zemlyanov, Lindsey, Bernhard, Hagen, Chan, Petersohn, Medow, Wendel, Chen, Canter and Ivanisevic33 Due to the powder nature of the samples, the ability to distinguish between peaks in this region was difficult.
C 1s regional XPS spectra of (a) clean GaN powder, (b) clean, etched GaN powder, and (c) functionalized GaN powder.

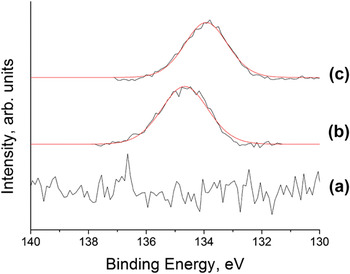
Evidence of the phosphoric acid used for etching was gathered from the emergence of a P 2p peak centered near 135 eV (Fig. 6). A high-resolution scan was performed to investigate whether this peak was only present in the samples that were etched. The functionalized sample would be expected to have a peak in this region both due to the phosphoric acid as well as the phosphonic groups that are present on the porphyrin molecule. As expected, the clean GaN powder showed no peak in the P 2p high-resolution scan, and both the etched and functionalized powder samples exhibited peaks in this region.
P 2p regional XPS spectra of (a) clean GaN powder, (b) clean, etched GaN powder, and (c) functionalized GaN powder.

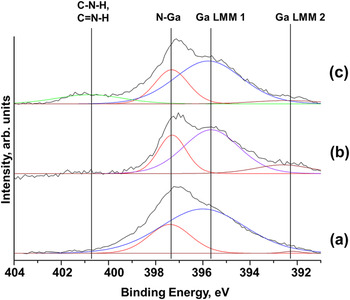
The presence of a peak attributed to amine and amide groups can be deduced from analysis of N 1s spectra. Reference Foster, Collazo, Sitar and Ivanisevic37 Macquet et al. investigated porphyrins without metal centers. Reference Macquet, Millard and Theophanides38 The expected value of the binding energies of the N 1s peaks was reported to be 400 and 398 eV. The calibration method used may account for differences in less than 1 eV. The N 1s peaks of thin film porphyrins were studied by Sarno et al. Reference Sarno, Matienzo and Jones39 The presence of a peak centered at around 400 eV for a porphyrin salt was reported by Silipigni et al. Reference Silipigni, De Luca, Quattrone, Scolaro, Salvato and Grasso31 All high-resolution data collected in the N 1s region of the functionalized samples showed evidence of charging. The etched and clean GaN powders both contained three species within the single N 1s peak, while the functionalized powder contained an additional peak at higher binding energy. The peak at this binding energy was attributed to a single species. For each sample, the N 1s peak that is attributed to N–Ga bonding was used for calibration because it is present in all samples. This peak is present close to 397 eV and was calibrated to 397.3 eV to account for the charging. Reference Carin, Deville and Werckmann26 The spectra of all three samples are shown in Fig. 7. Due to the Al Kα source used with the XPS instrument, there was an overlap between the Auger peaks of the Ga and the N 1s peaks. The Ga Auger peaks (LMM 1 and LMM 2) were present at lower binding energy than the N–Ga peak for each sample, around 395.4 and 392.1 eV. The functionalized sample contained a species centered near 400.8 eV, which was not present in any of the other samples. The presence of the amine groups found on TTP-PO3 contributes to this peak and provides evidence that GaN was successfully modified with the porphyrin derivative.
N 1s regional XPS spectra of (a) clean GaN powder, (b) clean, etched GaN powder, and (c) functionalized GaN powder. Peak assignments are displayed with the peak near 400.8 eV present only in the functionalized powder.

2. Infrared spectroscopy
FTIR signatures of GaN powders have been studied by a number of research groups. For example, Baraton and Gonsalves investigated the infrared spectra of both aluminum and gallium nitride for nanostructured powders. Reference Baraton and Gonsalves40 The synthesis of GaN nanowires was successfully accomplished by Wei and Shi, and evidence for this was gathered by FTIR. Reference Wei and Shi41 Shi and Xue obtained FTIR spectra for the determination of suitable growth conditions for GaN nanowires. Reference Shi and Xue42 This prior work has presented evidence of two strong peaks near 560 and 610 cm−1. The band at 560 cm−1 is attributed to the bond between gallium and nitrogen stretching in the material. Reference Shi and Xue42
Prior work on nanostructured GaN demonstrated high levels of uniformity and homogeneity. The samples in this study possess low homogeneity due to the milling method utilized for their preparation. Xiao et al. examined GaN powder Reference Xiao, Liu, Ma, Lin, Ma, Zong and Mei43 and reported a broad peak located between 500 and 700 cm−1 and discussed its varied position following different treatment temperatures. A second smaller peak was found near 1630 cm−1 that corresponded to GaN powder. A third medium-sized peak resided near 3410 or 3420 cm−1, the location of which depended on experimental parameters. The complexities involved in determining specific peak assignments for GaN have been previously examined in the literature. Reference Baraton and Gonsalves40 Additionally, a broad peak near 2100 cm−1 was assigned to Ga–H due to a nitrogen vacancy previously discussed by others. Reference Brandt, Ager, Gotz, Johnson, Harris, Molnar and Moustakas44
The two pellets with clean and functionalized powder were expected to show peaks consistent with the presence of GaN, whereas the pellet with just the porphyrin powder was expected to show an absence of these peaks. The spectra contain various common species at expected wave numbers including large peaks near 1650 and 1000 cm−1. Spectroscopic investigations on porphyrin molecules by Ogoshi et al. Reference Ogoshi, Nakamoto and Saito45 reported theoretically calculated FTIR peaks and assigned them based on the stretching or bending modes of the molecules. Santiago et al. gathered FTIR data between 1800 and 400 cm−1 for an iron porphyrin under various pH conditions. Reference Santiago, Moreira and Tabak46 The peak near 1000 cm−1 was attributed to the stretching mode, the P–O bond. A peak present near 1650 cm−1 was attributed to the stretching modes of the bond between the ring structure carbons and nitrogen within the porphyrin. Reference Ogoshi, Nakamoto and Saito45 Brennan et al. performed various spectroscopy techniques to compare functional groups for porphyrin attachment to TiO2. Reference Brennan, Portoles, Liddell, Moore, Moore and Gust28 The FTIR spectra that were obtained for the iron porphyrin under different pH environments showed the same peaks near 1650 and 1000 cm−1.
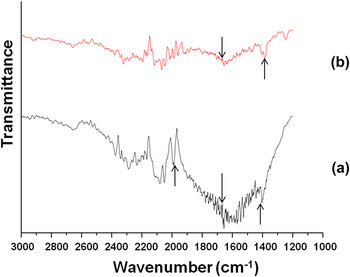
In all of our FTIR characterization, there was clearly evident peak broadening due to the nonhomogeneity of the aggregates in the powder. A broad peak resided near 550 cm−1. This peak is consistent with previously reported data that attributed its existence to the Ga–N bond stretching mode within the crystals. Reference Shi and Xue42 A small broad peak was evident near 2100 cm−1 as well, confirming GaN purity via stretching mode of hydrogen present in a nitrogen vacancy within the powder. Reference Brandt, Ager, Gotz, Johnson, Harris, Molnar and Moustakas44 Figure 8 confirms the two characteristic peaks of GaN through the broad peak near 550 cm−1 and the small peak near 2100 cm−1 for cleaned GaN powder. The presence of porphyrin was seen with a peak residing near 1000 cm−1 present only in functionalized GaN powder. The peak at 1000 cm−1 is attributed to the P–O–H bonds. Reference Brennan, Portoles, Liddell, Moore, Moore and Gust28 Additionally, a peak present near 1450 cm−1, attributed to the stretching of the C–N bond within the porphyrin ring, as well as a strong peak Reference Ogoshi, Nakamoto and Saito45 near 1650 cm−1 for C=N stretching mode within the porphyrin ring were recorded. Reference Santiago, Moreira and Tabak46
FTIR regional scan between 3000 and 1200 cm−1 of KBr mixed with (a) functionalized powder and (b) TTP-PO3.

3. Stability testing using fluorescence spectroscopy
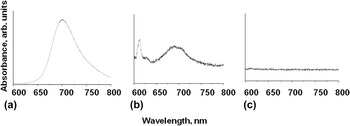
By utilizing a porphyrin adsorbate, the naturally strong fluorescent signal can be used to confirm successful functionalization both presoaking and postsoaking following the in situ procedure. The fluorescence spectra of porphyrin molecules have been well studied in a previous literature. Typically, porphyrin molecules possess distinct Soret bands near 430 nm as well as two Q-band peaks near 550 and 590 nm. Reference Brennan, Portoles, Liddell, Moore, Moore and Gust28 Emission peaks are expected near 620 and 670 nm as well. The spectral sweep used in this work started at 550 nm and moved to higher wave lengths, meaning the useful peaks, which would be expected to be present, and easily observed would be the emission peaks near 620 and 670 nm.
Typical fluorescence data gathered throughout our study are displayed in Fig. 9. The 7.125 μM solution of TTP-PO3 in DI water was used to provide a point of reference for investigating the presence of the porphyrin in other solutions. To investigate and compare this to the fluorescence of the functionalized sample, it was mixed with DI water and sonicated to disperse the powder particles of the sample. The two spectra were compared and expected to possess the same signature peaks. The difference in concentration of the two solutions as well as the nature of the solution (loose modified GaN powder versus dissolved porphyrin molecules) accounts for changes in intensity of the characteristic peaks. A small peak centered near 610 nm was seen in the shadow of an overwhelming peak at 690 nm for TTP-PO3 in water. The spectrum of the sonicated solution of the modified GaN powder showed peaks in the expected positions supporting the notion of successful functionalization of the semiconductor surface.
Fluorescence spectroscopy spectra of (a) 7.125 μM solution of TTP-PO3 in DI water, (b) sonicated solution of functionalized powder in DI water, and (c) wash of functionalized powder in DI water after 20 days.

A sample of the functionalized powder was left under ambient temperature and humidity in DI water for a period of 20 days to test for any possible porphyrin leaching in solution. The degree of stability was assessed by measuring the amount of any porphyrin dissolved in the water solution. We note that the powder exhibited the same characteristics shown in Fig. 6(b), even after the water soak. The soaking solution containing the functionalized powder was centrifuged to separate the particulates. The presence of leached TTP-PO3 in the solution would produce the characteristic porphyrin signature. The spectrum of the soaking solution shows no peaks at the expected wave lengths of 610 and 690 nm as seen in Fig. 6(c). The absence of these peaks supports the assessment that TTP-PO3 did not desorb from the GaN surface and dissolves into the water solution. This, in turn, provides evidence that the binding between the porphyrin and GaN is stable for at least 20 days within an aqueous environment.
IV. CONCLUSION
In conclusion, the attachment of a porphyrin derivative to GaN powder was performed using an in situ functionalization procedure. XPS analysis confirmed the existence of amine groups on the modified GaN powder. The presence of C–N and C=N peaks in the FTIR spectrum of the functionalized powder provided further evidence for the attachment of the porphyrin to the semiconductor surface. The stability of the bound porphyrin to the GaN interface was tested for a period of 20 days in water solution. No desorbed porphyrin was detected after the soaking period. We attribute this stability in solution to the covalent attachment of the porphyrin to the GaN powder surface. Future studies will focus on additional porphyrin derivatives containing metal centers due to their potential to enhance the optoelectronic properties of GaN.
ACKNOWLEDGMENT
We would like to acknowledge NSF support for the REU on Advanced Materials for Environmental Sustainability under grant EEC 1156762.