Sialic acid (SA) is a generic term for the N- or O-substituted derivatives of neuraminic acid, a monosaccharide with a nine-carbon backbone. These are widely distributed in animal tissues, mostly as glycoproteins and gangliosides. SA are known to engage in many biological events as a bound sugar at the terminal positions of glycans, viz., cellular interaction and communication, protection of macromolecules and cells from enzymatic and immunological attacks, recognition site for receptors, facilitation of microorganism colonization, action of pathogenic toxins, brain development, infant cognition and memory (Mudd et al. Reference Mudd, Fleming, Labhart, Chichlowski, Berg, Donovan and Dilger2017). The role and potential of milk SA in human nutrition, especially for the newborn and elderly is the subject of continuing research. Mammalian liver has the capacity to synthesize SA from simple sugar precursors, however, infants have limited capacity of de novo synthesis. Knowledge of SA content in the colostrum and milk of different mammalian species is emerging. Human milk is the best source of SA for an infant (Sprenger & Duncan, Reference Sprenger and Duncan2012) and published literature is dominated by the composition, structure and bioactivities of SA in the human milk. Corresponding information in the milk and colostrum of domestic animals is limited. This may be due to the fact that a number of factors may influence SA concentration in milk, such as species, geographical region, nutrition of the animal, genetics, lactation period or combination of these (de Sousa et al. Reference de Sousa, da Silva Vasconcelos, Costa, de Azevedo Filho, de Paiva and Queiroga2015). To our knowledge, no systematic information on the SA concentration in the milk of cattle and buffalo is available from India.
India ranks first in the buffalo population (108.7 million) and second in the cattle population (190.9 million) in the world (Livestock census, 2012). India continues to be the largest producer of milk in the world since last 15 years. More than 50% of the 164 million tons of milk produced in the year 2016–17 was contributed by buffaloes. Crossbred cattle produced more than 55% of total cow milk (DAHD, 2017). Cow as well as buffalo milk is commonly consumed in India. Human milk is considered as the gold standard for infant nutrition (Mudd et al. Reference Mudd, Fleming, Labhart, Chichlowski, Berg, Donovan and Dilger2017). Ideal option is breastfeeding, but is not always possible. Under constrained circumstances, milk of cow or buffalo is used in combination with breastfeeding or as a sole source for infant nutrition. Moreover, bovine milk products are frequently used in infant formulas.
Therefore, the aim of the present study was to compare systematically the content and distribution of SA in bovine milk at different stages of lactation. SA content in milk of indigenous (Sahiwal, Tharparkar) and cross bred (Karan Fries) cattle as well as Murrah buffalo was estimated at a single livestock farm, under similar management system using an identical methodology.
Materials and methods
The study was conducted on the animals maintained under intensive system of management at ICAR-National Dairy Research Institute, Karnal, India. Animals were selected from two breeds (Sahiwal and Tharparkar) of indigenous cattle (Bos indicus); a crossbred cattle, Karan Fries (Tharparkar × Holstein Friesian) and Murrah breed of buffalo (Bubalus bubalis). All the animals were healthy and were kept in the same housing system. Animals were allowed ad libitum access to the water. Diet regime was common for all animals and according to the standard practices for gestation and lactation.
Milk samples from 41 animals were collected. These comprised 16 of Sahiwal, 6 of Tharparkar, 11 of Karan Fries and 8 of Murrah. Sample collection was done simultaneously from all the groups. Colostrum was collected within 12 h of calving. Mature milk was collected from the mid-lactation stage animals (120–140 d). Collection from an animal was continuously done for three days to ensure a representative sample. Cows were hand-milked and milk of all the four quarters was pooled. No milk-letting agent was administered. Each day milk samples were transferred to 250 ml sterile plastic bottles and were stored at −20 °C. Samples were thawed prior to analysis. A homogeneous milk sample for each animal was made by pooling samples of all the 3 d. Only one freeze-thaw was done prior to SA quantification. Colostrum samples were diluted five times with water.
SA concentration was assessed to determine free and total SA using a commercial kit with colorimetric detection (KA1655; Abnova GmbH, Germany). Instructions described by the manufacturer were followed. This kit uses a method, in which SA is oxidized to formylpyruvic acid which reacts with thiobarbituric acid to form a pink coloured product. The colour intensity at 549 nm is directly proportional to SA concentration in sample. Linear detection range in 96-well plates is 5–1000 µm and limit of detection is 5 µm. Standard curve was prepared for SA (0–1000 µm). The quantity of bound SA was calculated as the difference between total and free SA concentrations.
The data were analysed using the SPSS 10.0 software package (SPSS Inc., Chicago, Illinois, USA). The mean values obtained in the different groups were compared by one-way ANOVA (followed by post hoc test), assuming that there were significant differences between mean values when statistical comparison gave P < 0.05.
Results and discussion
Sahiwal and Tharparkar breeds were selected to be the representative of Indian milch cattle (Bos indicus). India's rich cattle bio-diversity is reflected in 41 well-defined breeds of cattle (AGRI-IS, 2018). Only five of these are milch breeds (Sahiwal, Gir, Red Sindhi, Tharparkar and Rathi) and the remaining all belong to draught or dual purpose breeds. Crossbreeding programme with high milk producing Bos taurus cattle was initiated in India to gain a boost in the milk production (Singh, Reference Singh2016). At present, India has 151.17 million indigenous cattle and 39.73 million exotic/crossbred cattle (Livestock census, 2012). These efforts transformed India from a milk-deficient nation into the largest milk producer in the world (DAHD, 2017). Murrah was selected as it is the most renowned breed of buffalo for milk production in India. Murrah bulls are extensively used in upgrading low producing buffalo stock to improve buffalo milk production (DAHD, 2017).
Various analytical methods have been reported for estimation of SA (Lacomba et al. Reference Lacomba, Salcedo, Alegría, Lagarda, Barberá and Matencio2010). Chromatographic techniques allow differentiation of the two principal SA structures (Neu5Ac, Neu5Gc). Mass spectrometry (MS) methods give better results being selective, accurate, precise, linear and additional information can be obtained on the SA moiety. The increased specificity and sensitivity of chromatographic and MS methods are at the price of complex treatment of samples, extended time of analysis, requirement for expensive equipment and highly skilled personnel. Spectrophotometric methods have been the popular choice for SA quantification, in view of their advantages of being straightforward to apply and use of relatively inexpensive equipment (Lacomba et al. Reference Lacomba, Salcedo, Alegría, Lagarda, Barberá and Matencio2010). Unfortunately, there are many components that may interfere with the assays, and these can limit their application to complex matrices. Aim of current investigation was restricted to the quantification of SA, thus commercial kit based on spectrophotometric method was selected which had added advantage of being rapid and simple.
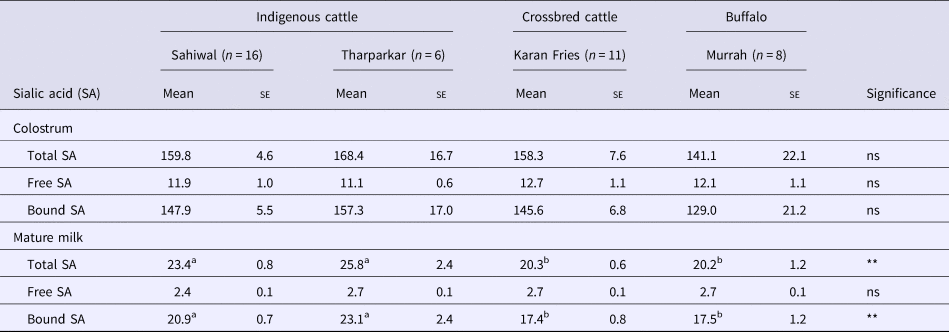
The concentration (mg/100 ml) of total, free and bound SA (mean ± se) across the investigated groups is presented in Table 1. Among cattle, total SA content (mg/100 ml) varied from 158.3 ± 7.6 (crossbred) to 168.4 ± 16.7 (Tharparkar) in colostrum. Overall differences in colostrum were not significant (P < 0.05) between the indigenous and crossbred cows.
Sialic acid concentration (mg/100 ml) in milk of indigenous cows (Bos indicus), crossbred cows (Karan Fries) and buffalo

Within a row, values with different superscripts are significantly different. ns – non significant; **P < 0.01
SA concentration declined substantially in the mature milk. Lactation period is an important factor affecting milk composition. Concentration of SA also varies during lactation (Useh et al. Reference Useh, Olaniyan and Nok2008). Thus, mid-lactation stage was selected for mature milk, as it corresponded to the stable phase of lactation curve. Several fold reduction was observed in the total SA as well as free SA concentrations. Total SA reduced by 6.8 fold in Sahiwal, 6.5 fold in Tharparkar and 7.8 fold in Karan Fries. This decline was consistent with the data reported by Useh et al. (Reference Useh, Olaniyan and Nok2008), for the SA levels in colostrum and milk of bovines, goats and sheep. SA content in human colostrum was also observed to be five times higher than that in the mature milk (Wang et al. Reference Wang, Miller, Sun, Ahmad, McVeagh and Petocz2001). Enzymes involved in the synthesis of SA and its incorporation into complex molecules may form biological basis for the decrease of milk SA throughout lactation (Kun-Tian et al. Reference Kun-tian, Li-na, Ya-qi and Shi-fen2008). Breed difference for mature milk SA was not significant for investigated Indian cattle breeds, Sahiwal and Tharparkar. Differences were observed between the Indian cattle and the crossbred cattle. Milk of indigenous cattle was comparatively enriched in total and bound SA (Table 1). However, free SA concentration was similar across the cattle groups.
Total SA in the colostrum of Murrah buffalo was 141.1 ± 22.1 mg/100 ml (Table 1). Majority of it was bound SA (91.4%). Total SA in mature buffalo milk was 20.2 ± 1.2, which was lower than both the Indian cattle breeds. Accordingly, cow milk obtained from Sahiwal and Tharparkar cattle had higher concentration of bound SA than the buffalo milk. However, differences in total, bound or free SA in buffalo milk were not significant as compared to the crossbred cattle (Table 1).
The observed concentrations of total and free SA in the indigenous and crossbred cattle as well as buffalo mature milk were lower than that in human milk, where it varied from 1 g/l in transition milk to 0.3 g/l in mature milk (Mudd et al. Reference Mudd, Fleming, Labhart, Chichlowski, Berg, Donovan and Dilger2017). It is difficult to compare the results of current study with the published reports on bovine milk, since factors such as maternal breed and quantification methodologies (fluorescence, colorimetric and HPLC) varied across the studies. All together, these reflected in a wide range of values (15–500 mg/l) reported for total SA concentration in bovine milk (Mudd et al. Reference Mudd, Salcedo, Alexander, Johnson, Getty, Chichlowski, Berg, Barile and Dilger2016).
Results of the current investigation were different from the previously reported values of SA concentration in the Indian cattle. Neelima et al. (Reference Neelima, Rao, Sharma and Rajput2012) reported SA concentration in the different breeds of cows and one breed of buffalo by fluorimetric method. SA content on dry mass basis varied in the range of 1.68–3.93 g/kg and was dependent on the breed. SA in Sahiwal cattle was less than 50% of that in Tharparkar cattle. Whereas, Karan Fries and Tharparkar had similar levels of SA. Our observations were altogether different. Sahiwal and Tharparkar had similar levels of SA (Table 1). Meanwhile, Karan Fries (crossbred) had significantly lower concentration of SA as compared to the above mentioned breeds of Indian cattle. It is important to mention that SA content of buffalo reported by them (3.14 ± 0.05 g/kg) was also much higher than that estimated in the current study (Table 1). In fact, SA content reported by Neelima et al. (Reference Neelima, Rao, Sharma and Rajput2012) for both cattle and buffalo was significantly higher than the values reported in the literature (Koliwer-Brandl et al. Reference Koliwer-Brandl, Siegert, Umnus, Kelm, Tolkach, Kulozik, Kuballa, Cartellieri and Kelm2011) for the bovine milk (0.19 to 2.30 g/kg). Another study by Karunanithi et al. (Reference Karunanithi, Radhakrishna and Biju2013) reported total SA (mg/100 ml) on the basis of three random individual milk samples in Indian cow, crossbred cow and buffalo to be 22, 30.1 and 26.6, respectively. Results obtained in the current study fall within the reported range of bovine SA concentration. Differences in the SA content from earlier study of Neelima et al. (Reference Neelima, Rao, Sharma and Rajput2012) may be attributed to the difference in the sample selection as well as sample size. Only three pooled milk samples per breed, collected on different days were considered in their study. Present study was based on a larger sample size. Moreover, selection of animals minimized variables such as diet, season, lactation stage and health of animal.
Taken together, these results suggest that mature milk of Indian cattle may be a better source of total and bound SA as compared to milk of crossbred cattle or buffalo. Future investigation should seek to characterize SA concentration by including more breeds to substantiate current findings. SA is a bioactive compound and can add value to the milk and milk products derived from indigenous cattle.
Acknowledgements
The authors wish to thank Director, National Dairy Research Institute, India, for granting permission to collect milk samples and Director ICAR-NBAGR, Karnal for extending logistic support.
Financial support
None.