1. INTRODUCTION
In 1870 Uruguay was a small economy, with an area of 176,215 km2 — half the area of present-day Germany, almost 75 per cent of the United Kingdom, 32 per cent of France and 35 per cent of Spain — and just 343,000 inhabitants (Argentina recorded a population five times higher in the same year). In spite of these very small dimensions, Uruguay was part of the richest economies of the world, received abundant productive factors from abroad (labour and capital) and constituted one of the «promised lands» of the first wave of the commercial and financial globalisation.
In the eve of the First World War (WWI), Uruguay was the second Latin American country in the ranking of foreign investment per capita (302 U.S. dollars), only exceeded by Argentina (420 dollars) but almost doubling the figure of the third-placed country (Cuba) (Bértola and Ocampo Reference Bértola and Ocampo2010, p. 138). Regarding the origin of the capitals, the United Kingdom represented 43 per cent of the total, being the absolute leader among the core of the world economy (France, Germany, the United Kingdom and the United States, which accounted for 99 per cent of this total). In fact, «few countries were so completely absorbed by the informal British empire» as Uruguay (Finch Reference Finch1980, p. 146)Footnote 1 . Railways were probably one of the main expressions of this process, as Uruguay ranked in the second place among Latin American countries in terms of mileage per capita throughout the period (as before, the leader of the ranking was Argentina) (Herranz-Loncán Reference Herranz-Loncán2011). This attraction of capital inflows extended to other productive factors such as labour, but the dynamism changed rapidly.
Immigration rates of the initial decades (1870-1890) were among the highest of the Americas (even exceeding those corresponding to the United States and Argentina), but on the eve of WWI the situation had changed and in some years Uruguay even registered negative net migration rates. In 1901-1910 the average immigration rate was 21/1000 , whereas in the same period the rates of Brazil, Argentina, Canada and the United States were 34, 311, 154 and 103/1000, respectively.
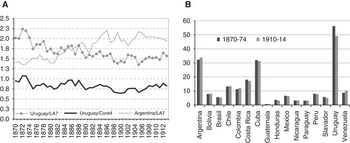
Under these conditions, Uruguay achieved high levels of per capita incomes on a world scale. At the beginning of the period, Uruguay presented levels that were equivalent to those from the core of the world economy (France, Germany, the United Kingdom and the United States). The posterior evolution was irregular and during the 1890s moved away from that club, recovering a (modest) convergent path after the start of the 20th century (Figure 1A).
ECONOMIC PERFORMANCE, 1870-1914. A. Income per capita in relation to LA7 and Core4. B. Exports per capita (1913 dollars) Sources: Maddison (Reference Maddison2003) and Federico and Tena-Junguito (Reference Federico and Tena-Junguito2015).

In the context of the Latin American region, the trajectory was quite different. Uruguay doubled the Latin American (LA7) average in 1870 and the income gap was 74 per cent in favour of Uruguay during the 19th century (1870-1899), although with a clear decreasing trend until the beginning of the 20th centuryFootnote 2 . In other words, Uruguay maintained a privileged situation with respect to the rest of Latin America during the First Globalization, but the huge initial advantages were reduced during the Belle Époque. This path contrasts with the trajectory registered by Argentina which, in spite of having similar factor endowments, presented a successful and divergent evolution with a clear upward trend. The progressive lag showed by Uruguay in terms of economic performance does not seem to run concurrently with a similar process in the external sector of the economy.
According to Federico and Tena-Junguito (Reference Federico and Tena-Junguito2014), in 1870-1874 Uruguay led the Latin American ranking of per capita exports (Figure 1B) and the position did not change throughout the period. However, Uruguay presented one of the worst performances with a decrease of 13 per cent that contrasts significantly with Argentina (which experienced an expansion of 4 per cent) or the Latin American average (which decreased only 3 per cent).
This evolution occurred in a regional context characterised by deep transformations during the second half of the 19th century. Those territories with «open frontiers», imprecise definitions of national borders, predominant liberal economic policies and large «empty» areas of land, generally practised open policies especially for capital and labour demands that fostered technological progress. The institutionalisation of countries as independent and formalised states was encouraged by the spread of the railway network, «closing» frontiers and «nationalizing» internal spaces that, together with the spread of the telegraph, made national control of the territory and the different (and often distant) provincial jurisdictions possible. However, these processes were not always favourable for Uruguayan development and especially for its commercial elite.
Some external shocks such as the new modern development of Buenos Aires’ port during the two final decades of the 19th century produced a partial substitution of Montevideo’s entrepôt activity. Buenos Aires’ technical improvements in terms of transport, storage and harbour logistics were complemented by the expansion of the Argentinian railway network. At the beginning of the 1890s Montevideo still resisted and showed commercial advantages in comparison with Buenos Aires, although this situation changed radically afterwards. The significant weakening of transit trade, the birth of protectionist policies, changes in the relative power of elites, and the financial consequences related to the Banco Nacional crisis constituted far-reaching changes in the economic external relations of Uruguay from the mid 1890sFootnote 3 .
Conventional wisdom presents the deficient export development as an explicative variable of Uruguay’s relatively bad performance during the Belle Époque years. Here we propose turning the argument the other way around: the relatively slow export growth and modest structural change of the Uruguayan economy is a clear signal of a low institutional and political capacity to promote those commodity sectors with higher value added. Uruguay did not take advantage of the opportunities that globalisation offered during the Belle Époque Footnote 4 . This process could be determined by several factors that acted with different intensity through the period in terms of natural endowments (essentially the types of lands), delayed incorporation of new technology (especially in the meat packing plants) and the incidence of measures of economic policy in an international market where trade protection gathered pace.
One of the first outcomes of this paper is to discuss the accuracy of the official Uruguayan export growth data. The bad reputation of the accuracy of 19th-century Latin American foreign trade statistics should be extended to UruguayFootnote 5 . The Uruguayan statistical bureau in charge of computing the value and quantity of export flows was relatively efficient but, like many other bureaus, was not able to avoid different relevant biases that affected physical quantities and unit values recorded in the statistics. These problems were even recognised in the Statistical Yearbooks published by the bureau. First of all, transit operations usually meant severe difficulties for export and import registrations and national statistical agencies frequently failed to identify the geographical origin and destination of commodities correctly. Second, export and import taxes, trade licenses, quantity limitations and exchange rate restrictions, as well as the non-reporting of some trade flows (typically smuggling), may severely affect quantities and price records, which means that trade records may offer a systematic undervaluation or overvaluation bias that should be corrected. Two revisions of the official data have been attempted so far; these are a book written by Henry Finch in 1980 and a conference paper by Belén Baptista and Luis Bértola presented in 1999. Are these evolutions coherent with historical facts? Can we trust these series as an accurate description of the export performance of Uruguay’s economy?
Henry Finch, in his book Historia económica del Uruguay contemporáneo, presents a revision of the official export values, but for only 3 years of the period 1870-1913 (1900, 1910 and 1913). The aim of his revision is to try to solve the problem of the use of official prices in the valuation of exported goods. Finch makes some «raw adjustments to official values» (footnote to table 5.1, Reference Finch1980, p. 260) for the years 1900 and 1910 using market pricesFootnote 6 . It also includes an official estimate of the export value at market prices for 1913Footnote 7 .
Luis Bértola and Belén Baptista propose a new series of adjustments to official data for the period 1870-1913. The authors work with a sample of thirteen exported goods, which represented 88 per cent of exports in 1913, and adjust the prices used to value them in order to express the series at local market pricesFootnote 8 . As for quantities, the only correction made refers to exports of live cattle for which an attempt was made to include smuggling across the border with Brazil. The goods that receive greater attention in the adjustments are live cattle (for which data are adjusted for the period 1870-1912) and wool (which is corrected for 1885-1912). These two goods represented on average only 34 per cent of the exports for the whole period. Therefore, most of the adjustments were made for the period 1905-1912, which explains why before 1905 differences between their adjusted series and the official one are minor.
Following this introduction and motivation, we order the article in the following sections. Initially, we consider the incidence of transit trade and smuggling in the statistics of exported quantities and correct the structure of exports by geographical destination. Second, we revalue the official unit values with international prices and discuss the consistence of the bias found with the political economy interest of exporters to evade taxes. We focus especially on the period 1888-1892 when trade regulations changed significantly and promoted transformations in the taxation by type of good. In the fourth section the new export series is used to present a new interpretation of the Uruguayan export-led failure. Finally, the last section is devoted to summarising the most relevant results of the investigation.
2. TRANSIT AND RUSTLING: THE ACCURACY OF EXPORT QUANTITIES
Montevideo and Buenos Aires played important roles as transit ports during the 18th and 19th centuries and even nowadays both ports maintain a fluent commodity exchange based on entrepôt relationships. We find several mentions of transit trade in the Statistical Yearbooks, which reveal the relevance of the topic during our period.
«In the previous publications of this Direction, we have proven that most part of the commercial movement between Argentinian Republic and Uruguay is constituted by transit trade of products and manufactured goods from foreign countries, whose products and merchandise are transported from Custom warehouses or reshipped from an Uruguayan port to an Argentinian port or from one of these latter to an Uruguayan port. […] The same occurs with the tables of exports by destination, which include goods of the country similar to those of the Argentinian Republic, exported to that Republic which does not consume them but re-exports them in transit to consumer countries»Footnote 9 .
(Statistical Yearbook 1886, p. 274)
That is, Montevideo’s harbour, because its special geographical position at the mouth of Rio de la Plata (River Plate), had a significant economic activity as an entrepôt linking Argentina, Paraguay, Bolivia and the south of Brazil with international markets (Zanotti Reference Zanotti1992). The relevance of this commercial activity is also noticed by Platt (Reference Platt1971): «Before the improvement of the port of Buenos Aires, late in the nineteenth century, a substantial proportion of Argentine imports was transhipped from ocean steamers at Montevideo, but the new docks reversed the flow, so that Uruguayan imports might now arrive through Buenos Aires» (Platt Reference Platt1971, pp. 119-120).
We believe that this prosperous activity caused problems for national trade statistics. Transit operations usually meant severe difficulties for export and import registrations, and national statistical agencies frequently failed to identify the geographical origin and destination of commodities correctly.
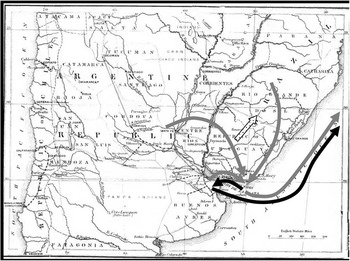
In Figure 2 we represent the two flows of transit trade that affect official Uruguayan export records: Uruguayan products exported through the port of Buenos Aires (black arrow), and regional products exported via Montevideo’s harbour (grey arrows) from Argentina and Brazil and adjoining regions (such as Paraguay and Bolivia). According to Statistical Yearbooks, both transit trades through Montevideo and through Buenos Aires are incorrectly registered in official Uruguayan statistics.
TRANSIT TRADE AND SMUGGLING IN THE RIVER PLATE REGION Source: map from Mulhall and Mulhall (Reference Mulhall and Mulhall1975), pp. 65-66; arrows added by the authors.

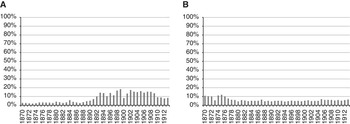
Especially during the period 1889-1909, the importance of Uruguayan goods exported via Buenos Aires remained between 10 and 20 per cent of total Uruguayan official exports (Figure 3A).
TRANSIT TRADE BUENOS AIRES-MONTEVIDEO, 1870-1913. A. Share of Uruguayan exports through Buenos Aires on total Uruguayan exports. B. Share of transit exports through Montevideo on total Uruguayan exports Sources: calculated with official data from the Statistical Yearbooks (several years).

Apparently, Uruguay exported goods that Argentina did not consider imports from Uruguay, and re-exported these commodities to other geographical destinations. The magnitude of these figures is large enough to induce statistical problems in the series and, specifically, in the geographical distribution of Uruguayan exports.
Transit trade through Montevideo was also important during this period (Figure 3B) reaching an average of 6 per cent of total Uruguayan exports (Appendix 2). This merchandise exported through Montevideo’s port was in fact produced in Argentina and Brazil, but was wrongly added to Uruguayan export statisticsFootnote 10 .
Transit trade is a statistical problem related to accuracy in quantities. We deal with these transactions and consider adequate adjustments to correct official data. First, we evaluate the export accuracy according to the standard method proposed in the literature (the country accuracy index (CAI)) and then we identify the dynamics of under and overvaluation of official export data. Corrections are subsequently proposed to improve the accuracy of the statistics.
Following studies by Federico and Tena-Junguito (Reference Federico and Tena-Junguito1991), Tena-Junguito (Reference Tena-Junguito1992), Carreras-Marín and Badía-Miró (Reference Carreras-Marín and Badia-Miró2008) and Tena-Junguito and Willebald (Reference Tena-Junguito and Willebald2013), we apply the partner records CAI to test the accuracy of Uruguay’s export records.
We employ official bilateral data in current pounds sterling (see exchange rates in Appendix 1). We compare the official export records of Uruguay by countries with the imports of the same flows recorded by the official statistics of Argentina, Belgium, Brazil, France, Germany, Italy, Spain, the United Kingdom and the United States. These countries account for <80 per cent of the geographical distribution of Uruguay’s total exports during the period, reaching in several years <95 per cent (Appendix 2 for construction of the index).
 $$CAI_{t} ={{\mathop{\sum}\nolimits_{j=1}^n {X_{{jt}} } } \over {\mathop{\sum}\nolimits_{j=1}^n {M_{{jt}} } }}$$
where, X j,t stands for Uruguayan exports to country j in year t according to Uruguayan official statistics; M j,t stands for imports of country j from Uruguay in year t according to its own official statistics.
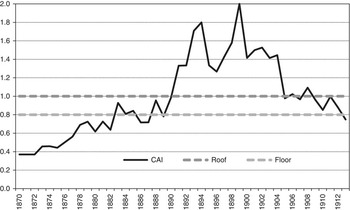
The «accuracy index» for year t is computed as the ratio of the total trade sum of Uruguayan exports to the countries in the sample, according to its official statistics, with respect to the same flows according to the import statistics of its partners in that year. The difference between the numerator and denominator of this ratio includes a transportation cost component, that is, the difference between c.i.f. valuation of import records and f.o.b. valuation of exports. According to Federico and Tena-Junguito (1991), the percentage of transportation cost and insurance (the so-called «freight factor») depends more on the commodity composition of trade than on its geographical distribution. Following the results found by Tena-Junguito and Willebald (Reference Tena-Junguito and Willebald2013) for Argentina, and considering that the commodity composition of Uruguayan and Argentinian exports in the period were quite similar, the CAI is presented with an interval from 0.80 (the «floor») to 1 (the «roof»)Footnote 11 . Results over or below this interval are considered to represent an over or undervaluation of the export series, respectively.
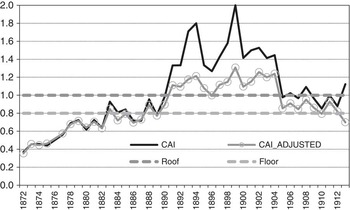
According to the evolution of the CAI (Figure 4), two important periods of inaccuracy are identified. From 1870 to 1882 official Uruguayan export data would be undervalued, while from 1891 to 1904 an important overvaluation would have taken placeFootnote 12 . In the usual context where authorities set registration prices for exports and they were not regularly modified (see Federico and Tena-Junguito 1991) the common finding is that the CAI and export prices evolved in opposite directions. As export prices decrease and the official prices are maintained fixed the CAI tends to increase because the valuation of imports in the partner countries assimilates the changes while the export valuation does not. The contrary happens when export prices increase.
COUNTRY ACCURACY INDEX (CAI), 1870-1913 Source: Appendix 2.

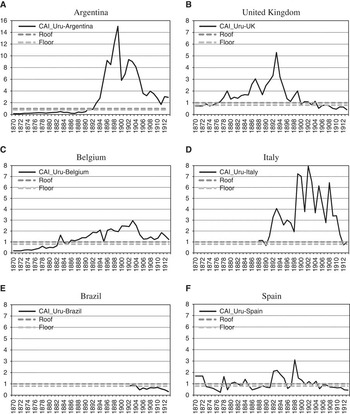
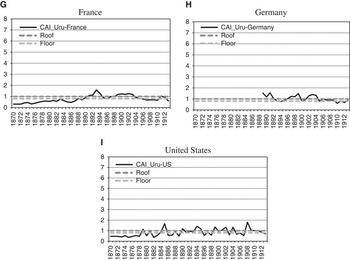
Taking into account their relevance as destinations (Figure 5), the most important results to note are the considerable overvaluation of the exports to Argentina in the period 1893-1913, along with the lack of Brazilian, German and Italian trade records (before 1902, 1889 and 1888, respectively) which, strictly speaking, is a problem of their statistics. The persistent overvaluation of exports to Belgium from 1886 onwards is also noticeable, which may be due to the fact that Antwerp operated as a transit port. The same may apply to the overvaluation registered for the United Kingdom in the period 1878-1899, and for Italy from 1891 onwards (especially related to the port of Genoa).
COUNTRY ACCURACY INDEX (CAI) BY PAIRS OF COUNTRIES, 1870-1913. A. Argentina. B. United Kingdom. C. Belgium. D. Italy. E. Brazil. F. Spain. G. France. H. Germany. I. United States Source: Appendix 2.

(Countinued). Source: Appendix 2.

Platt (Reference Platt1971) enumerates and describes many cases of transit ports, such as Antwerp: «Antwerp was one of the principal markets for hides, horns and cattle products generally, to which large quantities were exported by Argentina and Uruguay, later to be shipped on to Britain» (Platt Reference Platt1971, p.120).
These detected mismatches correspond to the usual criterion used in the period to register the origin and destination of traded merchandise. In the case of exported merchandise, the usual registered destination was the first port to which the merchandise was sent, whereas in the case of imported merchandise, the registered origin was the last port from which it had arrived. For the same reason, the accuracy of exports to a typical final destination — such as France, Germany and Spain — results in acceptable levels.
From the previous analysis, the opportunity to adjust Uruguayan export data to Argentina, removing the amount corresponding to transit exports, becomes clear. As these figures are Uruguayan exports anyway, it also becomes necessary to reassign them to their final destinations. In order to do so, we assume that this type of exports follows the same geographical distribution as the rest of Uruguayan non-regional exports (Appendix 2).
Acknowledging the problems of accuracy in official Argentinian data, we used the price accuracy index (PAI) from Tena-Junguito and Willebald (Reference Tena-Junguito and Willebald2013) to revalue Argentinian imports from Uruguay.
The other important problem we faced was the lack of Brazilian data for imports from Uruguay for the period previous to 1902. We have available data for Brazilian imports from Uruguay for the years 1866 (from the U.K. Board of Trade — Foreign Countries) and 1902 (Official data), so these two figures were interpolated, assuming that the evolution in the period was the same as the one registered by Uruguayan exports to Brazil. So we filled in the data for Brazilian imports from Uruguay for 1870-1901 and recalculated the corresponding CAI.
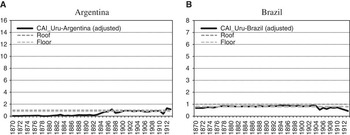
After completing these calculations (sources and assumptions in Appendix 2), we obtain the following results with respect to bilateral Accuracy Indexes with Argentina and Brazil (Figure 6). Adjustment of the Argentinian CAI is surprising, showing the high importance of transit trade through Buenos Aires. The movement of the Brazilian CAI shows a stable evolution at reasonable levels.
BILATERAL COUNTRY ACCURACY INDEX (CAI) WITH ARGENTINA AND BRAZIL, ADJUSTED, 1870-1913. A. Argentina. B. Brazil Source: Appendix 2.

We also assign data for Germany and Italy for the 1880s. In both cases, the official statistics identify a category «River Plate» that we presume refers to imports coming from that region including, indistinctly, commodities form Argentina and Uruguay. Basically, we assign the average share of imports that corresponds to Uruguay in recent periods according to local registers. For Germany, available import data that differentiate Argentina from Uruguay correspond to 1890-1891 and 1893-1895, and for Italy figures correspond to 1888-1892; this structure is applied to the corresponding category «River Plate» in the 1880s.
Finally, the last problem to unravel refers to the role of Montevideo as the «external door» of the River Plate region. According to diverse expressions of the Statistical Yearbooks and contemporary commentaries, Uruguayan statistics usually included commodities not produced locally but in other parts of the River Plate region (Argentinian seacoast and the south of Brazil). These inaccurate records should not affect the CAI because the commercial partner would have made the same error registering imports from Uruguay instead of their true origins. However, the existence of transit trade in European ports can also represent overvaluation. We find data of this type of trade from Statistical Yearbooks corresponding to 1872-1874, 1879-1881 and 1914-1917. We estimate annual data combining interpolation and rescaling methods in different periods (Appendix 2).
The last trade flow represented in Figure 2 is smuggling towards Rio Grande do Sul (south of Brazil), consisting mainly of live cattle (dashed arrow), that obviously affected official export registers. Rustling was an historical activity in the territory — from colonial times — that involved actors from Uruguay, Argentina and Brazil at times when the national border in the frontier economies had no precise definition. Just well into the 19th century the consolidation of the state advanced on the national construction of a vast region, where free transit of people and commodities had been the dominant pattern so far. The First Globalization coincided with advances in this process and smuggling started to be penalised by national states with more rigour.
We correct official data adding estimates for the volume of smuggling of live cattle following Bértola et al. (Reference Bértola, Calicchio, Camou and Rivero1998) and Baptista and Bértola (Reference Baptista and Bértola1999) and considering official prices as good proxies for market prices. Estimates combine a fixed value (100,000 heads of cattle) plus a variable value depending on official data (25 per cent over official registers). With this criterion, the authors obtain an average for the period which is consistent with contemporary declarations (200,000 heads of cattle; see Millot and Bertino Reference Millot and Bertino1996) and a series that changes in a similar way to legal exports.
With all these corrections made, changes in the CAI do not modify our general evaluation (Figure 7) but the levels of the discrepancy are now more acceptable. This adjusted CAI shows an improvement of the export statistics’ accuracy, demonstrating the appropriateness of our hypotheses.
ADJUSTED COUNTRY ACCURACY INDEX (CAI), 1870-1913 Source: Appendix 2.

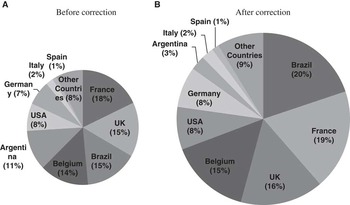
To sum up, we propose five corrections to deal with inaccuracy in quantities and detect problems of under and overvaluation, considering: (i) Uruguayan exports traded through Buenos Aires to Europe; (ii) correction of Argentinian imports from Uruguay with the Argentinian PAI; (iii) estimates of Brazilian, German and Italian imports from Uruguay (1870-1901, 1880-1888 and 1880-1887, respectively); (iv) regional exports (from Argentina, Brazil, Paraguay, Bolivia) in transit through Montevideo’s port that official data consider as local production; (v) smuggling of cattle from Uruguay to Brazil. Only the two last corrections alter the total value of exports because they change the quantities traded; we will pay attention to this point in the adjusted series presented in the last section previous to the conclusions. Nonetheless, all of these corrections imply changes in the Uruguayan export structure by countries (Figure 8).
GEOGRAPHICAL DISTRIBUTION OF URUGUAYAN EXPORTS, 1872-1913 (average percentage). A. Before correction. B. After correction Source: Appendix 2.

Considering the average of the period (1872-1913), the most important change in export structure is the decline in the share of Argentina. According to official data it represented 11 per cent of total Uruguayan exports; after our correction this share falls to only 3 per cent, in favour of Brazil and typical European destinations such as the United Kingdom, France and Belgium. This result of our correction seems reasonable. Argentina and Uruguay had similar productive structures and, in times when trade was predominantly inter-industrial, the relevance of Argentina as such an important trade partner did not make any sense. The types of goods exported to Brazil are relevant to understand the high share of this country. Salted beef (tasajo) and live cattle exports correspond to an «old» commercial specialisation in times when the «new» paradigm was to export refrigerated meat and cereals (as Argentina did; see Tena-Junguito and Willebald Reference Tena-Junguito and Willebald2013, for a recent review)Footnote 13 .
Therefore our main conclusions from the previous analysis refer to four main issues: (i) transit trade in the River Plate region induced important accuracy problems in the export statistics of Uruguay in terms of traded quantities; (ii) the largest problems corresponded to the 1890s when transit through Montevideo was in clear decline and Uruguayan exports left the region of the River Plate through Buenos Aires; (iii) an additional source of inaccuracy during this period would correspond to transit trade within Europe through the typical European entrepôts and the inaccurate registration of countries of final destination (commodities similar to those coming from Argentina but noticeably inferior in quantities); (iv) the high relevance of Brazil as a trade partner in times when the rich and more dynamic markets were located in Europe.
3. POLITICAL ECONOMY OF TAXES AND THE ACCURACY OF EXPORT VALUES
Having addressed problems related to inaccuracies in the registration of quantities in the previous section, we now proceed to test the accuracy of prices used to valuate exported merchandise. The prices used to valuate exported goods, calculated from the official Statistical Yearbooks, are compared with international prices, considering as proxies prices used in the United Kingdom’s official statistics to valuate imports from Uruguay. We do so using an index, called the PAI, which is defined as follows (see Appendix 4 for construction of the index):
 $$PAI_{t} ={{\mathop{\sum}\nolimits_i {P_{{it,{\rm UY}}} {\times}Q_{{it,{\rm UY}}} } } \over {\mathop{\sum}\nolimits_i {P_{{it,{\rm UK}}} {\times}Q_{{it,{\rm UY}}} } }}$$
where, P it,UY is the price of good i exported in year t according to official Uruguayan statistics; P it,UK the price of good i imported from Uruguay in year t according to statistics from the United Kingdom; Q it,UY the quantity exported of good i in year t according to official Uruguayan statistics.
We value exported goods at international prices based on the price demand theory. We consider that the quality of Uruguayan goods exported to high-income markets tended to be superior to that corresponding to the local market. We then assume that Uruguayan export prices were more closely related to international prices than to domestic ones (Borcherding and Silberberg Reference Borcherding and Silberberg1978; Hummels and Skiba Reference Hummels and Skiba2004) (see Appendix 4 for a detailed explanation).
A sample of ten products is considered: preserved meat (other than by salting), salted beef (tasajo), meat extract, frozen bovine meat, frozen mutton and lamb meat, hides (not tanned), sheep and lamb skins and furs, wool, maize and wheat. These goods account in mean for 80 per cent of total Uruguayan exports during the period (according to official data).
Taking into account that prices of exported goods used in Uruguayan statistics are valuated f.o.b., while prices of imported goods used in statistics from the United Kingdom are valuated c.i.f., a few adjustments were introduced to make this comparison possible. International prices were adjusted deducting from them the cost of freight and insurance per unit of good. We also express prices from official Uruguayan records in pounds sterling in order to be able to compare them with prices from the United Kingdom’s official statistics (exchange rates in Appendix 1).
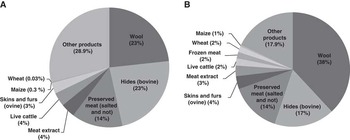
The structure of Uruguayan exports by type of good in international prices is presented in Figure 9, comparing the situation at the beginning and the end of the period of analysis. The observation of the two figures reveals some major differences, such as the increase in the importance of wool, which almost doubled its weight in total exports, and the decrease in the importance of hides. Other products, such as preserved meat, retained their importance during the whole period.
DISTRIBUTION OF URUGUAYAN EXPORTS BY TYPE OF GOOD (average percentage, adjusted data). A. 1870-1879. B. 1900-1913 Source: Appendix 4.

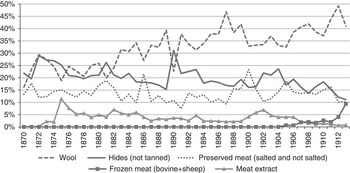
A more complete visualisation of the changes can be obtained from Figure 10, which shows the annual weight of the main exported products.
DISTRIBUTION OF URUGUAYAN EXPORTS BY TYPE OF GOOD, MAIN GOODS, 1870-1913 (percentage, adjusted data) Source: Appendix 4.

Uruguayan exports are concentrated in three products: wool, bovine hides and preserved meat (salted and not salted), which represent on average 66 per cent of total exports during this period. The evolution of the exports of these three products has been quite different. Although in the early 1870s wool and bovine hides accounted for the same percentage of total exports (23 per cent), the weight of wool did not stop growing during these years, while the opposite happened to hides. At the end of the period, the weight of wool more than doubled that of hides. In addition, the importance of preserved meat maintained a very stable trajectory.
We assume the undervaluation of export official values as a working hypothesis. On the one hand, in the case of ad valorem taxes, official values’ commission in which exporters were represented would have maintained official prices at low levels so that exporters would effectively pay less tax. On the other hand, in the case of specific taxes, lower official prices would have shown an apparent high taxation when this was presented in percentage terms, which would have been used as an argument for lobbying to reduce taxes. Obviously, under this hypothesis the influence on this commission depends on the political power of producers and the evolution of aforos and taxes would be direct evidence of these power relationships. Higher political influence will imply lower taxation and higher official price undervaluation for some activities than others.
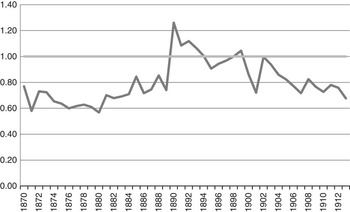
As can be seen in Figure 11, we observe a general undervaluation of the exported merchandise in official Uruguayan records. This would correspond to the use of official prices (precios de aforo) that did not respond to changes in international market prices. It would also support the hypothesis of the existence of pressures on the commission in charge of updating official prices.
PRICE ACCURACY INDEX, 1870-1913 Source: Appendix 4.

From the evolution of the PAI we can distinguish two clearly different periods. From 1870 to 1889 we detect a relatively stable level of undervaluation of official Uruguayan prices. In contrast, from 1890 onwards we notice a process of progressive undervaluation after an abrupt increase in the index, as the PAI shows a clear decreasing trend. These two markedly different stages are the result of the implementation of specific economic policy measures regarding customs taxes in the period 1888-1890.
In 1888 new customs laws were approved by the Uruguayan Parliament, which reduced to 0 per cent the taxes on exports, as cattle breeders demanded, in exchange for an increase in import taxes. Besides, a new customs tax scheme was implemented for imports, substituting the usual ad valorem taxes for specific ones, determined as a function of the quantity exported instead of its price. With respect to the export tax reduction, three arguments were used by the government to support it: the decline in the prices of wool, hides and tallow; the overcrowding of these products in warehouses as merchants hesitated to sell; and a similar reduction in export taxes taken previously by ArgentinaFootnote 14 .
Problems with public finances, in a period dominated by a serious international crisis (with the bankruptcy of Barings Bank as its clearest expression) that caused serious local economic and financial difficulties, forced the Uruguayan government to increase import taxes and to re-implement export taxes in 1890Footnote 15 . Moreover, specific taxes were introduced for exports, with higher differentiation according to sectors.
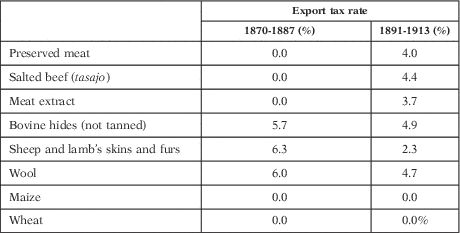
The following analysis considers the influence of taxes on official prices (Table 1). In this sense, it is an analysis that reflects the «administrative» dimension of the political process (a similar reasoning was applied in Tena-Junguito and Willebald Reference Tena-Junguito and Willebald2013) as an expression identified in previous literature where the specific response of the state depended on the character of the export elites and the extent to which they were articulated in social, political and economic terms (Cárdenas et al. Reference Cárdenas, Ocampo and Thorp2000).
EXPORT TAX RATES BY TYPE OF PRODUCT, 1870-1887 VS. 1891-1913

Note: Export tax rates were calculated over official prices (precios de aforo).
Source: Calculated with official data from the Statistical Yearbooks (several years).
Comparing how export tax rates changed after the reform of the customs tax system, we can distinguish three different situations affecting the meat, bovine hides, and ovine hides and wool sectors. In the case of meat sector (preserved, salted or extract) the reform implied an increase in the tax rate from 0 to around 4 per cent, while the sector of bovine hides registered only a minor decrease in the tax rateFootnote 16 . Quite different was the situation for the ovine-related producer sector (hides and wool), which experienced a sharp decrease in its export tax rate.
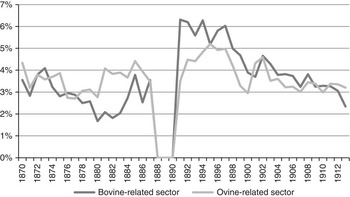
However, the effective prices received for exports were different, and we replicate the exercises considering market prices as a reference. Figure 12 shows the annual evolution of average tax rates for the bovine and ovine-related sectors. The averages were computed considering the tax rates of the main products of each sector (preserved meat, salted beef, meat extract and bovine hides in the case of bovine sector; sheep and lamb skin and furs, and wool in the case of ovine sector) and weighting them according to their participation in total sector exports.
TAX RATES, 1870-1913 (average per sector) Source: calculated with data from the Statistical Yearbooks (several years), the Annual Statement of the Trade of the United Kingdom and data detailed in Appendix 7.

Here, three interesting points come to notice. First, the early 1890s represent a break in the long-run evolution of Uruguay’s export tax structure. Second, tax rates by (large) sectors are clearly different before and after that break. Before 1888 the average tax rate of the ovine-related sector was higher than that of the bovine-related, whereas the situation clearly changed after 1890. The third interesting element to notice is the convergent evolution of tax rates towards the end of the period.
Thus, the reform affected ovine-related and bovine-related producers in very different ways, clearly benefitting the former more, which is usually identified with the «progressive» livestock producers. Sheep production incorporated technological changes more actively than bovine production in a process that combined low incentives for innovation in the meat productive chain — a sector dominated by meat extract and tasajo (Finch Reference Finch1980) — and the highest participation of dynamic immigrants in the ovine production (Millot and Bertino Reference Millot and Bertino1996). This conclusion of wool exporters as the tax-winner sector is confirmed if we compare wool’s official price with its international price.
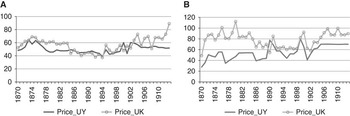
In Figure 13 the evolution of official and international prices for the two main products exported by Uruguay in this period, wool and bovine hides, can be seen. In the case of wool the undervaluation of official prices is much clearer than in the case of hides. After 1890 and the implementation of specific taxes, the undervaluation of wool’s official price meant that tax pressure on this sector seemed higher than it really was, giving arguments to wool’s lobbying group to influence government on maintaining taxes at a low level or even reducing them.
PRICES, 1870-1913 (pounds sterling per long ton). A. Bovine hides (not tanned). B. Wool Source: Appendix 4.

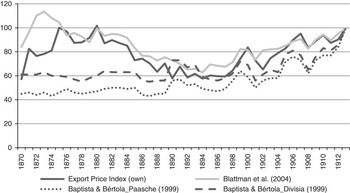
To complete our consideration of export prices, we finally present our new Uruguayan export f.o.b. price index. It is a Paasche index number (using exported quantities, year by year, to weight the respective prices adjusted for freights). Figure 14 shows our export price index (EPI) in comparison with those corresponding to Blattman et al. (Reference Blattman, Hwang and Williamson2004) and Baptista and Bértola’s Paasche and Divisia indexes (Reference Baptista and Bértola1999).
EXPORT PRICE INDEXES (EPI), 1870-1913 (1913=100) Sources: Appendix 5; Baptista and Bértola (Reference Baptista and Bértola1999); Blattman et al. (Reference Blattman, Hwang and Williamson2007).

According to our EPI, during the 1870s Uruguayan export prices registered an upward trend that was followed by a persistent decline until the late 1890s. The following years showed a clear recovery of export prices, which reached the levels achieved at the beginning of the period in 1913.
The evolution of our index resembles that of Blattman et al. (Reference Blattman, Hwang and Williamson2004) and agrees with what literature on the topic says about the evolution of international prices during this period. That is, international prices of primary commodities decreased until the 1890s and recovered subsequently. The persistent stability of export prices in Baptista and Bértola (Reference Baptista and Bértola1999) is the result of their adjustment decisions. As we mention previously, the majority of price corrections in their export series correspond to the 20th century and, in consequence, in the 19th century precios de aforo predominate. As these prices were stable, the evolution of the index is flat.
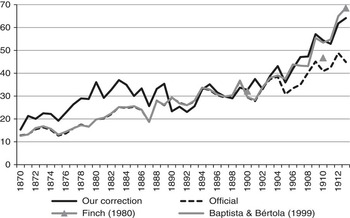
After implementing the required adjustments in order to cope with inaccuracies in quantities (summarised in Section 3) and revalue exports at international prices instead of official ones, we obtained a new adjusted export series, which is presented in Figure 15 along with the other series already available.
NEW CORRECTED AND PREVIOUSLY AVAILABLE EXPORT SERIES, 1870-1913 (million pesos; current prices) Source: Appendix 6; Statistical Yearbooks (several years); Finch (Reference Finch1980); Baptista and Bértola (Reference Baptista and Bértola1999).

As can be seen in Figure 15, our new proposed corrected series of exports is clearly different from the official series and from previous attempts at correction. The differences are truly remarkable in the first half of the period.
4. EXPORT GROWTH AND ECONOMIC PERFORMANCE
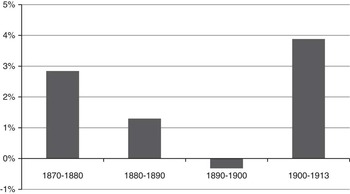
The evolution of exports expressed in constant prices is shown in Figure 16. We found that there was no continuity in the growth of exports. The 1870s and 1900s were the most favourable in terms of export growth, while the 1890s appear to have been a «lost decade». This evolution contrasts with that of Argentina, where a more stable growth process was registered, with growth rates of 0.8, 7, 5.6 and 7.5 per cent in each respective decade (Tena-Junguito and Willebald Reference Tena-Junguito and Willebald2013). This discrepancy is important to identify differences between economies usually considered as a whole. Cárdenas et al. (Reference Cárdenas, Ocampo and Thorp2000) argue that the extent of export expansion in Latin America relative to the domestic economies can be best measured by the value of exports per capita on the eve of WWI. Under this consideration, Argentina, Chile, Cuba and Uruguay would be the leaders of the process. However, this was not true in the case of Uruguay which began the period with high levels of the ratio and expansion was irregular and slight.
EXPORT VOLUME GROWTH RATES, 1870-1913 (annual average, exports in constant prices) Source: Appendix 6.

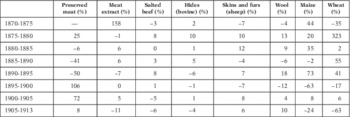
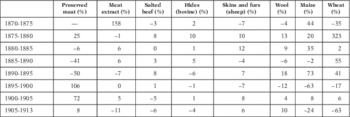
The evolution of exported volumes for some specific products is summarised in Table 2. The most remarkable features are the outstanding increase in exports of meat extract in the period 1870-1875 along with the expansion of exports of preserved meat at the turn of the centuryFootnote 17 . Exports of both products were promoted by Liebig’s Extract of Meat Company, a firm located in Fray Bentos, on the bank of the river Uruguay, and, probably, the only Uruguayan firm with an international reputationFootnote 18 . Wool exports, although with some transitory falls, showed an ascendant evolution, accounting for almost half of total exports at the end of our period; the decline of salted beef (tasajo) started at the beginning of the century, as a reflection of the loss of importance of Brazilian and Cuban traditional markets. In the case of grain exports, in spite of having registered important growth rates, it must be remembered they started from a very low level and their relevance never compared with that reached in Argentina.
ANNUAL EXPORT VOLUME GROWTH RATES, MAIN PRODUCTS, 1870-1913
Source: Calculated with official data from the Statistical Yearbooks (several years).
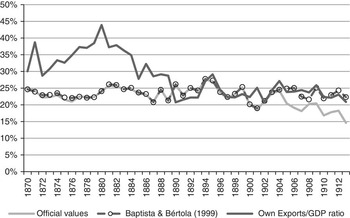
We evaluate the grade of openness of the economy in this period using the ratio Exports/GDP. What evolution of this ratio would be reasonable to expect? On the one hand, Uruguay opened to international markets and participated actively in regional and overseas trade. We would, therefore, expect an increasing trend of the ratio as an expression of the growing participation of the country in international trade. This pattern would be similar to the Argentinian evolution, where the increasing trajectory occurred from the 1870s to 1890s to acquire a relatively stable evolution afterwards (Tena-Junguito and Willebald Reference Tena-Junguito and Willebald2013, p. 48)Footnote 19 . On the other hand, Uruguay evidenced changes in the production side of its economy related to urbanisation, extension of local markets and agrarian diversification that could imply a growth pattern where the domestic economy proved more dynamic than the external sector. In addition, any economic policy that discriminates against exports in favour of internal development would have had similar resultsFootnote 20 . Under these conditions we could expect a decreasing trend of the ratio Exports/GDP (as was suggested, previously, in Bértola and Porcile Reference Bértola and Porcile2000, p. 65, using a proxy to this index)Footnote 21 . We are initially inclined towards this last hypothesis for three reasons. First, Uruguay was «born» to independent life devoting itself to overseas trade as the way to materialise its natural (and idle) wealth in the context of a dynamic European demand. Second, it is expected that the initial high proportion of exports in total production decreases as internal markets, population and urbanisation evolve. Third, the structure of exports by type of good would not have induced favourable consequences over the internal production for implying spillovers and positive feedbacks on exports. However, we do not expect effects on exports from changes in economic policy because the incentives directed to support the incipient manufacturing had limited consequences (Bértola 2000).
The Exports/GDP ratio computed from the new adjusted export values is shown in Figure 17, along with the ones calculated from official and Baptista and Bértola’s values. The new proposed ratio reflects an initial process of openness in Uruguay’s economy that lasted until the end of the 1870s. This evolution is coherent with the initial growth of a new economy, focused on external markets to place its production. From 1880 onwards a relative closure occurs, which could be explained by several reasons: a process of economic maturation, as a result of increasing urbanisation and development of internal markets; specialisation in areas of poor technological dynamism (traditional sectors, such as production of preserved meat and hides) and incapacity or delay in entering more dynamic markets, such as frozen meat and cereals; last, but not least, a small economy such as that of Uruguay could have been more affected by levels of protection similar to those applied by its neighbour Argentina.
EXPORTS/GDP RATIO, 1870-1913 Sources: calculated with export data from the Statistical Yearbooks (several years), Baptista and Bértola (Reference Baptista and Bértola1999) and corrected data; GDP data from Bonino et al. (Reference Bonino, Román and Willebald2012) based on Bértola et al. (Reference Bértola, Calicchio, Camou and Rivero1998) and Bertino and Tajam (Reference Bertino and Tajam1999).

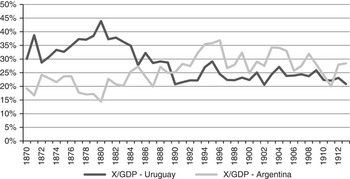
The comparison with Argentina enriches our image of the evolution of the degree of openness of the Uruguayan economy. The relevance of this contrast stems from the fact that both countries shared similar conditions in terms of natural resources, commodity production, attraction of productive factors and international integrationFootnote 22 . Despite these similarities, Argentina and Uruguay’s Exports/GDP ratios registered very different evolutions during this period, as seen in Figure 18. The explanation could be that Argentina successfully changed its production pattern and, in so doing, its exports, while Uruguay did not.
EXPORTS/GDP RATIO, URUGUAY AND ARGENTINA, 1870-1913 Sources: Uruguay: calculated with export data from Appendix 6; GDP data from Bonino et al. (Reference Bonino, Román and Willebald2012) based on Bértola et al. (Reference Bértola, Calicchio, Camou and Rivero1998) and Bertino and Tajam (Reference Bertino and Tajam1999). Argentina: Tena-Junguito and Willebald (Reference Tena-Junguito and Willebald2013).

As time went by the specialisation of these countries, both in terms of products and destinations, became more and more different. In 1891 Argentina sold to the United Kingdom products such as meat and cerealsFootnote 23 . The exterior market of this country, the most dynamic of all, kept its importance in Argentinian exports during the following years. Uruguay, on the other hand, sold mainly wool and hides to the United Kingdom in 1891 and this market lost importance as a destination for Uruguayan exports. Uruguay, then, decreased its presence in the most dynamic market of the First Globalization, that is, the United Kingdom, and remained attached to a less dynamic one, Brazil, where Uruguay sold salted beef (tasajo), a product in process of disappearing.
These results are consistent with the new geographical distribution of Uruguayan exports, obtained from adjusted data and presented earlier in Figure 8b.
The basis for these clearly different patterns of evolution registered in Uruguay and Argentina would be low externalities or spillovers of exports into the Uruguayan economy, which did not foster enough structural change in production activities. This process could be determined by several factors that acted with different intensity through the period in terms of natural endowments — essentially the types of lands that were not as appropriate for cereals as in ArgentinaFootnote 24 — the expansion of the agricultural frontier registered in Argentina and already consummated in Uruguay — which allowed the relocation of cattle breeding activities and the incorporation of cereal production — the delayed incorporation of new technology — especially in meat packing plants — and the incidence of measures of economic policy in an international market where trade protection effectively increasedFootnote 25 .
The modernisation and urbanisation of the economy deserve special comments. Bulmer-Thomas (Reference Bulmer-Thomas2003) proposes an exercise to evaluate the export-led model in Latin American economies (according to targets of expansion) obtaining, with the exceptions of Argentina and Chile, unsatisfactory performance of regional exports (from the mid 19th century to WWI). However, he recognises that the assumption of low productivity labour in the non-export sector cannot be justified in the case of Uruguay. Its urban centres (particularly Montevideo) proved attractive for European immigrants, and the non-export sector expanded rapidly in the years before the WWI. Although the long-run rate of growth of exports was unimpressive, Uruguay may still have been able to raise living standards at a fast rate as a result of above-average performance by its non-export sector. According to his «guesstimates» labour productivity «would have to rise by 2 per cent a year before export performance in Uruguay could be made consistent with the target (assuming an export share of 0.3 to 0.4)» (Bulmer-Tomas Reference Bulmer-Thomas2003, p. 63, footnote 39)Footnote 26 . The exports shares we obtain until the 1880s are precisely within that range confirming the Bulmer-Thomas conjecture and the increasing importance of the non-export sector in the period.
5. FINAL REMARKS
The bad reputation of the accuracy of 19th-century Latin American foreign trade statistics is confirmed in the case of Uruguay, a small economy of the south of the continent that headed the ranking of per capita exports and was one of the richest economies of the region. Its particular position between two large and wealthy countries characterised an economic evolution dominated by the fact that it was the «exit door» of an extensive region producer of raw materials, food and other commodities. Montevideo and Buenos Aires played an important role as transit ports during the 18th and 19th centuries and even nowadays both ports maintain a significant trade based on entrepôt relationships. Therefore, Uruguay constitutes a clear illustration of the statistical difficulties related to transit trade in the world periphery as previous literature showed for European ports such as Antwerp or Amsterdam. In the case of Uruguay statistical problems related to transit trade had consequences on the valuation of exports but, fundamentally, in terms of the regional distribution of external sales.
Official statistics showed a share of exports to Argentina which was not reasonable because of the similar productive structure of both countries and our adjustment by transit and smuggling — in terms of quantities — corrects this problem in a satisfactory manner.
We then analyse accuracy problems related to the use of valores de aforo to value, officially, Uruguayan exports. From the evolution of our accuracy price index, we distinguish two different trajectories. From the beginning of the period to 1889 we detect a relatively stable level of undervaluation of official Uruguayan prices. On the contrary, from 1890 onwards we appreciate a progressive process of undervaluation (our index shows a clear decreasing trend) after an abrupt increase in overvaluation. These two different stages are the result of the implementation of specific economic policy measures regarding customs taxes in the period 1888-1890.
To correct the undervaluation — in both stages — we revalue the official unit values with international prices — British import prices corresponding to goods purchased by Britain from Uruguay — and discuss the consistence of the bias found with the political economy interest of the exporters to evade taxes. We focus our attention on the years 1888-1892 when trade regulations changed and promoted transformations in the taxation by type of commodity. These policy changes affected ovine-related and bovine-related producers in very different ways, clearly benefitting the former more than the latter; an interest group usually identified with the progressive sector of livestock producers of Uruguay because its efforts to modernise sheep production, in technological terms, and promote more efficient use of land.
During the Belle Époque, the evolution of exports expressed in constant prices was irregular. The 1870s and 1890s were the most favourable in terms of export growth, while the 1880s appear to have been a «lost decade». This evolution contrasts with that of Argentina, where a sustainable growth process was evidenced. The fundamentals for these clearly different patterns would be low externalities or spillovers of exports into the Uruguayan economy, which did not foster enough structural change in domestic production. This process could be determined by several factors that acted with different intensity through the period in terms of quality of land, the expansion of the agricultural frontier registered in Argentina and already consummated in Uruguay, the delayed incorporation of new technology (specifically in the beef industry) and the incidence of measures of trade policy.
SUPPLEMENTARY MATERIAL
To view supplementary material for this article, please visit http://dx.doi.org/10.1017/S0212610915000130.