Introduction
Object detection refers to the presence or current appearance or position of an object in an image (Cyganek, Reference Cyganek2013). Object detection and recognition play an important role in many real applications in today's world (Franco et al., Reference Franco, Maltoni and Papi2017). They depend on various techniques such as template matching or learning using the feature-based or appearance-based techniques (Khurana et al., Reference Khurana, Sharma, Singh and Singh2016). It is a basic technology for automated, intelligent vision-based applications such as industrial inspection module (Kim et al., Reference Kim, Cho, Moon and Park1999; Liu et al., Reference Liu, Kuang and Ding2007) and autonomous cruise control (Kyo et al., Reference Kyo, Koga, Okazaki, Uchida, Yoshimoto and Kuroda2003). This paper presents an object detection-based inspection module in the context of the pattern-based object detection method. Object detection from complex background remains challenging work. We have investigated the orientation checking of different objects in real time and detection of objects from complex backgrounds. We have used shape and color together as the influential features to solve the problems. Shape is one of the sources of information used for object detection. The visual system analyzes images and produces a description of an object from the scene. An object does not have a unique description; one can think of descriptions at many levels of detail and from many points of view. Essential properties, such as translation, rotation and scale invariance, affine and occlusion invariance, and noise resistance, must be presented by efficient shape descriptors. Shape feature extraction and representation play an important role in the following categories of applications: shape recognition and classification, shape retrieval, etc. Similarity among the features of shapes is the basis for shape-based image retrieval. Simple geometric features are usually used as filters to eliminate false hits, or they are combined with other shape descriptors to discriminate shapes with a large difference. They are not appropriate to be used as standalone shape descriptors. In the context of object detection, color yields incredible outcomes in combination with shape descriptors. The perceived color of an object depends on the illumination on it. Different color models are there for different applications in every industry that uses color, for example, YUV or YCbCr are used in a video system, and a RGB color model is used in computer graphics. Color models are broadly divided into three categories according to their applications in image processing (Ibraheem et al., Reference Ibraheem, Hasan, Khan and Mishra2012). Most classical algorithms, which work on the binary or gray color image, are obtained either directly from the sensor or by monochromatic color scale conversion. These color models are system independent and provide remarkably good results for most applications where color is not explicitly required. However, color is inevitably required for certain machine vision applications. The problem arises in selecting the most suitable color space. In our experiment, we have used HSV, CMY, YCbCr, and L*a*b* color models. Among these color models, CMY andYCbCr are device-dependent. HSV is user-oriented and device-dependent, and L*a*b* is device independent (Caleiro et al., Reference Caleiro, Neves and Pinho2007). Any color in the visible-light spectrum can be represented by appropriate quantization of each of RGB color components. RGB is the basic color space captured by a color camera system. Correlation in RGB channels should be understood clearly. In general, we cannot say anything about G or B given R value, but RGB may be correlated when hue and brightness value is given. Though RGB is not suited for problems like color quantization or object recognition, where the distinction is needed between color (Caleiro et al., Reference Caleiro, Neves and Pinho2007). To represent a point in space, one set of color space uses Cartesian coordinates. Example of this type of set is three primary illumination colors such as Red, Green, and Blue (RGB) or the complementary colors such as Cyan, Magenta, and Yellow (CMY). In CMY color space, cyan, magenta, yellow, and black pigments or inks are applied to a white surface to subtract some color from the white surface to create the final color model. Another space representation utilizes polar/cylindrical coordinates, such as hue, saturation, and value (HSV), because of its similarity the same way humans tend to perceive color. L*a*b* color model, defined by the International Commission on Illumination, is the most complete color model used conventionally to describe all the colors visible to the human eye. L represents lightness of the color, a* represents its position between magenta and green, and b* represents position between yellow and blue. YUV color representation was devised, as it is very similar to human visual perception as human eyes response more to brightness than the color. Y is the luminance of a color, and UVs are two chromatic components.
We undertook a study to understand how shape and color combined perform to detect an object and its orientation in real time from the static and uncluttered background. We detected a particular set of objects with defined shape from the complex background in the next part of the work. We have divided this study into two parts. First, color distribution-based segmentation is carried out by taking the background color as the dominant value in the histogram for four different color space models. Second, we have applied different geometric shape features in the segmented image to detect objects of interest. We discuss the related work on color space models, shape descriptors in object detection in the “Related work” section. We have evaluated different lighting conditions for our experiment in the “Evaluation of different lighting conditions” section. Sections “Study 1: orientation checking of different components” and “Study 2: object detection from complex background” describe two different studies in details along with results. We have discussed the results in the “Discussion” section followed by the conclusion drawn in the “Conclusion” section.
Related work
Object detection deals with distinguishing and annotating geometric shapes in an image, and it is utilized in computer vision for the inspection, registration, etc. Commercial vision applications have expanded from the conventional area of machine inspection to medical image analysis, video surveillance, face detection and recognition, and many of others. The major barrier in object detection includes robustness with respect to illumination, variation in viewpoint, scaling and imaging conditions (Dalal and Triggs, Reference Dalal and Triggs2005; Felzenszwalb et al., Reference Felzenszwalb, Girshick, McAllester and Ramanan2010; Zhang et al., Reference Zhang, Huang, Yu and Tan2011). Different factors for object recognition include color space, shape, cluttered scene, etc. Choosing the correct color space model is an important task in object detection or object tracking. Rasouli and Tsotsos (Reference Rasouli and Tsotsos2017) investigated the effect of different color space for detecting and discriminating different colored objects. They also measured the suitability of color spaces from two different perspectives: discriminability of various color groups and detection ability. The authors concluded that for detecting and discriminating all color groups, there is no single optimal color space. Scandaliaris et al. (Reference Scandaliaris, Villamizar, Andrade-Cetto and Sanfeliu2007) reported the color and contour-based object detection. They used RGB, C1C2C3, and o1o2 color space images to show the robustness of their models in changing the illumination and varying shadows. Zarit et al. (Reference Zarit, Super and Quek1999) compared and reported the pixel classification performance of two different skin detection methods in five different color space models. They reported that the best result was obtained in Fleck HS or HSV color space. Song et al. (Reference Song, Ge, Qi and Chen2010) presented the illumination invariant color space model and compared to other conventional color space models for colored object recognition for the robotic soccer game. They reported that their model outperformed other color models like YUV, RGB, and HSI. Khattab et al. (Reference Khattab, Ebied, Hussein and Tolba2014) compared the performance of automatic GrabCut technique-based segmentation for different color space images. They reported that using five color space models, RGB provided the best segmentation result. Duan et al. (Reference Duan, Duan, Xu, Gong and Qu2015) used different color space models to find optimal segmented results for Bayer color images from an aerial view. They used a multiobjective constraint function to evaluate their results and reported that the I1I2I3 color space model was best for their purposes. In the context of object detection, the cluttered scene also an important factor. Papageorgiou et al. (Reference Papageorgiou, Oren and Poggio1998) reported how over complete wavelet representation can be learned and used for object detection in a cluttered scene. Mohan et al. (Reference Mohan, Papageorgiou and Poggio2001) reported a technique which can detect four different human components in the cluttered static image without assuming any a priori knowledge concerning the image. Stella et al. (Reference Stella, Gross and Shi2003) reported a concurrent object recognition and segmentation by a graph partitioning in a cluttered image. Ben-Musa et al. (Reference Ben-Musa, Singh and Agrawal2014) investigated object detection and recognition in a cluttered scene using a Harris corner detector. They used Fast Retina Keypoint descriptor to find and match the detected objects.
In contrast to color-based models, we have investigated the potential of shape descriptors (Zhang and Lu, Reference Zhang and Lu2004) along with other factors as a cue for object detection. Shape-based object detection are investigated in earlier work. Many techniques characterized a distance measure between shapes, and afterward try to discover minima of this distance. A classical method is chamfer matching (Barrow et al., Reference Barrow, Tenenbaum, Bolles and Wolf1977; Borgefors, Reference Borgefors1988; Olson and Huttenlocher, Reference Olson and Huttenlocher1997; Gavrila and Philomin, Reference Gavrila and Philomin1999), in which the distance is defined as the average distance from points on the template shape to the nearest point on the image shape. In any case, it has been noted that chamfer matching does not adapt well to shape and clutter deformation. Toshev et al. (Reference Toshev, Taskar and Daniilidis2012) investigated the problem of object detection and segmentation using global properties of object shape. They introduced the concept of chordigram which is based on the geometric relationship of object boundary edges. Mori et al. (Reference Mori, Belongie and Malik2005) reported efficient generalized shape context-based 3D object recognition from multiple 2D views by using shape matching. They addressed the issues involved in scaling up the approach to deal with a large number of objects and to make coarse discriminations very quickly. Heitz et al. (Reference Heitz, Elidan, Packer and Koller2009) developed a probabilistic shape approach to learn the shape of object class and to constantly localize object's outline in the test image. Shasani et al. (Reference Shasani, Meher and Patra2015) reported object detection integrating color and shape together. They have used color as an unambiguous color representation for different object recognition. They did not illustrate clearly what is the effect of color models on shape recognition. Jain and Vailaya (Reference Jain and Vailaya1996) investigated the image retrieval system using color and shape feature together as a cue. They reported that robust performance can be achieved by using color and shape together. Gode and Khobragade (Reference Gode and Khobragade2016) investigated object detection using shape and color information together. In their method, they used color information to segment and then detected object using shape matching. Though they worked on static images with a very limited dataset. They did not show the efficiency of the algorithm in a complex background. Khan et al. (Reference Khan, Anwer, Van de Weijer, Bagdanov, Vanrell and Lopez2012) reported the performance of color attributes combined with shape features for object detection in Efficient Subwindow Search Strategy framework. They investigated their algorithm in different image datasets to show the efficiency of their method.
In this paper, we have used color and shape as basic features to check the correct orientation of an object under inspection. We have used three different shape descriptor methods in four different color space models to detect objects from a complex background. In particular, we have experimented our first case study to identify the correct orientation of different PCB components as part of manual PCB assembly process. In the second case study, we have experimented different shape descriptors for different color space models on different PCBs to detect ICs. We have used a different type of PCBs having a different color to experiment efficiency of our algorithm. In our work, we have considered different color space to get an optimal color space to detect objects in a cluttered scene using different shape descriptors.
Evaluation of different lighting conditions
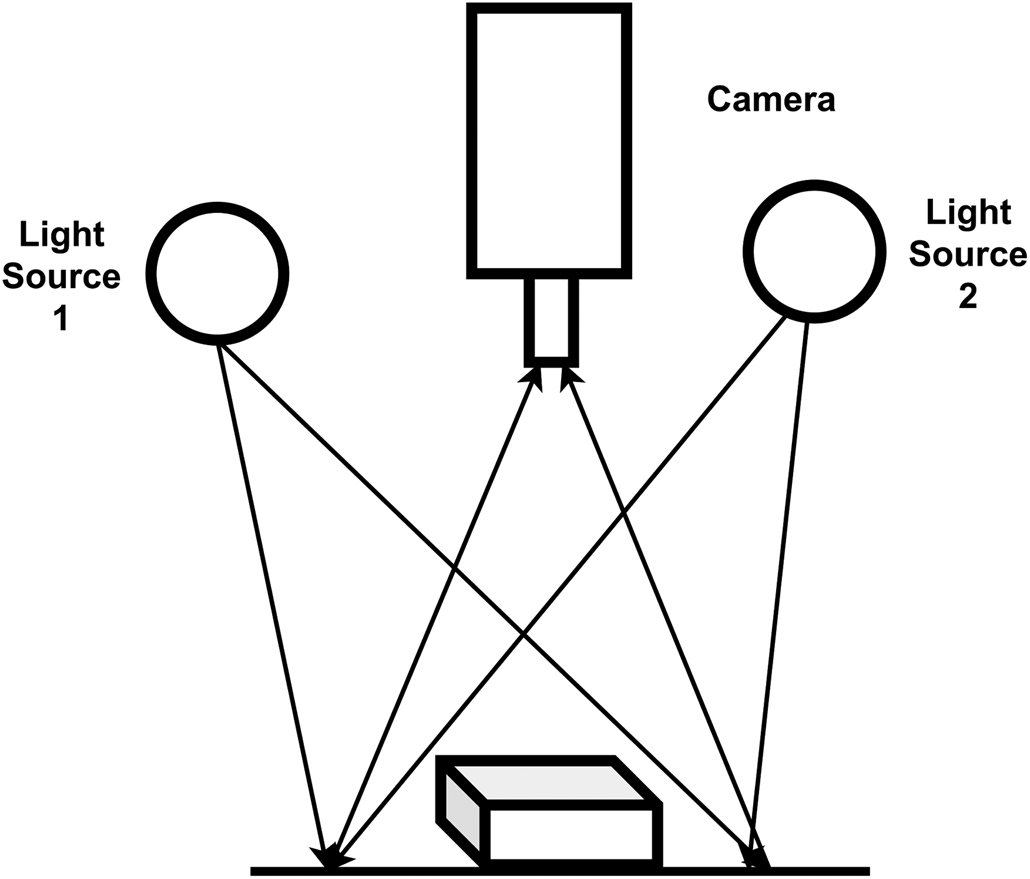
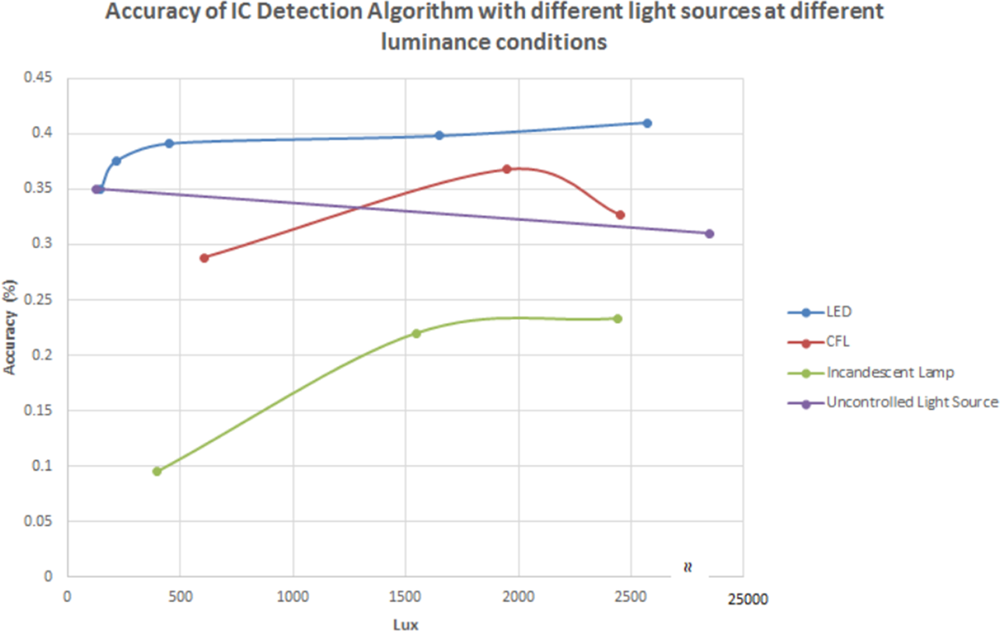
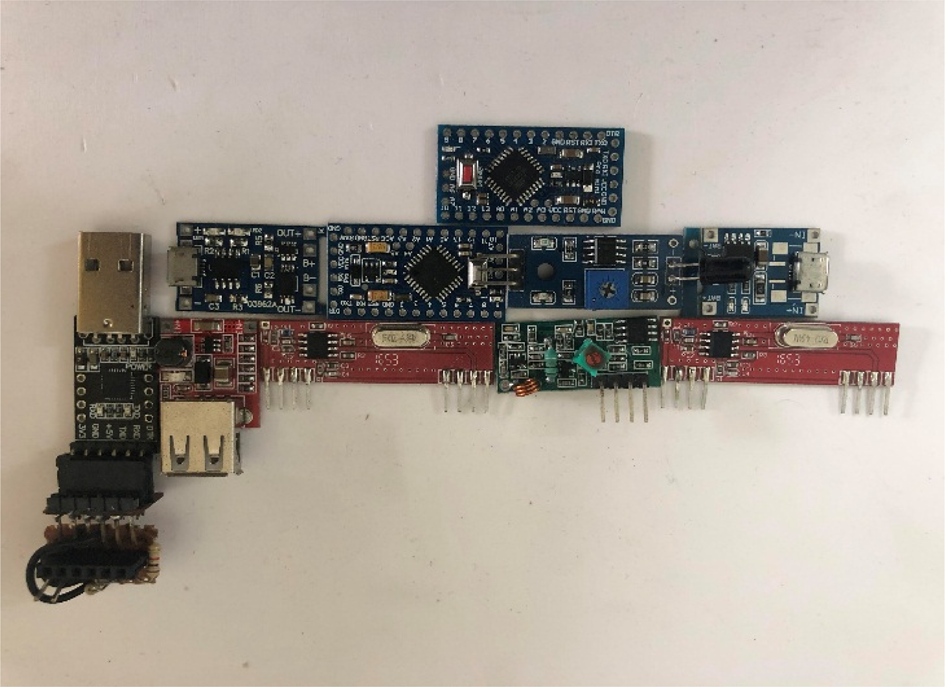
Illumination is one of the important factors of the image acquisition. Assessing the quality of an image in machine vision problem reduce the time and memory space for object detection and recognition. It will require complex processing techniques to detect the object in case of low contrast image or image with changing illumination. Hence, a suitable lighting technique is very much essential in image acquisition. The main characteristics that govern image acquisition are intensity, the distance between lighting source and objects to inspect, the direction of light, etc. Selection of appropriate illumination is an extremely difficult problem. We can render a better image by increasing illumination, but it will produce a shadow in a different part of the image. The most common problem we have found in machine vision is how to illuminate the object and position of the camera with respect to lighting source to capture the best image. The word “best” can be obtained by combining different lighting source and different camera conditions and type of objects under inspection (Fig. 1). We undertook a study to evaluate the accuracy of the object detection algorithm under various lighting conditions. We used a set of lights to create different levels of illumination. We have tested our algorithm using 10 number of PCBs, including flame sensor board, Arduino Nano, and RF transmitter, (Fig. 11). The color of boards includes green, blue, red, and black. We took four readings for each PCB for any light source. We calculated accuracy by taking an average for all PCBs and plotted it under various lighting conditions and source of lighting. We have achieved the highest accuracy at 2500 Lux using LED light source (Fig. 3). As may be noted provided same light intensities, LED lighting source worked better than compact fluorescent light (CFL) or incandescent lights. However, accuracy was reduced at a higher Lux, while we undertook the study in sunlight.
Schematic diagram of light and camera setup.

Study 1: orientation checking of different components
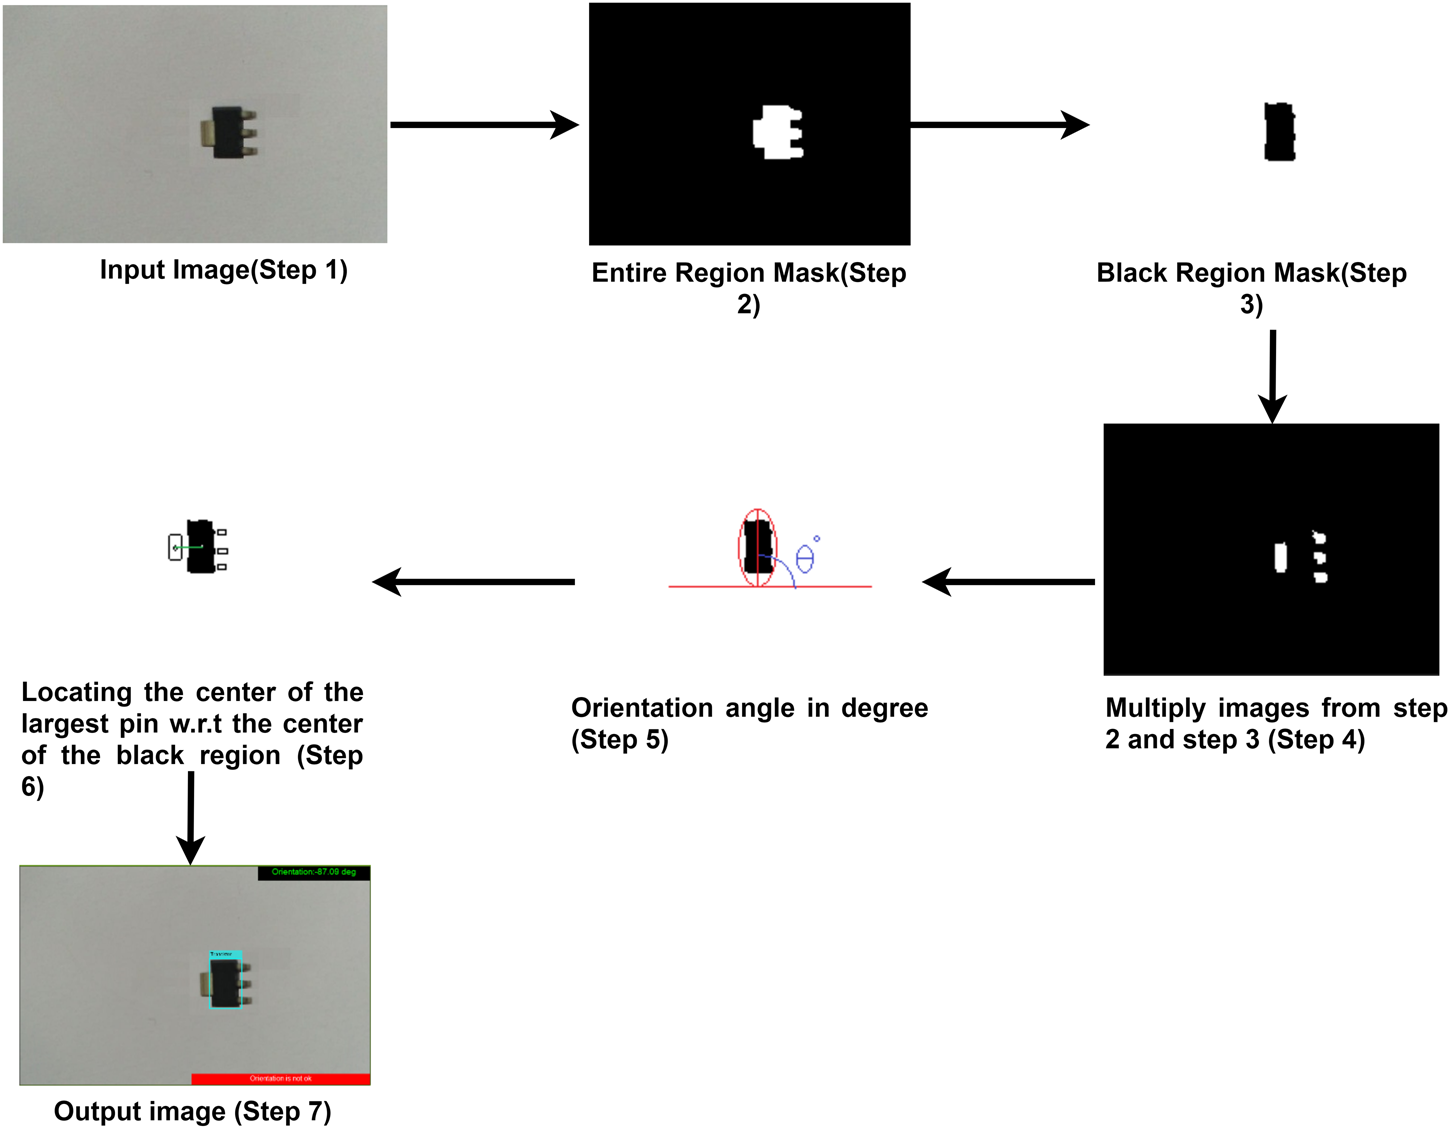
This study investigated how to recognize a particular object with the correct orientation. We have experimented this study with different surface-mounted devices (SMD) like Quad Flat Package (QFP), electrolytic capacitor, and transistor. We have used the plain, uncluttered platform as the background under inspection module. We have kept objects one after another and checked their orientation using shape and color as a unique feature. Like for electrolytic capacitor, it is generally circular from a top view. To check the orientation of transistors, we are considering the shape of heat sink PIN (25N06) or shape of the collector (1FW) as their unique feature. For electrolytic capacitors, considering the top view, we are checking its orientation using the negative polarity mark. Negative polarity mark is segmented from the background and used for orientation. We have described the different intermediate steps by pictorial representation for a transistor in Figure 4.
Materials
In this study, we have used Intel NUC computer with a dual-core i3 processor and Logitech HD WEBCAM C615 which can capture images up to 8 MP. In our experiments, we have used the following light sources:
◦ uncontrolled light source (room light and sunlight),
◦ LED (1.5, 3, 5, and 12 W),
◦ CFL (11, 28, and 36 W), and
◦ incandescent lamp (60 W).
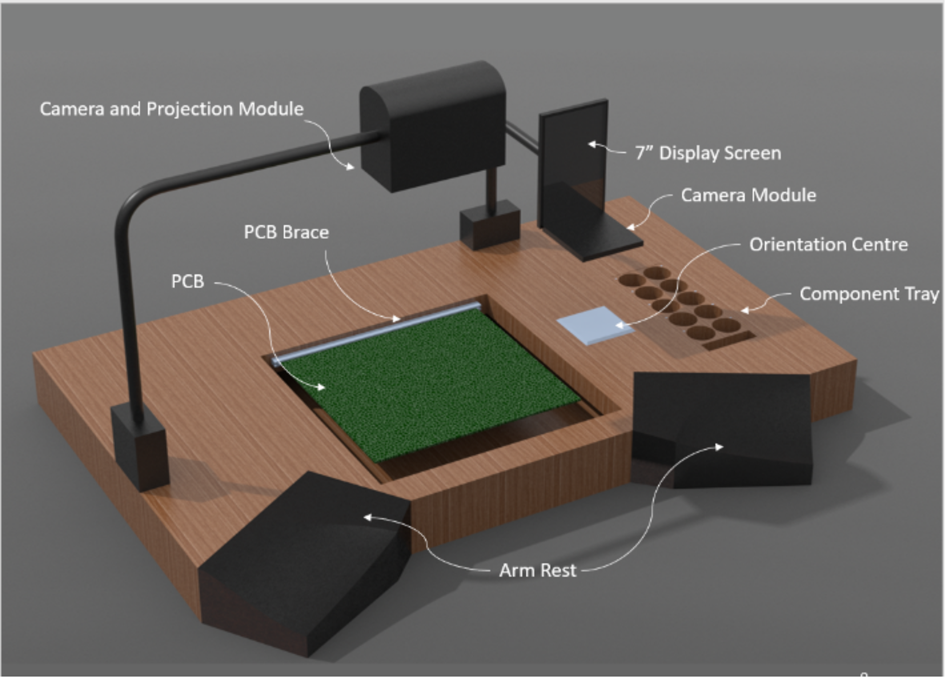
We have integrated our software with a PCB assembly aid (Fig. 2).
PCB assembly aid.

Accuracy of the algorithm under various lighting conditions.

Pictorial flow diagram for orientation checking of a transistor.

Results
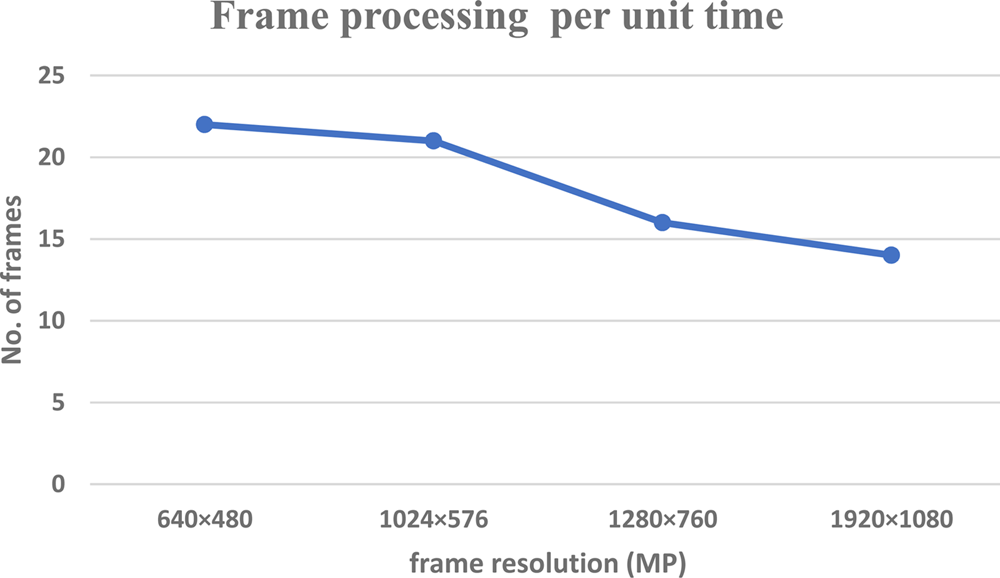
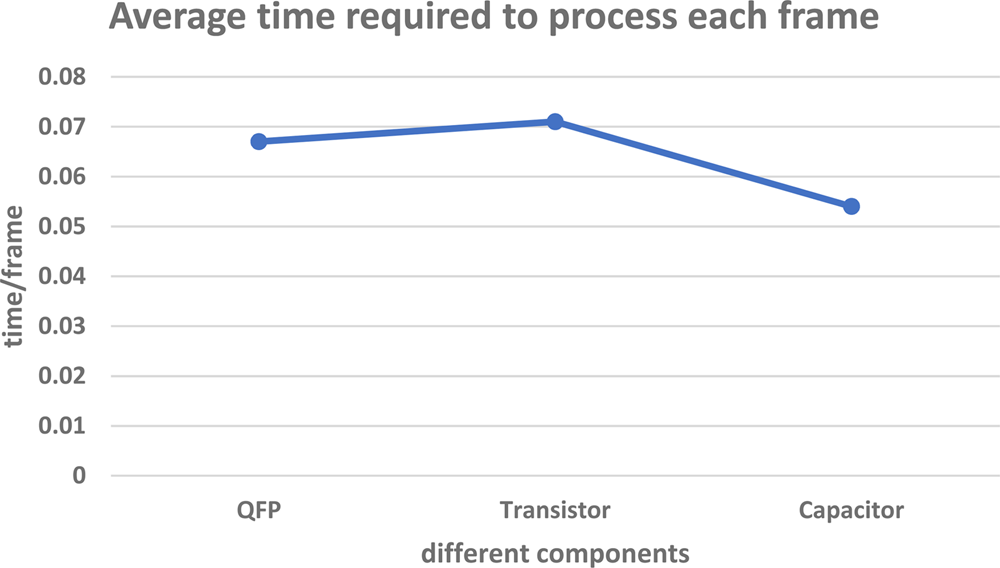
We have investigated available resolutions in the camera to obtain the highest frame rate. We have achieved a frame rate of 22 frames/s. We have also observed that the frame rate is decreasing with the increase of resolution (Fig. 5). We have compared all three objects to measure the time required to detect an object with correct orientation (Fig. 6).
Number of frames processing persecond against frame resolution.

Time required by different components to process in 1280 × 760 frame resolution.

Study 2: object detection from a complex background
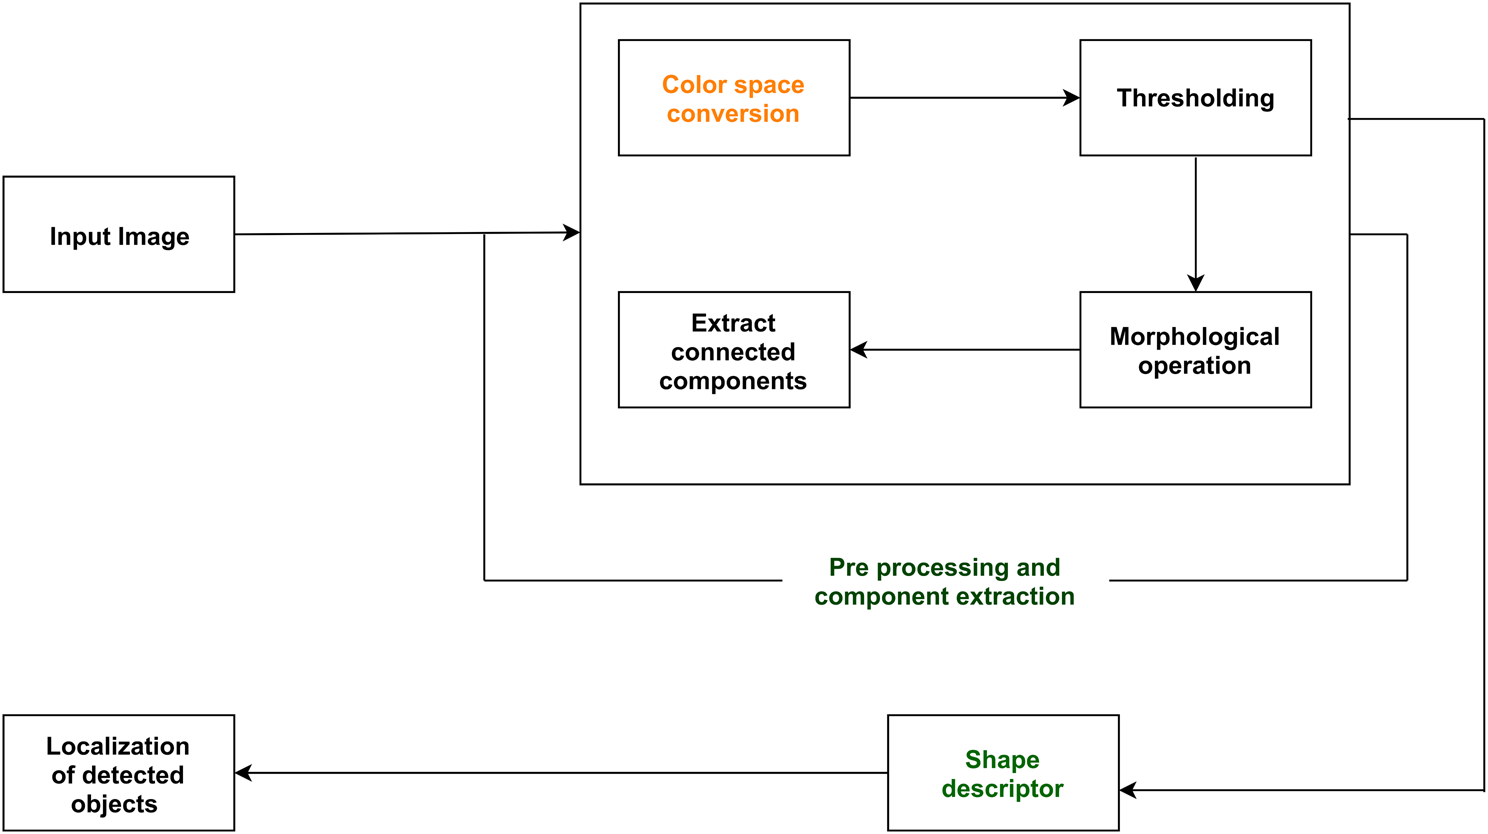
In this study, we have investigated how different shape descriptors work in different color space models. The aim of the work is to detect a particular type of objects from a complex background. We have explained in details about the flow of the work (Fig. 7). The RGB image includes noise, shadows, and reflective illumination. Segmentation methods described in the literature (Moganti et al., Reference Moganti, Ercal, Dagli and Tsunekawa1996; Hirano et al., Reference Hirano, Garcia, Sukthankar and Hoogs2006) do not provide good results in the RGB color space. So, we have converted the captured image into other different color space, that is, HSV, CMY, L*a*b*, and YCbCr. Different color space models have advantages and disadvantages. We defined threshold limit for the individual channel of transformed color space image to find the area of interest. Then, we have applied morphological processing to extract connected components. Different color space conversion, preprocessing techniques and shape descriptors are described in details in the following subsections. We have experimented this study to detect ICs from a different type of PCBs (Fig. 2), as we mentioned in the evaluation of lighting conditions. We undertook this study to detect differently oriented ICs on different type and different colored PCBs.
Time required by different components to process in 1280 × 760 frame resolution.

Color space conversion
There is five major color space models subdivided into others, which are CIE, RGB, YUV, HSL/HSV, and CMYK. Color segmentation in RGB space is very sensitive to change in illumination of light. This lack of sensitivity can be avoided by using the CIE L*a*b* color space by increasing the accuracy of color segmentation (Hernandez-Lopez et al., Reference Hernandez-Lopez, Quintanilla-Olvera, López-Ramírez, Rangel-Butanda, Ibarra-Manzano and Almanza-Ojeda2012). CIE L*a*b* used in our experiment is a perceptually uniform color space which attempts to recreate the way how people see the colors. In L*a*b* color space, in order to minimize effect due to illumination changes, Euclidean distance is measured between pixels having the level of similarity (Ohta et al., Reference Ohta, Kanade and Sakai1980; Gevers and Smeulders, Reference Gevers and Smeulders1999). In color image processing, HSV color space is extremely helpful in light of fact that it can hold information about the color unaffected notwithstanding amid different lighting conditions. YCbCr color space used in our experiment is a scaled version of YUV. YCbCr is more effective for the undertaking of image segmentation (Chikando and Kinser, Reference Chikando and Kinser2005). Comparing to several color space models, probability of image segmentation in YCbCr is very high because of the overlap region of intensity for two objects are minimum.
Segmentation
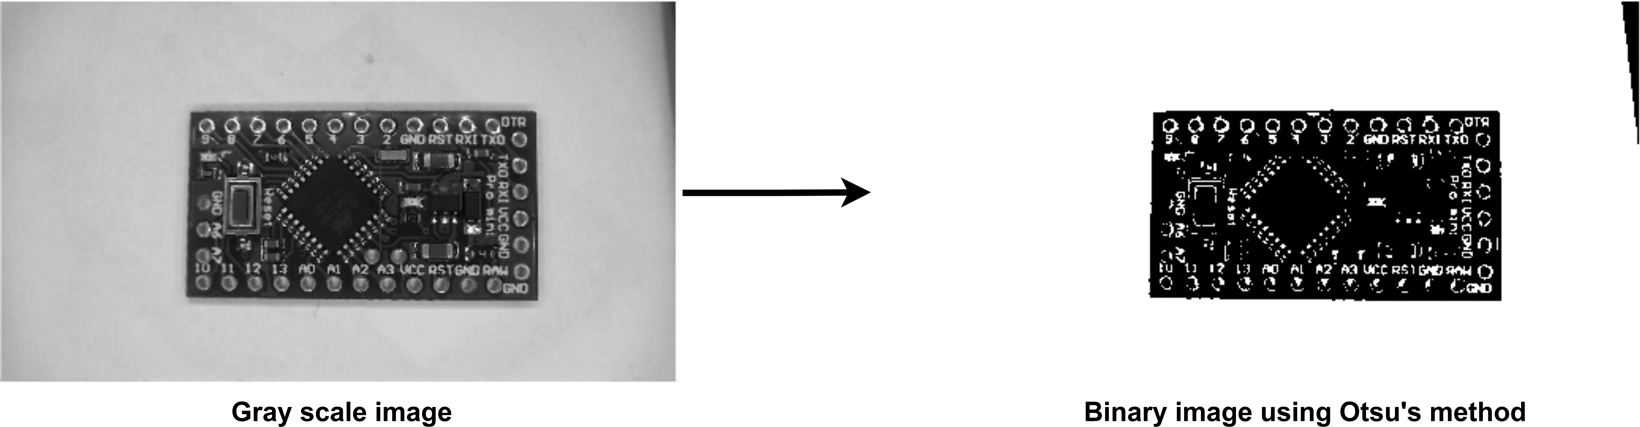
Thresholding is a method of image segmentation to set up boundaries of an object on a contrasting background using a threshold rule. Initially, when we apply a threshold rule, we select the threshold value of pixel intensity. All pixel values below the threshold value are marked as background, and rest pixels are marked as foreground. This process is called binarization. In fixed thresholding, threshold gray-level value is constant through the image. A fixed threshold can give good results if background intensity is constant and foreground intensity is approximately equal. Adaptive thresholding works well to process images with uneven lighting conditions. We used the “colorThresholder” app available in MATLAB to set color space and range for each channel of the color space. It creates a binary mask based on chosen histogram thresholds for each channel. We defined the threshold for each channel based on histogram settings of the color space image converted from the RGB image captured in controlled lighting condition (2500 Lux with LED light source). We have described pseudocode to generate a segmented mask of the YCbCr image from the RGB image. We were unable to segment ICs from other components using global thresholding as shown in Figure 8.
Image segmentation using Otsu's method.

We used a static threshold to segment our region of interest (here, it is ICs). The algorithm to find accuracy is written as follows:

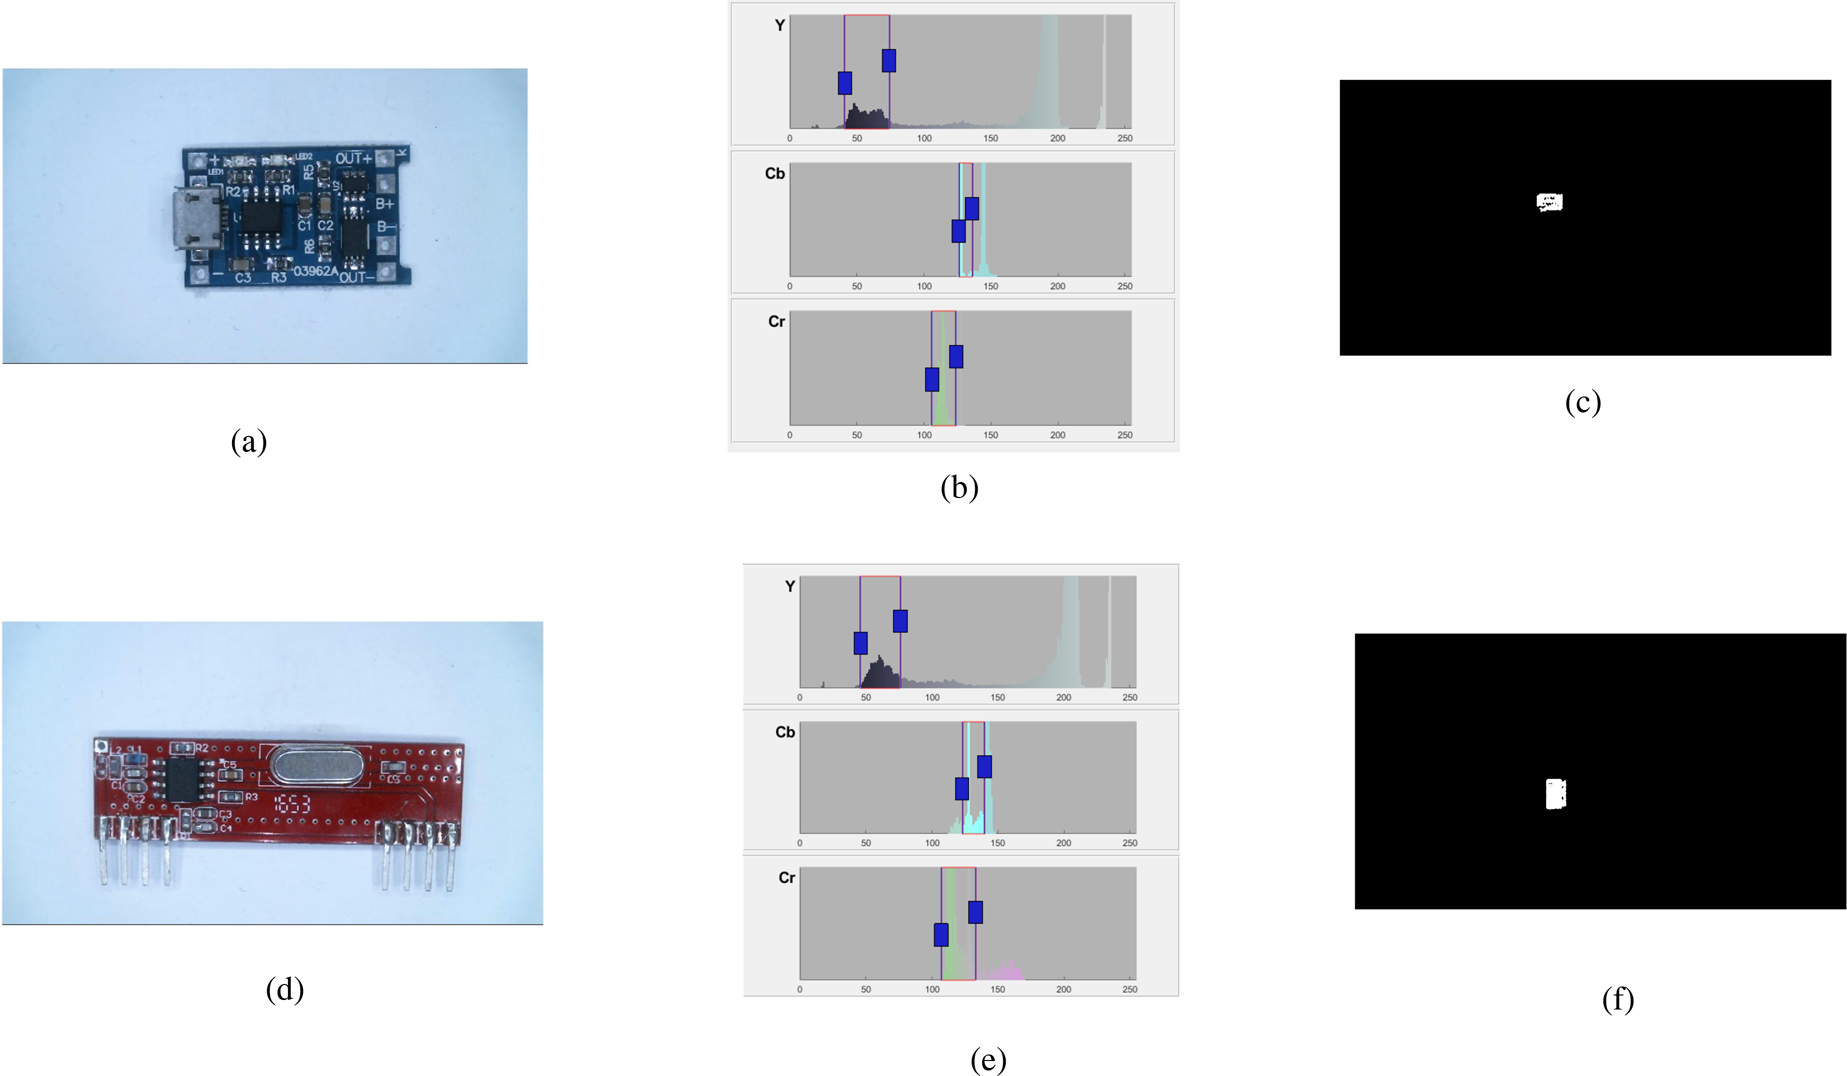
The Color Thresholder displays three histograms representing color components of the image for the YCbCr color space (Fig. 9). In this color space, the Y component represents brightness, the Cb component represents the blue-yellow spectrum, and the Cr component represents the red-green spectrum. Other color spaces use different types of controls. We segment the image interactively using the color component controls. Histogram sliders are used to select the colors associated with each histogram as shown in the second column of Figure 9. Finally, we created a mask based on chosen histogram thresholds (output in the third column of Fig. 9). In YCbCr, we have used thresholds of Y, Cb, and Cr as (46, 76), (126, 141), and (102, 124), respectively. We have shown in Figure 9 that using the same threshold for each channel based on histogram settings, we are able to segment ICs, independent of the color of the board or type of the boards. We used the generated segmented mask for morphological processing.
Applying threshold based on histogram settings and output of thresholding. (a,d) Input RGB images; (b,e) histogram sliders are used to select colors associated with each histogram (YCbCr image); and (c,f) output binary image.

Morphological processing
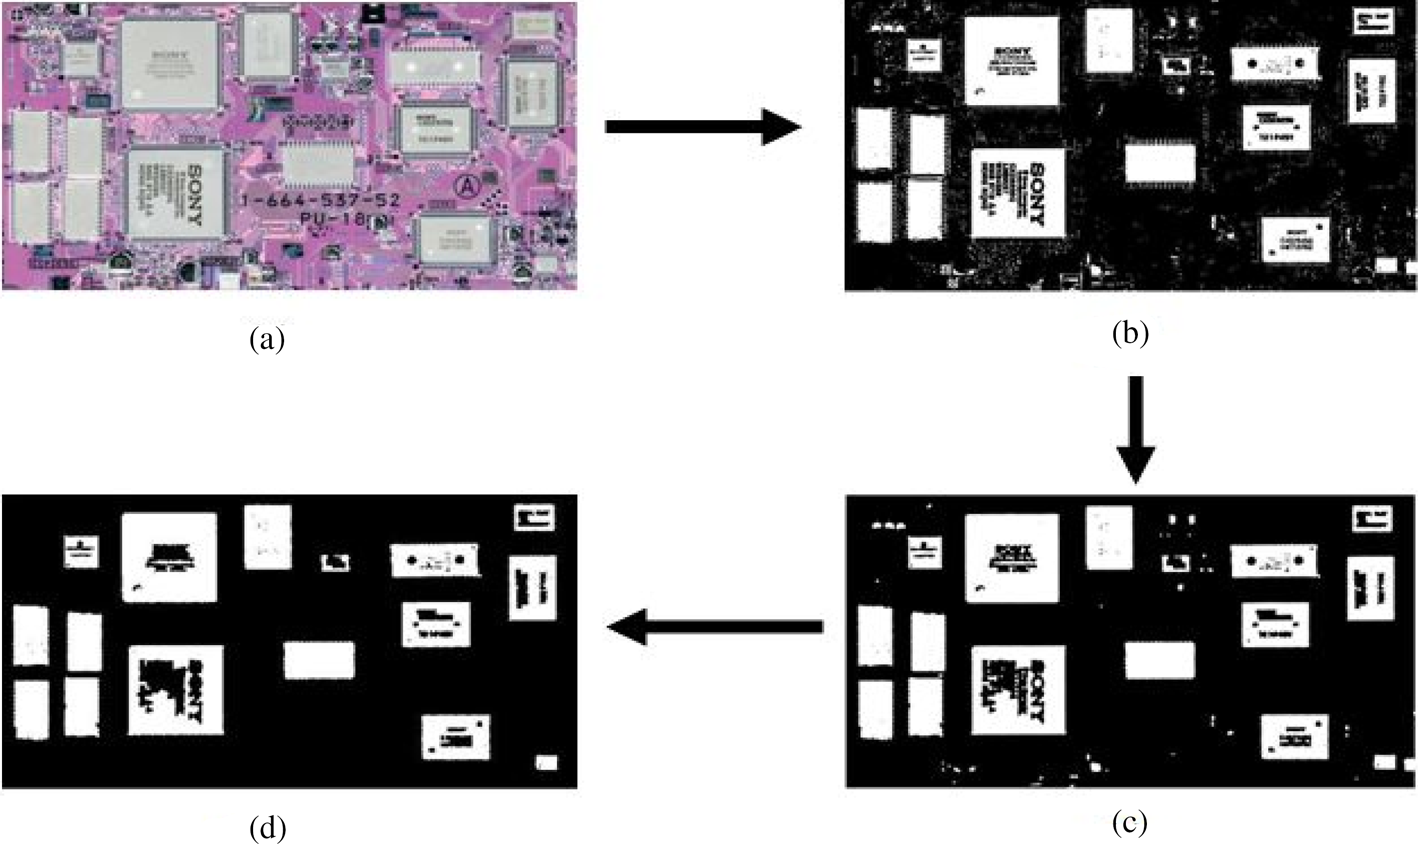
Mathematical morphology passes a fixed pattern (called a structured element) over the binary image. The outcome depends on the size and shape of the structured element along with what type of logical operation is applied on the binary image. The basic morphological operations are erosion and dilation along with the combinations of opening or closing. Erosion is used to eliminate boundary pixels of the object. Objects smaller in diameter compared to structured element are removed after the operation. In dilation, all the pixels touching the objects are assigned into the object, thus increasing the size of output object by a layer of these pixels. Two objects are connected after single dilation operation if they are separated by the distance less than the diameter of structured element. In our work, disk-shaped structured element of size 2 × 2 pixels containing all ones. Then, the obtained image (Fig. 10c) is passed through one filter to removes smaller objects from the binary image, producing another binary image (Fig. 10d).
Different preprocessing steps for object detection in the CMY color space. (a) RGB color image is converted to the CMY color space; (b) segmentation process using a fixed threshold value; (c) applying morphological processing (erosion followed by dilation); and (d) small unwanted objects are eliminated using filtering methods. Connected components above the threshold value are remaining in the final image.

Shape descriptors
Compactness
In our work, we are aiming to localize rectangular or square shape from the morphological processed image. The processed image may contain regular and irregular shapes. To segregate them, we are calculating compactness of individual shape by using basic shape descriptors like area, major axis, and minor axis of shapes. Compactness is calculated as (area of shape region)/(major axis * minor axis of shape region). Theoretically, the ratio should be 1 for a rectangular or square shape. But due to noise, we have used the threshold value as 0.75. The objects having compactness greater than the threshold value are considered as the target object.
Bounding box
Bounding box estimation is one of many shape representation techniques. It is the minimum bounding rectangle is also called a minimum bounding box. It is the smallest rectangle (aligned with the image axis) that contains every point in the shape. It is used to estimate how rectangular shape is (how much it fills its minimal bounding box): area of object/area of the bounding box. This ratio has a value of 1 for a rectangle and can approach to 0. Rectangularity can be measured as follows:
 $${\rm Rectangularity} = \displaystyle{{A_{\rm s}} \over {A_{\rm r}}}$$
where A s is an area of the shape and A r is the area of the minimum bounding rectangle. It is storage and time-efficient. It is robust with noisy shape boundaries and invariant to translation, rotation, and scaling.
Convex hull
Convex hull is a geometrical approach to encompass set of points (called convex set) in a plane by a minimum polygonal curve called convex polygon. Convexity of a polygon is used to analysis shape in many areas of scientific analysis, for example, object detection and classification. There are plenty of methods are there to define convex hull. We have used a Graham scan algorithm to find convexity of different regions processed by the morphological operation. Graham scan algorithm uses a graph traversal method to construct convex hull by starting from an arbitrary vertex on the boundary of the region. It continues to find the outermost vertices about the boundary of the region in some order, thus construct the convex hull. Convex hull approach is invariant to translation, rotation, scaling, or affine transformation. In our problem, we have measured the area covered by the convex hull. We have calculated solidity of the shapes using the ratio of the area of the shape region and convex hull area of the shape. Solidity can be ideally 1. Though the boundary of the area of interest is not straight due to morphological processing been applied in preprocessing. We have a fixed threshold value to 0.8. It helps to detect target objects on the plane.
Results
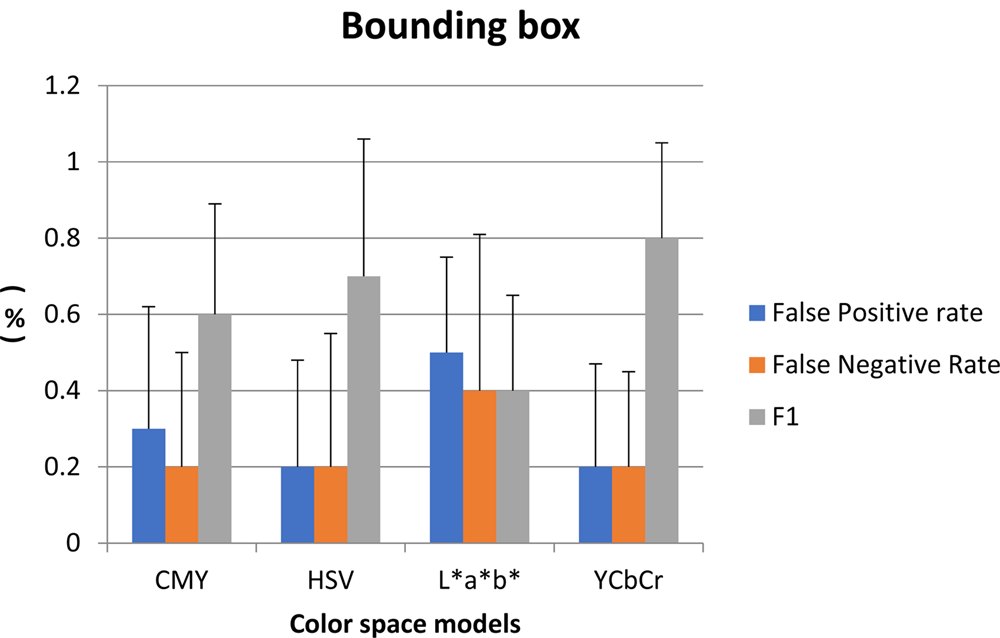
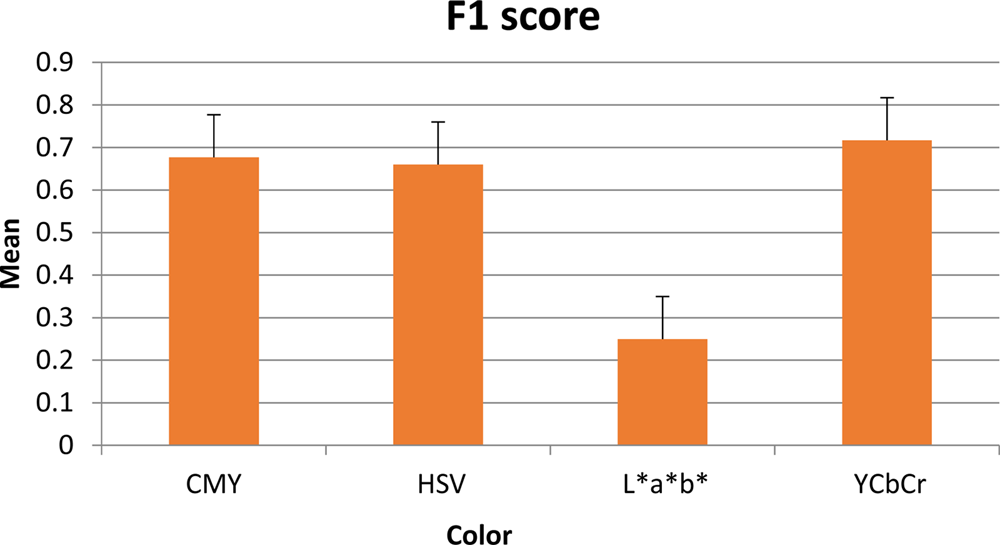
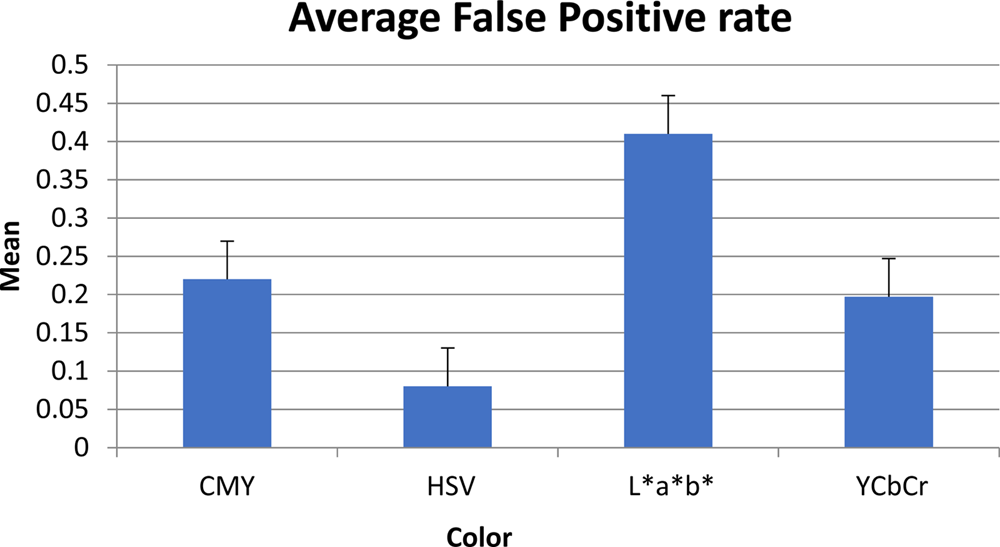
We have analyzed the different color space model to get the best color space model. Image obtained in different color space are passed through different preprocessing techniques before we have applied different shape descriptors to complete a detailed comparison study (Fig. 11). As may be noted, we have measured F1 score and average false positive and average false negative along with standard deviation shown in Figure 12. We have designed the study to estimate accuracy (F1 score), false positive rate, and false negative rate of the algorithm. We have used the same materials in this experiment as in the previous study. The study is a 4 × 3 factorial design where the independent variables are
• Color space:
◦ CMY
◦ HSV
◦ L*a*b*
◦ YCbCr
• Shape descriptors:
◦ Compactness
◦ Bounding box
◦ Convex hull
The dependent variables are
• F1 score (accuracy)
• False positive rate
• False negative rate
Evaluation of the algorithm on a different type of board.

Evaluation charts of our algorithm. F1 score and average false positive and false negative rate are calculated in different color space model. Object detection is implemented and experienced using difference shape descriptors. Here, we have shown the performance of the bounding box.

We undertook a repeated measure ANOVA for each dependent variable. We tested the sphericity assumption using Mauchly's test and applied Greenhouse–Geisser correction when the sphericity assumption was violated. We have found
Significant main effect of color space on
• F1 (accuracy) F (3,27) = 9.19, p < 0.05, η 2 = 0.50
• False positive rate F (3,27) = 8.11, p < 0.05, η 2 = 0.47
• False negative rate F (3,27) = 6.007, p < 0.05, η 2 = 0.4
Significant main effect of shape descriptors on
• False positive rate F (3,27) = 9.15, p < 0.05, η 2 = 0.50
• False negative rate F (3,27) = 10.78, p < 0.05, η 2 = 0.55
We did not find any significant result for interaction effects (color × shape) for any dependent variable at p < 0.05. Then, we undertook pairwise comparison for different color models and different shape descriptors for all dependent variables. We did not find any significant difference between shape descriptors. Though the L*a*b* color space model was found significantly different from other color models.
Discussion
In study 1, we have detected different type of objects from a static white background in real time. In particular, our aim is to make a setup to identify and prompt, using visual feedback, the orientation of SMT components in accordance with the final orientation of those components on the PCB for manual pick-and-place operations. The component indicative tray for manual pick-and-place operations that brings down the cognitive load of identifying the correct component to be picked. To make our algorithm more time-efficient, we are considering basic shape descriptors (area and bounding box) to eliminate the complexity of the problem. We have found that the algorithm works with 22 fps in 640 × 480 resolution for computing correct orientation along with detection of the components. We have also reported that there is no significant difference in time in computing of different components. The results in study 2 indicate that L*a*b* is significantly different from other three-color space in measuring F1 score. F1 score is highest for YCbCr, although there is no significant difference between YCbCr, HSV, and CMY (Fig. 13). We have found that there were not any significant for different shape parameters. Average false positive rate is lowest for the HSV color space and highest for L*a*b* (Fig. 14). The average false negative rate is highest for the L*a*b* color space, although there is no significant difference between other three-color space. We also found that difference shape descriptors have no significant difference in the measure of average false positive rate or average false negative rate. This analysis can be used in fault detection problem, where a low false positive result is very essential. We have observed that the highest accuracy is obtained in the YCbCr color space image using the bounding box shape descriptor that is 80% for 2500 Lux using LED. In the context of comparing different color space models, we have also observed that the L*a*b* model is not suitable for object detection problems. In this study, we found that ICs always are oriented parallel to the PCB. There may be cases, where ICs like QFP are not placed in parallel with PCB (e.g., Arduino Pro Mini). In this special case, we can crop the segmented IC region and can rotate them and parallel them with image plane, and then, we can apply bounding box and calculate the ratio to find accuracy. Thus, our algorithm work for all type of ICs invariant of their orientation.
Comparing different color models for F1 score.

Average false positive rate in different color space models.

Conclusion
This work started with an aim to develop an automated visual inspection module to meet industrial criteria. The purpose of the automated visual inspection system is to develop a flexible experimental setup for inspecting a different kind of objects from the cluttered scene. In our first study, we have addressed the challenges in checking the orientation of components (not getting the polarities wrong) found in manual pick-and-place operations for the actual assembly operations of a small batch of PCBs (ranging from 10 to 50 PCBs). We have found significant frame rates (~22 fps) in detecting objects along with its orientation in real time. We have extended this idea to detect a particular type of objects from the cluttered scene. We have compared different type of shape descriptors in different color space models. The work presented in this paper deals with the image acquisition phase of inspection too, which is relatively less investigated when compared to other image processing phases. The results show that it is possible to use a commercial webcam for inspection. To make it application independent, we have used two essential features, that is, color and shape. Though approaching object detection using color is very time effective, but it is vulnerable to changes in illumination. Compare to color, shape-based methods have limitations too. It should be resistive to noise, occlusion, and nonrigid deformation as well as invariant with translation, scaling, rotation, and affine transformation. To overcome the limitations of both features, in the process of solution, we have integrated color and shape together. We have found high accuracy rate, that is, 80%. Hence, our shape descriptor-based object detection approach can be suitable for other object detection problems for industrial automation. This work has further implication beyond industrial automated visual inspection in terms of the autonomous vehicle, autonomous taxiing of aircrafts. A potential area will be detecting different type of on road lane marking for autonomous navigation of vehicles, taxiway lane mark detection in an airport taxiway for aiding autonomous taxiing of aircrafts.
Abhishek Mukhopadhyay is a PhD student in Computer Science and Engineering at Indian Institute of Information Technology, Kalyani, India. He is working as Junior Research Fellow at Indian Institute of Science. His research aims to explore the possibilities of computer vision and image processing to make interfaces of modern electronic devices accessible to a different group of users in different areas.
Imon Mukherjee has completed his PhD from Jadavpur University, Kolkata, India, in July 2015. From August 2006 to December 2011, he was an Assistant Professor (senior scale) in the Department of Computer Science and Engineering of Institute of Technology & Marine Engineering, now The Neotia University, West Bengal, India. From January 2012 to June 2016, he worked as an Assistant Professor in the Department of Computer Science and Engineering at St. Thomas’ College of Engineering & Technology, Kolkata, India. He is presently serving at the Indian Institute of Information Technology, Kalyani, as an Assistant Professor (Grade-I). His research focuses on Information Security, Data Analytics, etc. He is the PI/Co-PI of different government funded R&D projects. Besides, he is associated with many reputed peer-reviewed conferences and journals as organizing the committee and advisory committee member.
Pradipta Biswas is an assistant professor at the Centre for Product Design and Manufacturing of Indian Institute of Science and co-chair of Study Group 9 at the International Telecommunication Union. His research focuses on user modelling and multimodal human–machine interaction for aviation and automotive environments and for assistive technology. Earlier, he was a senior research associate in the Engineering Department, a research fellow at Wolfson College, and a research associate at Trinity Hall of the University of Cambridge. He completed his PhD in Computer Science at the Rainbow Group of the University of Cambridge Computer Laboratory and Trinity College in 2010 and was awarded a Gates Cambridge Scholarship in 2006.