

The relative contributions of different policy instruments to reductions in trade and welfare are of interest to (a) trade negotiators as a way of prioritizing their negotiating efforts, and (b) agricultural policy analysts as a way of pointing to the inefficiencies in national government choices of policy measures. This has been the subject of particular interest during the Doha round of World Trade Organization (WTO) negotiations, especially the relative importance of high-income country agricultural subsidies versus import market access restrictions (Hoekman et al., Reference Hoekman, Ng and Olarreaga2004; Anderson et al., Reference Anderson, Martin and Valenzuela2006). Recent changes in trade restrictions in response to international food price spikes and harvest failures also have re-awakened an interest in policy instrument choice.
In comparing across policy instruments, economists commonly calculate weighted averages of the nominal rates of assistance (NRAs) or consumer tax equivalents (CTEs) for various products associated with different policy instruments.Footnote 1 However, aggregates of NRAs and CTEs for different instruments, even when weighted appropriately using production and consumption at undistorted prices as weights, are not able to capture very accurately the relative contribution of those different instruments to trade and welfare reductions. This is especially so when some policies (such as import or export taxes) have negative effects on trade while other policies (such as export subsidies) have positive trade effects. Likewise, if the import-competing and exportables sub-sectors are each subject to trade taxes, sectoral average NRAs and CTEs may be close to zero even though both sub-sectors' policies are trade- and welfare-reducing. Furthermore, the welfare effect of a policy instrument is related to the square of the individual ad valorem distortion rate, which means that averages of the NRA (or CTE) fail to capture the fact that widely different rates of intervention across commodities within a policy instrument group have worse welfare effects than if all commodities had similar NRAs and CTEs.
Certainly, sectoral partial equilibrium or economy-wide computable general equilibrium (CGE) models can be and are used to estimate trade and welfare effects of different policy instruments, drawing on available estimates of NRAs and CTEs by instrument (e.g. Tyers and Anderson, 1992; Anderson and Martin, 2006: ch. 12). However, such models are intensive in their needs for data and parameter (e.g. price elasticity) estimates. Also, they are typically calibrated to just one past year, and so are not well suited to timely on-going monitoring or historical analysis of policy developments. For example, Diao et al. (Reference Diao, Somwaru, Roe and Burfisher2001) and Hertel and Keeney (Reference Hertel, Keeney, Anderson and Martin2006) draw on the GTAP database for 1995 and 2001, respectively. The GTAP database, which is updated every three years but typically with a long delay,Footnote 2 recognizes the ‘three pillars’ in the WTO agricultural negotiations (import tariffs, export subsidies, and domestic production subsidies), but it tends to ignore export taxes, import subsidies, production taxes, and consumption taxes and subsidies. While the ignored set may have been relatively unimportant in 1995 or 2001, non-trivial export taxes were re-introduced in Argentina from 2002. Export restrictions also were used by numerous developing countries when international food prices spiked upwards in 2008, and by Russia and its neighbors following poor grain and oilseed crops in 2010. Also, new evidence suggests changes in those latter measures, especially export taxes, are a significant part of the evolving global story of agricultural distortions over the past half century (Anderson, Reference Anderson and Anderson2009). With the arrival of the new Distortions to Agricultural Incentives database compiled by the World Bank (Anderson and Valenzuela, Reference Anderson, Kurzweil, Martin, Sandri and Valenzuela2008), together with new methodological developments using trade restrictiveness indexes, it is timely to re-examine the relative contributions of different policy instruments to agricultural price distortions across the world since the 1950s.
This paper makes two contributions. First, it offers a new methodological approach for estimating the relative contributions of different policy instruments to indicators of trade and welfare reductions from agricultural policy. Second, it applies the methodology to the World Bank's new distortions dataset that allows the estimation of the changing relative contributions over time of a comprehensive set of agricultural policy instruments to indicators of national, regional, and global trade, and welfare losses. All forms of border measures are included (import and export taxes and subsidies, or the tariff equivalent of non-tariff border measures), as well as domestic production and consumption taxes and subsidies and the output price equivalent of farm input taxes and subsidies.
The indicators estimated in this paper are defined by two descriptors: the instrument trade reduction index (ITRI) and the instrument welfare reduction index (IWRI). The ITRI (or IWRI) is the ad valorem trade tax rate for a particular policy instrument, which, if applied uniformly across all tradable agricultural commodities in a country, would generate the same reduction in trade volume (or the same economic welfare loss) as the actual cross-product structure of NRAs and CTEs for that instrument in that country. Because the NRAs and CTEs capture the presence of domestic measures that can distort just farmer or consumer incentives (in addition to trade measures that distort both equally), the ITRI and IWRI are computed from sub-indexes that herein are called the instrument producer distortion index (IPDI) and the instrument consumer distortion index (ICDI).
The use of ITRI (or IWRI) for computing the relative contribution of different policy instruments has the advantage of providing a single theoretically sound partial equilibrium measure of price distortions that is comparable across time and countries as an indicator of the trade (or welfare) effects of different policy measures. Because the Anderson and Valenzuela (Reference Anderson, Kurzweil, Martin, Sandri and Valenzuela2008) dataset covers five decades (1955 to 2007), the data can indicate trends over time, which a comparative static CGE model can only do if it is calibrated to a series of past years rather than to just one or a small number of particular years.Footnote 3
The paper is structured as follows. The next section provides a brief summary of the theory for deriving the ITRI and IWRI (details of which appear in the algebra of the Appendix). This is followed by a description of the World Bank's Distortions to Agricultural Incentives dataset and its breakdown of the NRA and CTE estimates by instrument. The core of the paper is in the following section, which presents and discusses the estimates of the two indexes by policy instrument. Caveats follow, and the final section concludes.
Trade and welfare reduction indexes at the policy instrument level
There is a growing literature that identifies ways to measure indexes of price distortions that better reflect the welfare- and trade-reducing effects of international trade policy. This literature began with work by Anderson and Neary (eventually summarized in their 2005 book), and was made more operational by the partial equilibrium simplifications of Feenstra (Reference Feenstra, Grossman and Rogoff1995). Notwithstanding these theoretical advances, there are few series of consistently estimated indexes across countries. A prominent exception is the work of Kee et al. (Reference Kee, Nicita and Olearraga2009) who, following the approach of Feenstra, estimate a series for developing and developed countries. However, they provide estimates only for a snapshot in time (the mid-2000s), and their estimates are based only on import barriers.Footnote 4 Other studies have been country and sector specific, such as an application to Mexican agriculture in the late 1980s (Anderson et al., Reference Anderson, Bannister and Neary1995). Most do not provide long time series, key exceptions being Irwin (Reference Irwin2010) for US import protection policy and Lloyd et al. (Reference Lloyd, Croser and Anderson2010) for global agricultural policies since 1955 (but not disaggregated by instrument).
There are several reasons why scalar index numbers are superior to averages of NRAs and CTEs for comparing contributions of different policy instruments. First, the theory of the ITRI and IWRI can allow for the differential responses of different products when faced with the same ad valorem rate of policy distortion, because elasticity terms appear in the indexes' formulae – although we show that this may not be overly important. Second, the IWRI has the desirable attribute that it correctly takes into account the fact that the welfare effect of a policy is related to the square of the price distortion. And, third, the ITRI correctly takes into account the positive and negative impacts on trade volume of different measures (e.g., a positive production subsidy in both an import-competing industry and an exporting industry would have offsetting effects on the volume of trade).
The springboard for the present study is the paper by Lloyd et al. (Reference Lloyd, Croser and Anderson2010). That paper modifies the Feenstra simplification of the Anderson and Neary formulations to accommodate the fact that producer and consumer prices of farm products are distorted differently whenever border measures are supplemented by domestic producer or consumer subsidies or taxes. It also confirms that price elasticities of domestic demand and supply are not overly important, and indeed are unnecessary if one is willing to tolerate a pair of simplifying assumptions. Starting from that basis, the conceptual contribution of the present paper is to show how those modified indexes can be computed for various policy instruments used to distort product prices, and then aggregated to identify the relative contributions of different policy instruments to the overall sectoral-level TRI or WRI for a country.
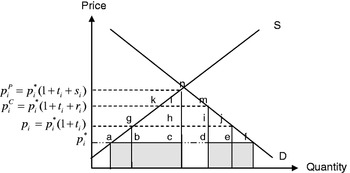
Figure 1 illustrates, as an example with linear domestic demand and supply curves, a situation in which an import-competing industry i is subject to an ad valorem tariff on imports, t i, plus an ad valorem consumer tax, r i, that additionally distorts the consumer price plus an ad valorem producer subsidy, s i, that additionally distorts the producer price over and above the tariff. The NRA in this case is t i plus s i, and the CTE is t i plus r i. Under free trade, at the border price of p i*, the volume of imports would have been af, whereas in the presence of these three distortionary policy instruments it is reduced to cd. The welfare loss associated with these distortions is the sum of the triangles acn and dfm in Figure 1.Footnote 5 The trade reduction is proportional to the extent to which the domestic prices exceed the border price, whereas each triangular welfare loss is proportional to the square of the domestic to border price wedge.Footnote 6 The latter is because the tariff rate determines both the price adjustment and the quantity response to this adjustment (Harberger, Reference Harberger1959).
Representation of import-competing agricultural industry i in a small open economy with a border tax plus a domestic consumer tax and a domestic producer subsidy

That figure could also be used to depict an import subsidy, a consumer subsidy, and/or a producer tax. A similar figure could be drawn for an exporting industry, showing an export tax or subsidy with domestic consumer or producer subsidies or taxes. All eight instruments are considered below, unlike at the WTO where agricultural trade negotiators focus almost exclusively on just three instruments (import taxes plus production and export subsidies).
In a country with many tradable agricultural industries, each industry is likely to have a different ad valorem rate of policy distortion. The ITRI is a measure of the uniform ad valorem trade tax distortion for an individual policy instrument, which, if applied to all commodities with that policy instrument distortion instead of actual distortions, would result in the same reduction in the aggregate volume of trade (valued at that year's border prices) in those industries' products as the actual distortion structure. The IWRI is a measure of the uniform ad valorem trade tax distortion for an individual policy instrument, which, if applied to all commodities with that policy instrument distortion instead of actual distortions, would result in the same reduction in economic welfare as the actual distortion structure.
The algebra needed to operationalize the ITRI and IWRI concepts is presented in the Appendix. It is developed assuming that a border measure is first implemented, and that it may be supplemented by additional domestic measures.Footnote 7 The analysis is undertaken first for import-competing products and then for exportable products, in each case estimating indexes separately for producers and consumers and aggregating only in the last step. Accordingly, the four key equations for the import-competing sub-sector are the ITRI for border and domestic measures (B j and D j, respectively – see equations (6) and (8) of the Appendix) and the IWRI for border and domestic measures (WB j and WD j, respectively – see equations (14) and (15)).
The ITRI for a policy instrument is computed as a weighted average of the distortions in all industries with that policy instrument. The weights are proportional to each product's domestic consumption (or production) response to changes in prices either from free-trade to a border distortion (B j and WB j) or from a border-only distortion to a border-plus-domestic distortion (D j and WD j).
In the Appendix, it is shown that the weights for the ITRI and IWRI can each be written as functions of, among other things, the domestic price elasticities of demand and supply. With elasticity data available, it is possible to estimate indices that allow for the differential responses of different products when faced with the same ad valorem rate of policy distortion. However, even in the absence of elasticity data, it is possible, with the use of a simplifying assumption, to estimate indices using as weights the shares of each commodity's domestic value of consumption or production at undistorted prices. The assumption required is that the domestic price elasticities of supply are equal across farm products for a particular country, and likewise that a country's domestic price elasticities of demand are equal across products. Given the paucity of reliable estimates of domestic demand and supply elasticities for the many countries and products and years for which NRA and CTE estimates are now available, this is a very convenient assumption. It also turns out to be reasonably benign in practice, according to the sensitivity analysis reported in a complementary study by Croser et al. (Reference Croser, Lloyd and Anderson2010).Footnote 8
Each of the four key indices (B j, WB j, D j, and WD j) is extended to the exportable sub-sector by recognizing that for an exportable good a positive price distortion (such as an export subsidy) reduces welfare in the same way as does a positive price distortion (such as an import tax) for an import-competing good, but the positive price distortion for an exportable increases trade whereas a positive import-competing price distortion reduces trade. Hence, there is a need to keep separate track of import-competing and exporting products each year for the purpose of estimating annual ITRIs and IWRIs, and to recognize that an industry can switch status over time.
In this paper, where we choose to focus on the relative contribution of different instruments, each ITRI and IWRI index on the production (or consumption) side of a country's economy is converted to a constant dollar value of production (or consumption) index by multiplying the ad valorem index by the value of production (or consumption) at undistorted prices for that instrument group. The dollar values are divided by the country's overall value of production (or consumption) of all covered tradable goods to recover what can be considered as a decomposition of an overall sectoral-level TRI or WRI for a country. National IWRIs and ITRIs are averaged across countries using as weights the sum of each country's value of production and consumption at undistorted prices for the relevant instrument group.
The distortions to agricultural incentives database
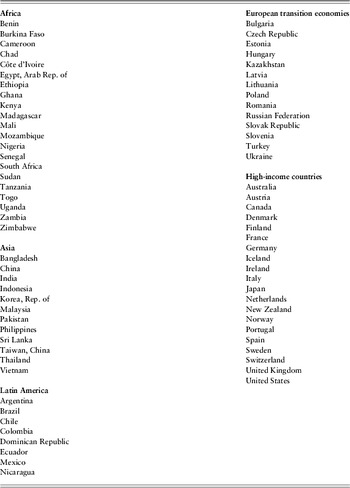
A new database (Anderson and Valenzuela, Reference Anderson, Kurzweil, Martin, Sandri and Valenzuela2008), generated by the World Bank's Distortions to Agricultural Incentives research project using a methodology summarized in Anderson et al. (Reference Anderson, Kurzweil, Martin, Sandri and Valenzuela2008), provides a timely opportunity to estimate indexes of the trade- and welfare-reducing effects of different policy instruments. The database includes estimates of different agricultural policy instruments for 75 focus countries (listed in Appendix Table A) that together account for over 90% of the world's population, farmers, agricultural GDP, and total GDP. The estimates in the database are consistent estimates of annual NRAs and CTEs over the years 1955 to 2007. The country coverage is most complete for the years 1960 to 2004, so only that period is reported in this paper. The series contains data at the commodity level for a subset of agricultural products (called covered products) that account for around 70% of total agricultural production in each of the 75 countries.
The range of measures included in those NRA and CTE estimates is wide. By calculating domestic-to-border price ratios, the overall estimates include the price effects of all tariff and non-tariff trade measures (positive or negative), plus any domestic price measures (positive or negative), plus an adjustment for the output-price equivalent of direct interventions in farm input markets. Where multiple exchange rates operate, estimates of the import or export tax equivalents of that distortion are included as well. The database is especially well suited to the analysis in this paper because it separately identifies each of the price effects of the different policy instruments referred to above.
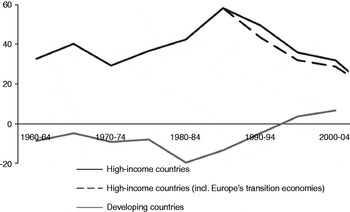
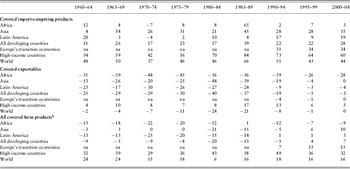
The most aggregated summaries of NRA estimates for covered products for developing and high-income focus countries, averaged using weights based on the gross value of production at undistorted prices, are provided in Figure 2. The Figure supports the widely held view that developing country governments had in place agricultural policies that effectively taxed their farmers through to the 1980s (consistent with Krueger et al., 1988, 1991), and that the extent of those disincentives has lessened since then. Indeed, since the mid-1990s those farmers have enjoyed slightly positive assistance on average. The figure also shows the growth of agricultural protection in high-income countries since the 1960s and its reversal on average after the 1980s (see details in Table 1). Consumers have experienced changes similar to producers in recent years (hence a graph is not included): in developing countries, consumers were effectively subsidized for most of the last 50 years, although that has lessened since the 1990s, while in high-income countries the implicit taxation of consumers from agricultural border measures rose until the late 1980s but has fallen since then.
Nominal rates of assistance to farmers in high-income and developing focus countries, all covered farm products, 1960 to 2007

Nominal rates of assistanceFootnote a for import-competing, exportable and all farm products, by region and globally, 1960–2004 (%)

Notes: a Weighted using the value of production at undistorted prices.
b Includes nontradables.
d Estimates for China pre-1981 and India pre-1965 are based on the assumption that the nominal rates of assistance to agriculture in those years were the same as the average NRA estimates for those economies for 1981–84 and 1965–69, and that the gross value of production in those missing years is that which gives the same average share of value of production in total world production in 1981–84 and 1965–69, respectively. This NRA assumption is conservative in the sense that for both countries the average NRA was probably even lower in earlier years.
Source: Anderson and Valenzuela (2008).
Africa is where there has been the least tendency to reduce the taxation of farmers and subsidization of consumers of farm products. Indeed, its average NRA has been negative in all five-year periods except the mid-1980s when international prices of farm products reached an all-time low in real terms. By contrast, both Asian and Latin American NRAs switched from negative to positive after the 1980s. Meanwhile, assistance to farmers in Europe's transition economies has trended upward following the initial shock in the early 1990s. In all four regions, agricultural policies have almost always involved consumer subsidization. Since the 1980s, however, food consumer subsidization in Asia, Latin America, and Europe's transition economies has gradually disappeared and been replaced by a small degree of taxation (Anderson, Reference Anderson and Anderson2009).
Assistance to import-competing farmers is typically well above that for producers of exports (Table 1), and conversely for consumers of farm products. This means there is an anti-trade bias in the structure of agricultural distortions. In the case of developing countries, where the import-competing NRA is positive and the NRA for exportables is negative, the two tend to offset each other such that the overall sectoral NRA is close to zero. Such a sectoral average can thus be misleading as an indication of the extent of distortion within the sector. It can also be misleading when comparing across countries that have varying degrees of dispersion in their NRAs for different farm industries.
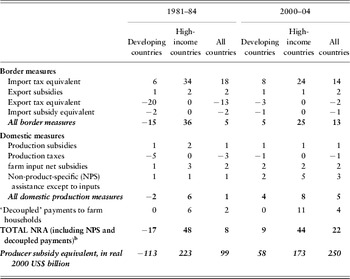
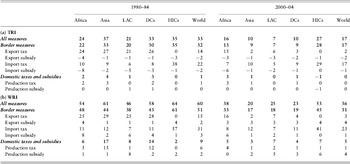
Of most relevance for this paper is the instrument level NRA and CTE data. Table 2 summarizes the contributions of different policy measures to the overall estimated NRAs for the two periods 1981–84 and 2000–04. It shows that trade measures account for the largest share of the total NRA for both developing and high-income countries. The CTEs, not shown for space reasons, look similar at that level of aggregation. It is the dominance of border measures that ensures that the two price distortion indicators are highly correlated: for all focus countries, covered products and available years in the panel set, the coefficient of correlation between NRAs and CTEs is 0.93.
Contributions to total agricultural NRA from different policy instruments,Footnote a high-income and developing focus countries, 1981–84 and 2000–04 (%)

Notes: a In the absence of data, it is assumed the share of input tax/subsidy, domestic production tax/subsidy and border tax/subsidy payments for non-covered farm products are the same as those for covered farm products. The first period begins in 1981 because that was the first year for which estimates for China are available.
b All entries have been generated by dividing the producer subsidy equivalent of all (including NPS and ‘decoupled’) measures by the total agricultural sector's gross production valued at undistorted prices.
Source: Authors' compilation based on data in Anderson and Valenzuela (2008).
The Distortions to Agricultural Incentives database also includes measures of so-called decoupled support and other non-product-specific assistance. Because decoupled payments and non-product-specific supports are not reported at the product level in the database, they are not captured in the ITRI and IWRI estimates. However, they are important for the overall story of agricultural policy – especially in high-income countries where there has been a move to forms of support decoupled from production in recent decades – and so an attempt is made in the Caveat section below to gauge the potential contribution of these measures.
Estimates of the instrument indexes
The results from estimation of ITRIs and IWRIs are summarized in Table 3 for the main regions of the world. The first thing to notice is that border measures dominate in terms of the trade- and welfare-reducing effects of agricultural policies in all regions being studied (hence the inclusion in that table of just the production side estimates, since the consumption side ones are similar – see Croser and Anderson (Reference Anderson and Croser2010) ). This comes partly from the dominance of border measures in the NRA/CTE estimates, but also from the fact that a border measure affects both sides of the market, whereas a domestic measure affects only one side (production or consumption).
IPDI contributions from different policy instruments on the production side to the TRI and WRI for covered products by different policy instruments,Footnote a by region,Footnote b 1980–84 and 2000–04(%)

Notes: a Each instrument share is computed in the following two steps: (1) indices are converted to constant 2000 $US by multiplying the index by the average value of production for that instrument group at the country level; (2) each instrument dollar amount index is divided by the country average value of production. The measures in the table – which are like a weighted average of an overall regional index – therefore reflect both the absolute size of the index for each policy instrument and the relative importance of that policy instrument in the region.
b Asia excludes Japan; LAC=Latin America and the Caribbean; DCs=developing countries; HICs=high-income countries; and World includes Europe's transition economies for 2000–04 (not shown separately) but not for 1980–84.
Source: Authors' compilation based on data in Anderson and Valenzuela (Reference Anderson and Valenzuela2008).
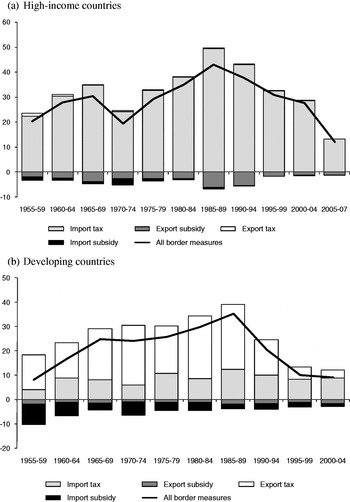
Within border measures, import taxes are the most significant reducer of global trade, followed by export taxes which were especially prominent in developing countries through to the 1980s (Figure 3). The other two categories of border measures (export and import subsidies) expand trade, but the ITRI estimates for these instruments are at such low levels that they have little offsetting impact on the trade-reducing effects of the trade-taxing border measures.
Relative contributions of different border policy instruments to the TRI, high-income and developing focus countries, 1955 to 2004 (%)

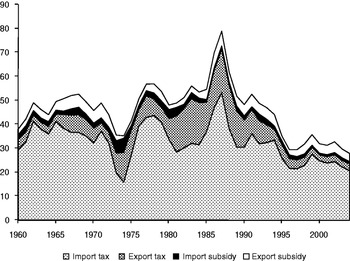
As for relative contributions to the aggregate WRI, border measures dominate in all time periods, accounting for between 86% (1965–69) and 96% (1980–84) of global welfare losses (lower half of Table 3). Import taxes contribute most to the reduction in global welfare due to border measures, followed by developing countries' export taxes (Figure 4). For the developing country group, export taxes were the most significant contributor to welfare losses prior to the 1990s, but their relative importance has fallen in all regions since then.
Relative contributions of different border policy instruments to the WRI, all focus countries, 1960 to 2004 (%)

A comparison of the ITRI and IWRI results in Table 3 with the NRAs in Table 2 reveals the usefulness of the index methodology. In the NRA aggregates, the two most-distorting policy instruments (export and import taxes) more or less offset each other, while for the ITRI and IWRI they are reinforcing. Notice also that import taxes in 2000–04 account for slightly more than 100% of border measure NRAs globally, but those taxes account for around only three-quarters of the global IWRI.
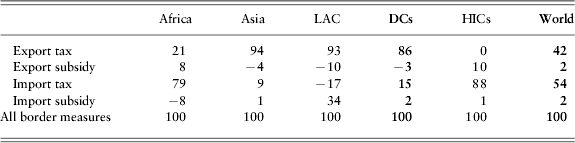
The global border measure WRI peaked for the world in 1985–89, after which it nearly halved to just over 30% by 2000–04. Table 4 reveals the relative contributions of each of the four border measures to this overall reduction, for each of the studied regions and globally. Import and export taxes contribute just over and a little under half of the overall global reduction, respectively. For developing countries, however, the fall was driven overwhelmingly by falls in export taxes: they account for 86% of their WRI reduction. This dramatic result receives no comment in the previous studies cited at the start of this paper, not only because they include no time series but also because they ignore export taxes (as well as production taxes and import subsidies).Footnote 9
Contributions of different policy instruments to the decline in the border policy component of the agricultural WRI,Footnote a by region, between 1985–89 and 2000–04 (%)
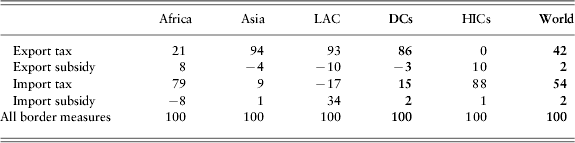
Note: a Contributions are computed using the value of the IWRI in constant 2000 $US billions.
Source: Authors' compilation based on data in Anderson and Valenzuela (Reference Anderson and Valenzuela2008).
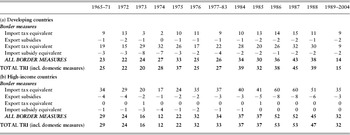
Finally, annual time series reveal what happens to the relative contributions of different policies when international prices for farm products spike up or down. Insulation of domestic markets from such shocks, by varying border trade restrictions, is a common practice in both developing and high-income countries (Anderson and Nelgen, Reference Anderson and Nelgen2010). The net effect is clear in Table 5 for the TRI, for example: when international prices spike up, as in 1973–74, the contribution of import tariffs falls dramatically but the contribution of export taxes rises, and conversely when international prices collapse, as in 1986.
ITRI contributions from different policy instruments to the total agricultural TRI, developing and high-income countries, 1965–2004 (%)

Source: Anderson and Nelgen (Reference Anderson and Nelgen2010), based on data in Anderson and Croser (2009).
Caveats
A number of important caveats are worth mentioning. Perhaps the most important caveat has to do with the simplifying assumptions about elasticities. For lack of a comprehensive set of country- and commodity-specific own-price elasticity estimates, it is assumed above that the own-price elasticity of supply (and also of demand) within a country is the same for each farm product. The effect of this assumption on the ITRI and IWRI estimates is likely to be small because those indexes draw on the instrument production and consumption distortion indexes which each have three terms (e.g., for the IPDI they are the production-weighted average price distortion, its variance, and its covariance with the output price elasticity of supply) and the elasticity appears only in the third term. We also ignore cross-price effects, as the algebra becomes far more complex if we include them. And in the aggregation of country producer and consumer distortion indexes, we assume the aggregate marginal response of domestic demand to a price change is the same as the aggregate marginal response of domestic supply. To explore this last assumption, we altered the weights on consumption and production (the a and b terms in the ITRI and IWRI formulae, respectively); we found that this left the estimates for the border ITRI and IWRI almost unchanged at the aggregate level for all countries. This is not surprising given the high correlation between the IPDI and ICDI for border distortions.
Another caveat is that the TRI and WRI do not include forms of support that are not given at the product level. In the Anderson and Valenzuela (Reference Anderson, Kurzweil, Martin, Sandri and Valenzuela2008) database, non-product-specific (NPS) assistance in some countries is a significant component of the overall agricultural sector distortion rate (see Table 2). NPS assistance is reported there in three forms: general non-product-specific assistance, those farm input subsidies for high-income countries that are not attributed at the product level in the database, and so-called decoupled payments. Recalling that the TRI (or WRI) is defined as the ad valorem trade tax rate, which, if applied uniformly across all tradable agricultural commodities in a country, would generate the same reduction in trade (or economic welfare) as the actual cross-product structure of NRAs and CTEs for that country, it is possible to make a simple assumption to incorporate NPS measures. If one assumes 100% pass-through of NPS distortions to producer prices, the upper bound of the contribution of NPS support can be derived by attributing the NRA from NPS equally to the ad valorem NRA for each covered product. When this is done, it makes little difference to the estimated indexes for developing countries, while for high-income countries it reduces the decline in the estimated WRI. It provides an approximate guide to the increased relative importance of decoupled payments and non-product-specific support to the overall WRI for high-income countries (see Figure 6 of Croser and Anderson, Reference Anderson and Croser2010)Footnote 10
Conclusions
This paper contributes to the theoretical and empirical literature on trade and welfare reduction indexes. On the theory side, it develops a method of estimating trade and welfare reduction indexes for individual policy instruments from estimates of the rates of distortions of producer and consumer prices. The main contribution is to show that, provided one is willing to make simplifying assumptions about price elasticities, it is possible to use the same data as existing NRA/CTE (or PSE/CSE) indicators to estimate superior indicators of the relative contribution of different policies to global reductions in trade and welfare. Empirically, the paper's main contribution is to apply the methodology to generate time series of indexes for agricultural products. The paper estimates the contributions for a greater set of policy instruments than previous studies. Further, the indexes are generated for 75 developed and developing countries annually over the past half century. They are useful for monitoring national policy developments and making cross-country comparisons and, when updated, the TRIs will be useful also in trade negotiations.
The most significant result empirically is the importance of export taxes prior to the 1990s and their contribution to the fall in the global trade- and welfare-restrictiveness of agricultural policies over the past two decades. Previous studies aimed at estimating the relative contributions of different policy instruments ignore export taxes (and import subsidies and production taxes) altogether, and find that import taxes contributed as much as 85% of the reduction to global farm trade and 93% of global welfare losses from agricultural policies in 2001. By contrast, this paper finds that export taxes played a significant role in the fall in aggregate global trade and welfare reduction indexes (contributing as much as one-third in some time periods). It is likely they will continue to do so when international food prices rise – as indeed happened in 2008 (Anderson and Nelgen, Reference Anderson and Nelgen2010). We also find that export taxes have contributed substantially to the almost halving of the global WRI (for border measures) from its peak in the latter 1980s. Globally, import and export taxes each contributed roughly half to the decline in the IWRI for border measures. For the most recent period reported above (2000–04), import taxes are certainly by far the dominant instrument, a result that reinforces the conclusions of earlier studies that import market access is the most important of the ‘pillars’ being negotiated in the agricultural part of the WTO's Doha Development Agenda. But the widespread re-emergence of food export taxes in 2008 is a reminder that those measures too need to be disciplined by the WTO if that institution is to fulfill its welfare-enhancing role of reducing uncertainty in international trade. Hence the importance of including such instruments in the estimation of TRIs and WRIs.
TECHNICAL APPENDIX: DERIVATION OF TRADE AND WELFARE REDUCTION INDEXES AT THE POLICY INSTRUMENT LEVEL
Consider the market for one product, good i, which is affected by a combination of measures that distort consumer and producer prices. One type of distorting measure is a border measure (such as an import tariff or import subsidy), which affects producers and consumers of the good. The distorted domestic price in country j from a border measure, p ij, is related to the world price, p i*, by the relation p ij=p i*(1+t ij ), where t ij is the rate of distortion of the border price in proportional terms. Using this relation, the change in imports in the market for good i in country j from a border policy instrument, ΔM Bij,Footnote 11 is given by:

where the quantities of good i demanded and supplied in country j, x ij and yij, are assumed to be functions of own domestic price alone: x ij=x ij(p ij)and y ij=y ij(p ij) respectively. The neglect of cross-price effects, among other things, makes the analysis partial equilibrium.
Strictly speaking, this result holds only for small distortions. In reality, rates of distortion to agricultural markets are not small. If, however, it is assumed that the demand and supply functions are linear, the reduction in imports is given by equation (1) with dx ij/dp ij and dy ij/dp ij equal to constants. If the functions are not linear, this expression provides an approximation to the loss.
Now consider the same import-competing good to be subject also to domestic distortions to producer and consumer prices. For the producers of the good, the overall distorted domestic producer price in each country, p ijP, is given by p ijP=p i* (1+(s ij+t ij)) where s ij is the rate of domestic producer distortion in proportional terms (here, relative to the border price). For the consumers of the good, the distorted domestic consumer price, p ijC, is given by p ijC=p i* (1+(r ij+t ij)) where r ij is the rate of the domestic consumer distortion in proportional terms. If r ij=s ij=0, then p ijC=p ijP=p ij. In general, r ij≠s ij≠0. An example, with linear demand and supply curves of this situation, is depicted in Figure 1.
With both border and domestic distortions, the change in imports in the market for good i in country j, ΔM Tij, is given byFootnote 12:

The change in imports from domestic measures alone, ΔM Dij,Footnote 13 is given by ΔM Dij=p i*Δx ij−p i*Δy ij where Δx ij in this instance is the change in quantity demanded in moving from p ij to p ijC because of the domestic consumption distortion, r ij, and Δy ij is the change in quantity supplied in moving from p ij to p ijP because of the domestic production distortion, sij. This can be written as:

With n import-competing products each subject to different levels of distortions, the aggregate reduction in imports for country j, in the absence of cross-price effects, from border and domestic measures separately, can be found by summing equations (1) and (3) across products, respectively.
Setting the result of those summations equal to the reduction in imports from a uniform border measure (B j) and a uniform domestic measure (D j) gives:


where p ijD is the price at the intersection of import demand and export supply where domestic distortions (additional to border distortions) are taken into account.
Solving for B j and D j gives an index of average tariff rates across commodities for all border policy instruments and domestic policy instruments, respectively, since what is held constant is the volume of imports valued at the relevant year's prices. For border prices, the scalar indexes are given by:

where


and
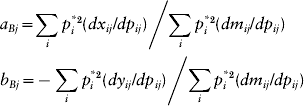
and where the i subscript used in equations (6) refers to that subset of products with a border policy instrument.
B j is computed as a weighted average of producer and consumer distortions (equation (6a)). R Bj and S Bj are indices of average consumer and producer border distortions, each arithmetic means. Since B j is an index of border measures, the distortions being aggregated on both the producer and consumer side are t ij values. The weights for each commodity to compute R Bj and S Bj, u Bij and v Bij,, are proportional to each country's marginal response of domestic production or consumption to changes in international trade prices. Each of the weights in (6b) and (6c) can be written as functions of, among other things, the domestic price elasticities at either the protected trade situation, or the free trade situation:

and

where σBij and ρBij are elasticities of demand and supply, respectively, at the protected trade situation when border measures are in place. When elasticities of demand (or supply) are constant across goods for a particular policy instrument, the weights in equation (7) collapse to share weights. We estimate our indices using weights at the protected trade situation because data are available only at that point.
For domestic policy instruments, the analogous ITRI expressions are given by:

where


and
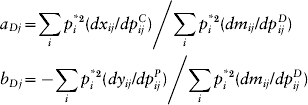
and where the i subscript used in equations (8) refers to that subset of products with a domestic policy instrument.
The index D j gives the reduction in trade associated with a move from border support to border plus domestic support. Analysis of these equations is analogous to that for B j. The weight u Dij (or v Dij) is proportional to each product's response to domestic consumption (or production) to changes in prices from a border-only distortion to a border-plus-domestic distortion. These weights differ from those in equations (6) because they are computed at different prices. Once again, however, the weights can be written as functions of domestic price elasticities.
Consider now the derivation of the IWRI, which captures the overall effect of an individual policy instrument across many commodities on a country's economic welfare. The derivation follows the same steps as the derivation of the ITRI. It is assumed that a border measure is first implemented, and this may be supplemented by additional domestic protection.Footnote 14 The border measure distortion in the market for good i in country j creates a welfare loss, L Bij. In partial equilibrium terms, this loss is given by the sum of the change in producer plus consumer surplus net of the tariff revenue. The loss of producer and consumer surplus is given by:

where the demand for and the supply of good i in country j are again functions of own domestic price alone.
Again, this result holds only for small distortions. If, however, it is assumed that the demand and supply functions are linear, the welfare loss is given by (9) with dx ij/dp ij and dy ij/dp ij equal to constants, in which case welfare losses are defined by the familiar triangular-shaped dead-weight loss areas under the demand and supply curves for the good in a small open economy. If the functions are not linear, this expression provides an approximation to the loss.
Equation (9) yields the fundamental result that the loss from a tariff is proportional to the square of the tariff rate. This holds because the tariff rate determines both the price adjustment and the quantity response to this adjustment (Harberger, Reference Harberger1959).
With domestic distortions also in place, the welfare loss of producer and consumer surplus is given by:

Assuming that domestic measures are imposed as a supplement to border measures, the welfare loss from domestic producer and consumer measures is given by the difference between equations (10) and (9).Footnote 15 Algebraically:

The aggregate welfare loss for a country from the separate border and domestic measures, in the assumed absence of cross-price effects, can be found by summing equations (9) and (11) across all import-competing products, which gives the left-hand side of equations (12) and (13) below, respectively. Setting the result equal to the welfare loss from a uniform border measure (WB j), and a uniform domestic measure (WD j), respectively, gives the following expressions:

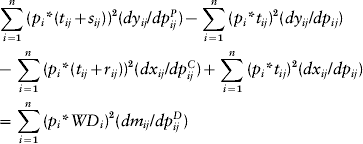
Solving for the IWRI border measure (WB j) first gives an expression in a similar form to equations (6):

where

and u Bij, v Bij, a Bj and b Bj are as given in equations (6).
WB j is the uniform tariff that gives the same deadweight loss as that of the actual border distortions in country j. It is an appropriately weighted average of the level of distortions of consumer and producer prices from border measures. It is a mean of order two, which is critically different from the ITRI in equations (6). As with the ITRI, the index is constructed by working with the production and consumption sides of the economy separately, and aggregating the production and consumption indexes in the last step.
The IWRI for domestic measures, WD j, is given by a more complex expression owing to the need to find the difference in welfare between all measures and border measures. As such the expression has four terms, instead of the usual two:

Each of the ITRI and IWRI measures can be written also for exportable products. For an exportable good, a positive price distortion (such as an export subsidy) reduces welfare in the same way as a positive import-competing distortion (such as an import tax), but the positive price distortion for an exportable increases trade whereas a positive import-competing price distortion reduces trade. That is why it is necessary to keep separate track of import-competing and exporting products for the purpose of estimating ITRIs and IWRIs.
The ITRI for border measures for exportable products is the same as that for equations (6) where there are z exportable products indexed i and R BjM and S BjM are replaced by:

As in the previous section, when estimating indexes for exporting products, they are estimated separately for producers and consumers and aggregated only in the last step. The aggregates in equation (16) are the weighted average levels of distortions to consumer and producer prices for exportable products, respectively, with weights u Bij and v Bij given in equations (6b) and (6c). Importantly, distortions to exportable products enter equation (16) as negative values. This is because whilst a lowering of t ij in the import-competing sub-sector reduces the reduction index, a lowering of t ij in the exporting sub-sector increases it.
The ITRI measure B j computed in this way can be regarded as the country j export tax, which, if applied uniformly across all products, would give the same reduction in trade as the combination of individual border measures distorting consumer and producer prices in the exporting sub-sector.
The ITRI for domestic measures, and the IWRI for border and domestic measures separately, can each be adapted to the exportables sub-sector from the import-competing sub-sector expressions in an analogous way, and the exporting instrument indexes have the same properties as the indexes for the import-competing instruments.
Focus countries, Agricultural Distortions Project

Source: Anderson (Reference Anderson and Anderson2009, Appendix B).