Introduction
Designers are tasked with shaping our world. They are the agents of change working to understand problems, empathize with users, challenge constraints, and using the tools of their trade, craft effective solutions (Nagai and Gero, Reference Nagai and Gero2012). Creativity is not only a characteristic of the designer and a tool for them to use, but it is also one of the metrics used to judge their work (Shah et al., Reference Shah, Smith and Vargas-Hernandez2003). Creativity is the key to innovation and at the core of designers’ success. A deeper understanding of creativity and design will promote the development of effective tools to support design, augment the creative process, and drive future innovation.
Prior work has shown the impact of physical activity on creativity (Blanchette et al., Reference Blanchette, Ramocki, O'Del and Casey2005; Netz et al., Reference Netz, Tomer, Axelrad, Argov and Inbar2007; Slepian and Ambady, Reference Slepian and Ambady2012; Oppezzo and Schwartz, Reference Oppezzo and Schwartz2014; Kuo and Yeh, Reference Kuo and Yeh2016). The evidence of these studies converge to the idea that physical activity may lead to more creative problem solving. This study builds on this prior work by testing if the mode by which physical activity occurs has any significant impact on design outcomes. These modes include standard physical activity through walking and simulated physical activity through means of virtual reality (VR). If simulated physical activity can produce equal or higher creativity than true physical activity, then it shows that there may be non-kinesthetic positive impacts of physical activity on creativity. It would also provide designers with a pleasant, convenient alternative for allowing their intuition to digest the design problem effectively over time.
To better understand the effectiveness of each intervention in this study, a third condition, one without relation to physical movement but also allows for incubation, is included as a baseline distractor task. The distractor task in this study is known as the Card Rotation Test, and the specifics of this activity are described further in the "Methods" section (Ekstrom et al., Reference Ekstrom, French, Harman and Derman1976). An assessment of mood is also studied to understand its impact on results across each condition, as prior work has also established mood as a key factor in creativity (Ashby et al., Reference Ashby, Isen and Turken1999; Akinola and Mendes, Reference Akinola and Mendes2008; Cohen and Ferrari, Reference Cohen and Ferrari2010; Baas et al., Reference Baas, De Dreu and Nijstad2011; Verhaeghen et al., Reference Verhaeghen, Joormann and Aikman2014). Therefore, it would be beneficial to know if the mood of participants may have contributed to the results across each mode of physical activity. If so, then awareness of one's mood can lead to modification of how one approaches ideation in their design process. This may lead to more efficient time allotment to ideation and increase the chances of reaching a satisfactory design in terms of novelty and feasibility.
This study contributes a novel assessment of whether the use of virtual reality can produce the same creative output within designers as physical activity has been shown to produce in prior studies, where creative output is measured in terms of design solution novelty and feasibility. An analysis of self-reported mood is provided to compare the scores with the effect of each intervention: the Card Rotation Test, Physical Walking, or movement in Virtual Reality. The specific research questions in this study included in the following:
1) How do the novelty and feasibility of design solutions vary after exposure to each intervention, walking versus VR movement versus Card Rotation Test?
2) How do self-reported mood scores correlate with performance after exposure to each intervention, walking versus VR movement versus Card Rotation Test?
Background
Creativity is commonly described as the “creation of new and useful products, including ideas as well as concrete objects”, with creative people and processes supporting that goal (Sternberg, Reference Sternberg1999). Creativity is often judged in relation to past ideas developed across society, but it can also be judged individually, in relation to one's own set of ideas and history of problem solving (Fisher et al., Reference Fisher, Giaccardi, Eden, Sugimoto and Ye2005). Driven by its relationship to innovation, creativity is a topic of interest in design and across the arts and sciences (Sundström and Zika-Viktorsson, Reference Sundström and Zika-Viktorsson2003; Fisher et al., Reference Fisher, Giaccardi, Eden, Sugimoto and Ye2005; Sarkar and Chakrabarti, Reference Sarkar and Chakrabarti2011). Shah defines engineering design as an intersection of creativity and utility (Shah et al., Reference Shah, Smith and Vargas-Hernandez2003). In other words, they state that designs should not only be creative, but they should also meet some set of requirements desired by a client. They also break the concept of creativity into four measurable metrics: novelty, quality, quantity, and variety, where novelty is the uniqueness of an idea, quality is an idea's feasibility, variety is the amount of the design solution space covered across each idea, and quantity is the total number of ideas generated (Shah et al., Reference Shah, Smith and Vargas-Hernandez2003). As only one idea per design problem is generated in this study, the relevant creativity metrics for this study are the novelty and feasibility of the solution.
There has been a large quantity of work devoted to understanding and aiding creativity in design. Puccio et al. (Reference Puccio, Cabra, Fox and Cahen2010) overview many well-known methods and tools developed to enhance creativity, and Ranjan et al. (Reference Ranjan, Siddharth and Chakrabarti2018) review various measurements used in prior studies to measure the creativity of design outcomes. Moreno et al. (Reference Moreno, Blessing, Yang, Hernández and Wood2016) break down many of the approaches that designers may take to ideation into two types: intrinsic or extrinsic. Extrinsic ideation relies on prompts external to the designer as a guide for inspiration in creativity. Extrinsic approaches include the use of heuristics and designing by analogy. For example, Yilmaz et al. (Reference Yilmaz, Seifert and Gonzalez2010) developed a set of cognitive heuristics found to be employed by designers, which can be used to guide ideation with other designers in new contexts. Han et al. (Reference Han, Shi, Chen and Childs2018) combined the concepts of analogy and ontology into a computational tool that provides ideas that are both unique and useful for the design problem. Moreno et al. (Reference Moreno, Blessing, Yang, Hernández and Wood2016) compare extrinsic analogy methods such as WordTree and SCAMPER based on how they contribute to eliminating design fixation. Results found that both methods increased novelty, but WordTree was more efficient at eliminating fixation in designers.
In contrast to extrinsic ideation approaches, intrinsic ideation approaches such as reframing or incubation rely on the designer's intuition or prior experience (Moreno et al., Reference Moreno, Blessing, Yang, Hernández and Wood2016). Restrepo and Christiaans (Reference Restrepo and Christiaans2004) discuss reframing of the design problem as a recurring task throughout the design process, and that failure to do so may lead to design fixation, which limits innovation. Studer et al. (Reference Studer, Daly, McKilligan and Seifert2018) performed a qualitative content analysis to identify strategies used to reframe design problems, leading to more innovative outcomes. Aside from reframing, incubation is another intrinsic approach in which tasks are subconsciously processed and disparate elements are synthesized into novel combinations, a process known as creative intuition (Dane and Pratt, Reference Dane, Pratt, Hodgkinson and Ford2009). These intuitive connections can be distinguished from rational thinking or inductive reasoning by “the gap between evidence and conclusion” (Westcott, Reference Westcott1968; Raidl and Lubart, Reference Raidl and Lubart2001). The creative output produced during incubation is influenced not only by the duration of incubation but also the activities that occur during that time, as well (Moss et al., Reference Moss, Kotovsky and Cagan2007). In this study, real physical activity and simulated physical activity are implemented into the incubation period to understand and compare their effects on creativity.
Physical activity and creativity
Cognitive scientists have often described creativity as “fluid thought” (Slepian and Ambady, Reference Slepian and Ambady2012), leading many to study the relationship between fluid thought and fluid motion. Physical activity has been shown to increase creativity, with better results dependent on the type of movement (Slepian and Ambady, Reference Slepian and Ambady2012; Oppezzo and Schwartz, Reference Oppezzo and Schwartz2014; Kuo and Yeh, Reference Kuo and Yeh2016). Slepian and Ambady (Reference Slepian and Ambady2012) had participants ideate after fluid or non-fluid arm movements and found that fluid motions produce more creative results. Similarly, Kuo and Yeh (Reference Kuo and Yeh2016) found higher creativity in ideation performed simultaneously with free walking rather than walking in rigid, pre-defined routes. Oppezzo and Schwartz (Reference Oppezzo and Schwartz2014) conducted four studies in which participants were tasked with a combination of walking on a treadmill, staying seated, walking outside, and being rolled in a wheelchair outside. For each physical condition, the participants were asked to simultaneously perform creative tasks. Results showed that participants produced the most novel solutions when walking outside. Immediate and residual effects of aerobic exercise on creativity have also been shown, with exercises ranging from jogging and swimming to fast walking (Blanchette et al., Reference Blanchette, Ramocki, O'Del and Casey2005; Netz et al., Reference Netz, Tomer, Axelrad, Argov and Inbar2007).
Mood and creativity
There has been extensive research done exploring the relationship between mood and creativity. For instance, Baas et al. (Reference Baas, De Dreu and Nijstad2011) synthesized 102 references that demonstrate how positive moods increase creativity. Ashby et al. (Reference Ashby, Isen and Turken1999) concluded that a positive mood can lead to creative problem solving, which is facilitated by greater cognitive flexibility. However, several studies also suggest negative moods, such as anger, may improve creativity more than positive moods (Akinola and Mendes, Reference Akinola and Mendes2008; Cohen and Ferrari, Reference Cohen and Ferrari2010; Baas et al., Reference Baas, De Dreu and Nijstad2011; Verhaeghen et al., Reference Verhaeghen, Joormann and Aikman2014). Baas et al. (Reference Baas, De Dreu and Nijstad2011) demonstrated that anger enhances creativity briefly, followed by a steep decline due to resource depletion. Fear and anxiety have also been associated with lower creativity (Baas et al., Reference Baas, De Dreu and Nijstad2008). However, because anxiety is an inevitable response to any new experience in an unfamiliar space, it may sometimes be channeled to positively impact creativity, depending on surrounding factors and behaviors (Oenning-Hodgson, Reference Oenning-Hodgson2006).
Conversely, the type of creative task has been shown to affect mood. Chermahini and Hommel (Reference Chermahini and Hommel2012) showed that divergent thinking leads to better mood states, while convergent thinking leads to lower mood states (Bar, Reference Bar2009; Chermahini and Hommel, Reference Chermahini and Hommel2012). Outside of creativity, mood has been shown to impact individuals’ reliance on their intuition, particularly in risk-taking and decision-making scenarios (Dane and Pratt, Reference Dane, Pratt, Hodgkinson and Ford2009). A reciprocal relationship between mood and cognition has also been explored, but the findings were inconclusive (Bar, Reference Bar2009; Chermahini and Hommel, Reference Chermahini and Hommel2012).
For this study, mood is defined and distinguished from emotion based on extensive comparisons from Desmet et al. (Reference Desmet, Vastenburg and Romero2016). Moods are continuous, sometimes lasting days at a time, and have some influence over all responses, thoughts, and behaviors during that time. Emotions are short term and often of high intensity, responding to a single external stimuli. The two are not completely disconnected; however, as a collection of emotions over time can create mood states, and moods can allow certain emotions to develop more quickly. A variety of tools have been developed to specifically measure mood, such as PANAS and Pick-a-Mood (Watson et al., Reference Watson, Clark and Tellegen1988; Desmet et al., Reference Desmet, Vastenburg and Romero2016). For this study, the Brunel Mood Scale (BRUMS) was selected, which has been commonly used in assessing mood with athletes to gauge the effects on performance (Terry et al., Reference Terry, Lane and Fogarty2003; Lan et al., Reference Lan, Lane, Roy and Hanin2012). It has also been used in design studies, such as when Zhang et al. (Reference Zhang, Si, Chung, Du and Terry2014) investigated the effect of mood on design creativity in three different experimental conditions (Zhang et al., Reference Zhang, Si, Chung, Du and Terry2014). The BRUMS survey will be discussed in more detail in the "Methods" section.
Virtual reality
Researchers have previously taken interest in the impact of virtual reality on design processes. For example, Agulló et al. (Reference Agulló, Montagud and Fraile2019) have investigated design requirements for products in virtual worlds, such as when 360-degree videos should implement features as fixed position or always visible. Maher et al. (Reference Maher, Rosenman and Merrick2007) list key requirements for improving multidisciplinary design using VR: the ability to display the full artifact in multiple views, as well as any underlying relationships, and compatibility with other design tools. Several studies are also beginning to consider specifically how virtual reality can improve creativity. Yang et al. (Reference Yang, Lin, Cheng, Yang, Ren and Huang2018) compared participants generating a solution to a design prompt using pencil and paper to those responding within a virtual reality environment. The results showed that the solutions generated through virtual reality were of higher quality. Tang et al. (Reference Tang, Au and Leung2018) used virtual reality to improve students’ understanding of geometric relationships, which also improved their creative output. Gerry (Reference Gerry2017) provides virtual reality video from a painter's point of view so that one may empathize with the creative process of artists. Thornhill-Miller and Dupont (Reference Thornhill-Miller and Dupont2016) assert that virtual reality has been underused given its advanced development, and they propose several new ways in which virtual reality technologies should be directed toward improving creativity. These directions include providing gaming elements to the problem-solving process, improving environmental influences, and modifying self-perception, among others.
Comparisons of physical activity with virtual reality have also been done before. Plante et al. (Reference Plante, Aldridge, Bogden and Hanelin2003) found that when paired with exercise, virtual reality can improve some of the benefits of physical activity. A 30-min virtual reality biking experience paired with exercise (stationary biking) produced higher energy levels and less tiredness than the same virtual reality experience without exercise. The VR with exercise enhanced enjoyment, while the VR without exercise increased tension in participants. A similar study, using walking instead of bicycling, found that participants walking in a lab for 20 min, in connection with simulated VR walking, made participants the most relaxed and least tense compared to VR alone or walking outside (Plante et al., Reference Plante, Cage, Clements and Stover2006). Participants also had less energy after the VR experience alone, compared to walking outside.
Virtual reality was selected as an alternative intervention in this study because of its potential value as a tool and the immersive experience it can provide. VR has been shown to be an effective tool for exposure therapy, particularly with anxiety disorders (Wallach et al., Reference Wallach, Safir and Bar-Zvi2009; Meyerbroker and Emmelkamp, Reference Meyerbroker and Emmelkamp2010; Anderson et al., Reference Anderson, Price, Edwards, Obasaju, Schmertz, Zimand and Calamaras2013). It has also been explored to treat acute pain (and accompanying anxiety), during medical procedures (Wright et al., Reference Wright, Hoffman and Sweet2005; Hoffman et al., Reference Hoffman, Chambers, Meyer, Arceneaux, Russell, Seibel, Richards, Sharar and Patterson2011; Keefe et al., Reference Keefe, Huling, Coggins, Keefe, Zachary Rosenthal, Herr and Hoffman2012). Both uses are predicated on the virtual environment being immersive and distracting to shift cognitive focus away from pain or, in the case of therapy, to react to an experience in a genuine manner. Here, we sought to shift the focus of designers away from the design task while providing the virtual experience of going for a walk. This potentially taps into any non-kinesthetic positive impacts of physical activity on creativity.
Methods
Participants
This study was conducted with a total of 18 participants from an undergraduate industrial design studio class at the Georgia Institute of Technology. Demographic surveys show that the study consisted of seven male and eleven female participants, all within the 20–29-year age range. Students had all completed at least 2 years of the program and had a minimum grade point average (GPA) of 3.0, where the GPA scale allows a 4.0 maximum. The study was performed across a total of eight sessions, with sessions ranging from one to five participants, based on the availability of the students. Two of the sessions were administered with permission from instructors during studio class time. Participation was voluntary and not required as part of any class. Informed consent was obtained from each participant, and they were each compensated $10 at the completion of the study. The study protocol was approved by the Georgia Tech Institutional Review Board. Sessions outside of the studio class were conducted in an isolated conference room at Georgia Tech.
Procedure and experimental conditions
Each session lasted approximately 75 min. Sessions began by having participants fill out a demographic survey, followed by the Brunel Mood Scale Questionnaire. Next, participants used a Google Cardboard (Google, 2017) device paired with a Nexus 5 or Samsung Galaxy S7 phone to complete the Google Cardboard usage tutorial and experience a baseline virtual reality environment. This was to ensure that when participants reached the portion of the study that includes virtual reality, they could use the full time allotted as an immersive walking experience, with no time wasted learning the device. Following the baseline virtual reality exposure, participants individually completed nine design tasks, lasting 6.5 min each. Finally, they completed a brief survey of their experience at the end of the session.
For the nine design tasks, three design tasks were assigned to each of the three types of incubation conditions: Card Rotation Test, Physical Walking, and Virtual Reality. All design tasks for a single condition were completed in sequence before moving on to the next condition. Design tasks were presented as word problems in a paper packet, with a cover sheet identifying the design task by its associated letter code (A–I). The packet included the prompt, instructions about the associated intervention, space to sketch a solution, and if applicable, the Card Rotation Test.
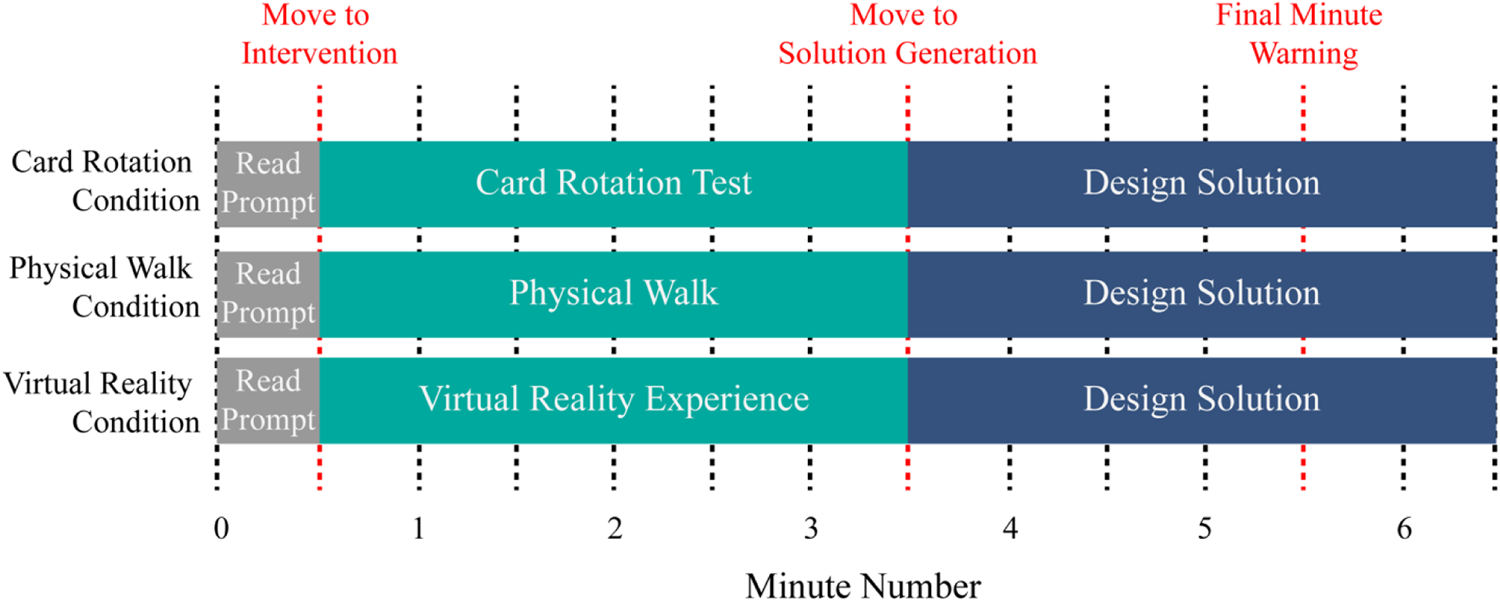
An example design task timeline for each condition given is shown in Figure 1. A total of 6 min and 30 s were designated for each design task, starting with 30 s for the participant to review the design prompt. After reading the prompt, the participant engaged with an intervention for 3 min, then spent the remaining 3 min sketching a single solution to the prompt. If participants were concerned about their own sketching ability, they were allowed to provide written descriptions to go alongside sketches. Participants received time warnings from the researcher after 30 s (to move to the incubation condition), then after 3 min and 30 s (to move to design solution generation phase), and lastly after 5 min and 30 s (1 min remaining to finish the task).
An overview of the design task timing for each of the three conditions.

As Dane and Pratt (Reference Dane, Pratt, Hodgkinson and Ford2009) state, the biggest difficulty with studying intuition is measuring if the participant is using intuitive or analytical processing. Limiting the sketching time to 3 min is an effort to ensure the participants rely on their initial, intuitive solutions. The timing was chosen as similar time frames have been performed in prior work studying creativity in relation to incubation, as well as physical activity. For example, Dijksterhuis et al. (Reference Dijksterhuis, Bos, Nordgren and Van Baaren2006) provided 4-min distractions before decision making. Dijksterhuis (Reference Dijksterhuis2004) asserts that incubation appears to be feasible within minutes if the problems are simple enough that they do not require deep insight into the environment. For physical activity, Oppezzo and Schwartz (Reference Oppezzo and Schwartz2014) used 4 min for all walking and sitting conditions, and Kuo and Yeh (Reference Kuo and Yeh2016) asked participants to walk for 2 min before task completion. As Blanchette et al. (Reference Blanchette, Ramocki, O'Del and Casey2005) used a larger time frame, asking participants to use 30 min of aerobic exercise, this only shows that physical activity has produced significant results across a wide time scale. Given that the amount of time walking or using VR in our study is only 3 min per design task, 9 min total, it is less likely that energy levels would drop as significantly as shown in prior studies (Plante et al., Reference Plante, Cage, Clements and Stover2006).
Card Rotation condition
For the Card Rotation condition, participants remained seated after reading the design prompt and completed one page of the Card Rotation Test. The Card Rotation Test is a paper-based cognitive assessment of spatial abilities in which participants are asked to compare a sequence of shapes to a master shape and mark whether the shapes are rotated versions of the master shape or different shapes (Ekstrom et al., Reference Ekstrom, French, Harman and Derman1976). The test consists of 20 rows, and each row has 9 total shapes. Rows begin with a master shape, followed by eight additional shapes that may or may not be a rotated version of the master shape. Underneath the eight comparison shapes, two boxes are available for participants to mark whether the shape is similar or different than the master shape. Once a row has been fully assessed, participants move to a new row with a new set of shapes, and they continue this process for 3 min. The task was included in this study as a baseline distractor task for comparison of intervention effectiveness.
Physical Walking condition
For the Physical Walking Condition, participants physically walked for 3 min after reading the design prompts. Participants walked both inside and outside the testing location. Participants walked a route outside on the Georgia Institute of Technology's campus that had been mapped in 3D on Google Maps. The only portion of the walk that was inside was from the testing room to the door leading outside. This distance was just a very small portion of the walk (10–15 feet). Each participant walked the exact same route. The control of the walking space was that each participant walked the exact same route, and participants avoided interactions with anything or anyone along the route. The weather was clear during all testing sessions and temperatures ranged from approximately 65–80 F. Participants were instructed not to use their phones or talk to other individuals while walking. They also carried a timer that notified them when it was time to return to the testing location to begin sketching solutions.
Virtual Reality condition
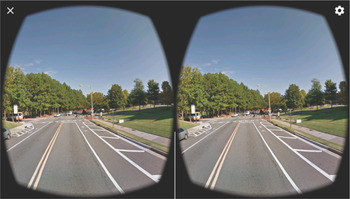
In the Virtual Reality Condition, after reading the design prompts, participants remained seated in a rolling, swivel chair, and engaged with a virtual reality experience using a Google Cardboard device paired with a Nexus 5 or Samsung Galaxy S7 phone. The Google Street View application was installed on the phone and set to 771 Ferst Drive NW, Atlanta, GA 30313. This location was selected for its proximity to the physical testing location on the Georgia Institute of Technology's campus, and it replicated the entire outdoor route of the walking condition. This decision was also made through preliminary testing of multiple types of virtual environments. It was determined that participants should have a virtual environment as visually realistic as possible, which allowed them to move through, look around, etc., as opposed to an environment that was entirely video based or looked more pixelated/less realistic. An example of the view shown in this activity is found in Figure 2. Participants were instructed to move around campus in the virtual environment using the provided navigational arrows.
The Georgia Tech campus shown using the Google Street View application.

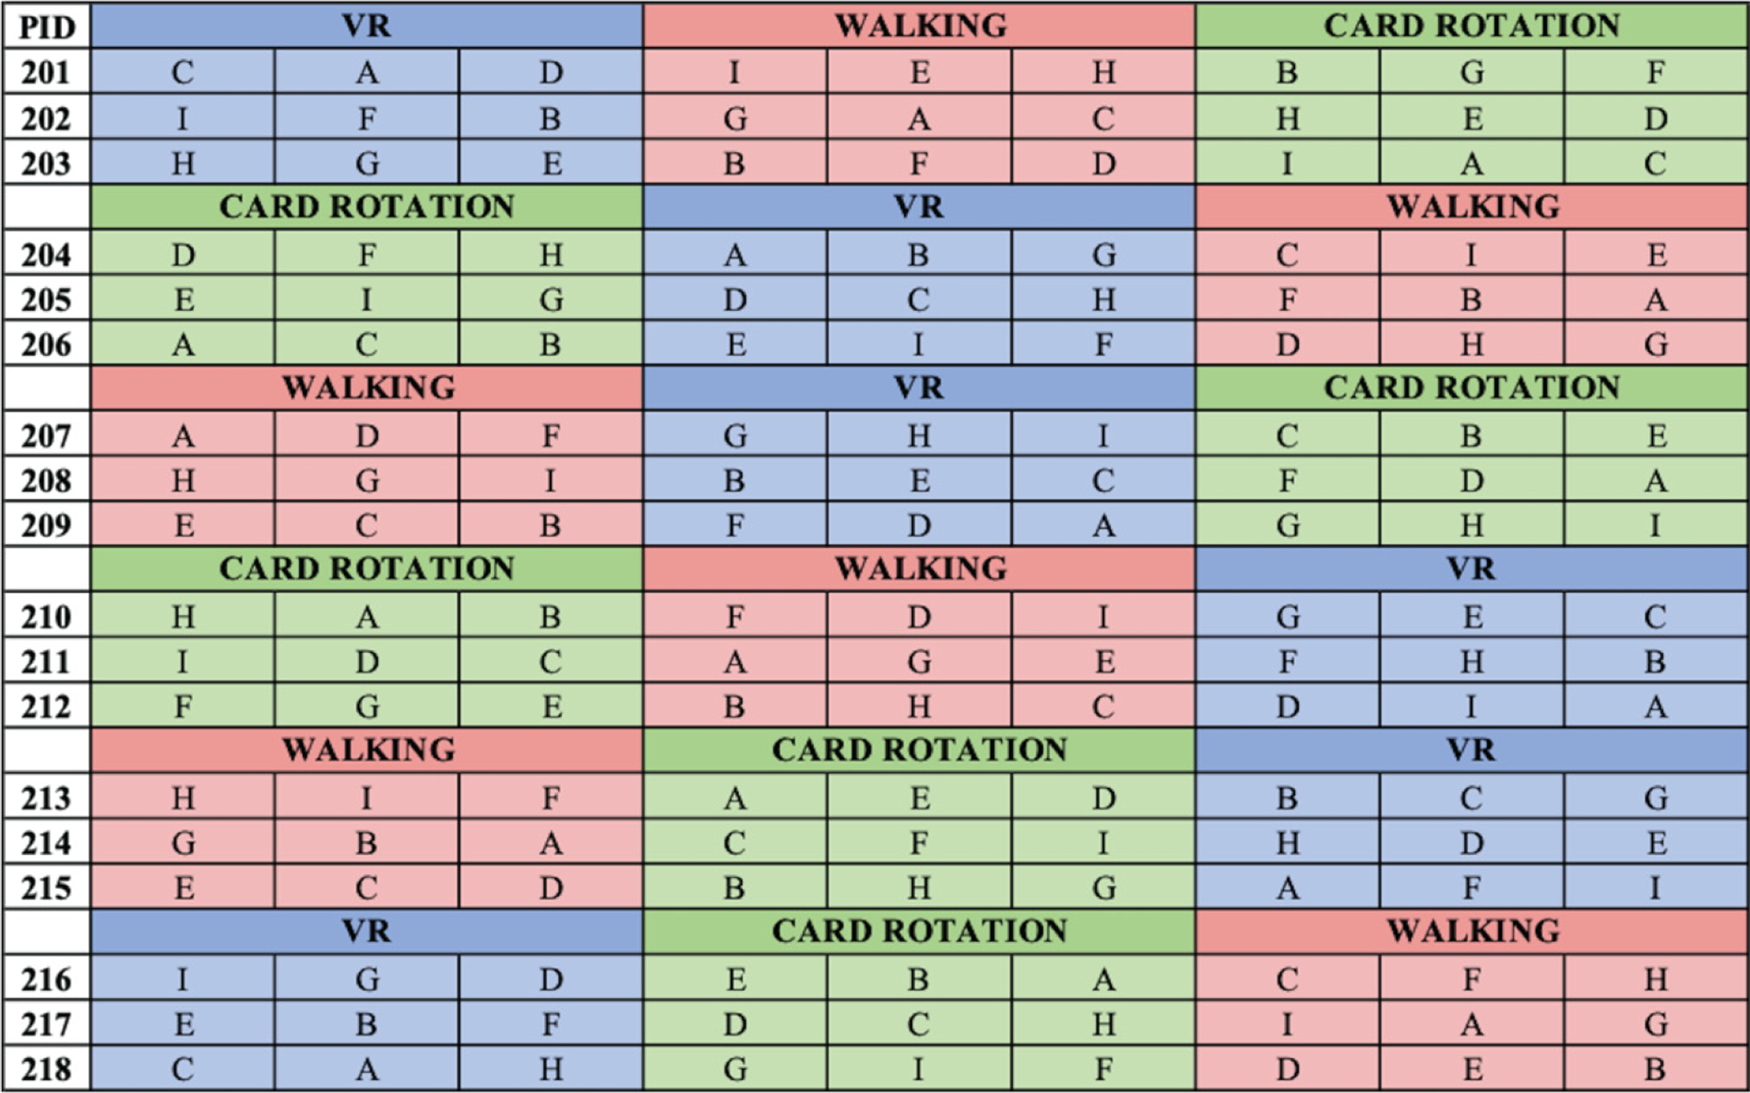
An effort was made to control for design problem and ordering effects and to ensure each task was completed equally per condition. The three different interventions allowed for six possible intervention orders. Therefore, the intervention order was modified after every three participants. The order of design tasks was randomly assigned to participants, ensuring that each task was present six times per condition. A final randomization process hoped to minimize design task order effects within each condition. For example, across 18 participants, the VR condition was given six times each as the first condition, second condition, and third condition shown to participants. Task A was completed six times for each intervention group. Additionally, within each condition, Task A was presented two times each as the first task, second task, and third task in that condition. The task and condition orders for each participant is shown in Figure 3.
The randomized table of participants’ design tasks (A–I) and intervention orders. Participant IDs are listed to the left, and conditions are represented by color and name (Card Rotation, Walking, and VR).

For analysis, design solutions were independently scored for novelty and feasibility, resulting in 18 design task scores for each participant. Averaged group scores were also calculated for each condition. The relationships between independent conditions, condition orders, performance, and assessment scores were evaluated statistically. The following sections provide more detail for the assessment of mood and design task performance.
Mood assessment
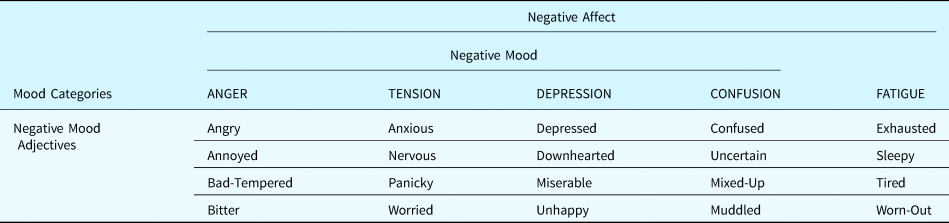
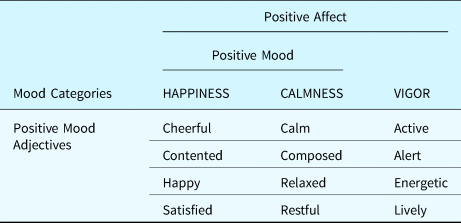
Self-reported mood data was collected in order to investigate correlations between mood and performance across conditions. Using the Brunel Mood Scale (BRUMS), participants rated the degree to which they had experienced 32 individual mood adjectives during “this week, including today”. Ratings included “0 – Not at all”, “1 – A little”, “2 – Moderately”, “3 – Quite a bit”, or “4 – Extremely”. Each mood was associated with one of eight self-reported mood categories, written in all capital letters, classified as either positive or negative. The mood categories and their underlying adjectives are shown in Tables 1 and 2. Scores for each mood category were calculated as the sum of the ratings for the underlying adjectives. For example, TENSION scores were calculated based on participants’ self-reported scores for how anxious, nervous, worried, and panicky they felt.
An overview of all negative adjectives and the corresponding negative mood categories

An overview of all positive adjectives and the corresponding positive mood categories

Design performance metrics
Participants completed nine design tasks by sketching one solution for each design task. In cases where participants sketched multiple solutions, only the first solution was scored. The first solution was identified based on the flow of sketches across the page from left to right. Design solutions were scored for novelty and feasibility using standard metrics outlined by Shah et al. (Reference Shah, Smith and Vargas-Hernandez2003) and Linsey (Reference Linsey2007). Raters were trained to use Shah et al.'s metrics of scoring. Two independent raters evaluated the data for both novelty and feasibility. All disagreements between the two coders were resolved by discussion, and their results were used for analysis. Their Pearson's correlation for interrater reliability was 0.999 for novelty. A percent agreement of 82.1% was achieved for feasibility.
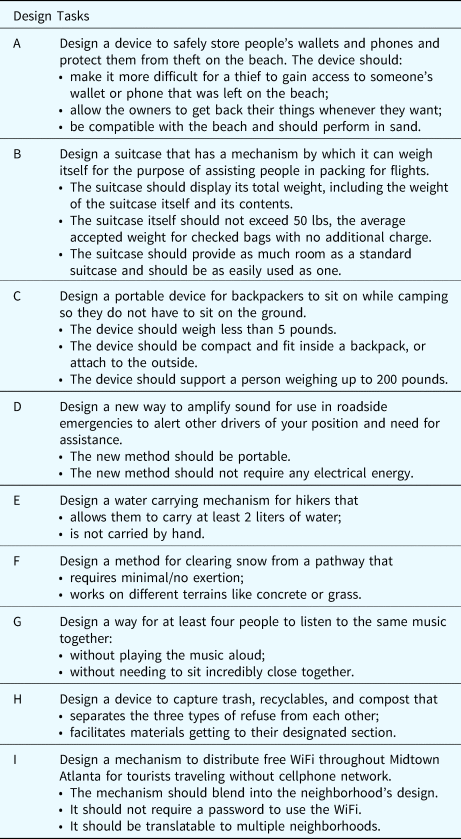
Prior to data collection, a series of requirements were outlined for each design prompt. Requirements were defined by the researchers as features that a solution needed to include to satisfy the prompt. The requirements were evident in the design prompt, as shown in Table 3. To calculate novelty, participants’ solutions were reviewed to determine how the solution met each of the requirements. For each requirement, features were grouped by similarity and received a score between 0 and 10, with features that were less common (more novel) receiving higher scores. Next, participants’ novelty scores were calculated as the weighted average of the scores for the underlying requirements for that design task. Therefore, each participant received nine design task novelty scores. Novelty scores for design tasks completed in the same condition were averaged to produce three average condition scores per participant. Group novelty scores were created with participants who were assigned to see conditions in the same order, as shown in Figure 3, by averaging their novelty scores for the corresponding conditions. While comparison to peers may not present novelty in its truest form across the entire design space, it is beneficial for the study by considering how much more unique the solutions of one condition are over another condition.
Example design tasks A and B

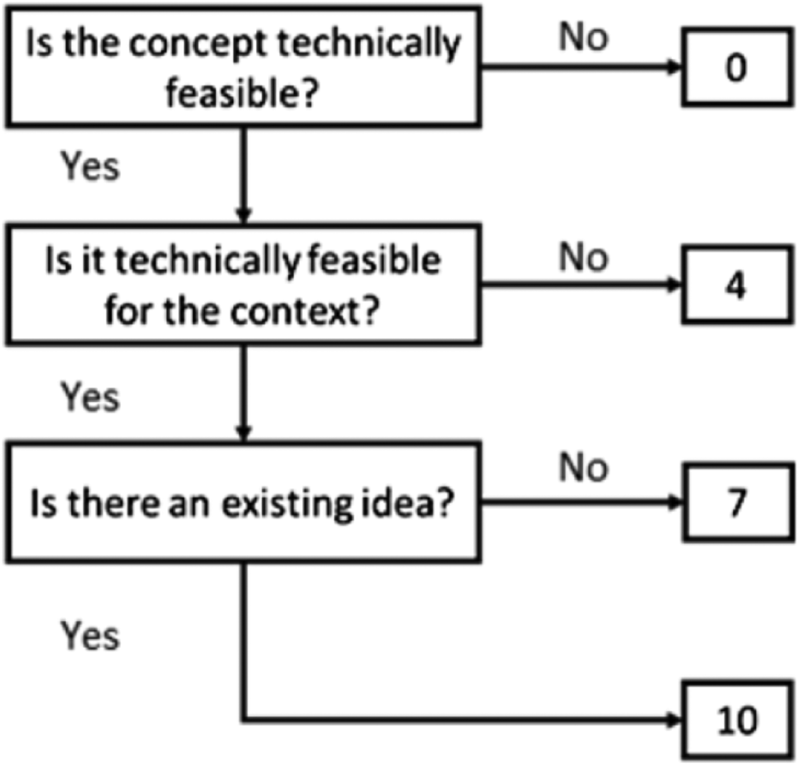
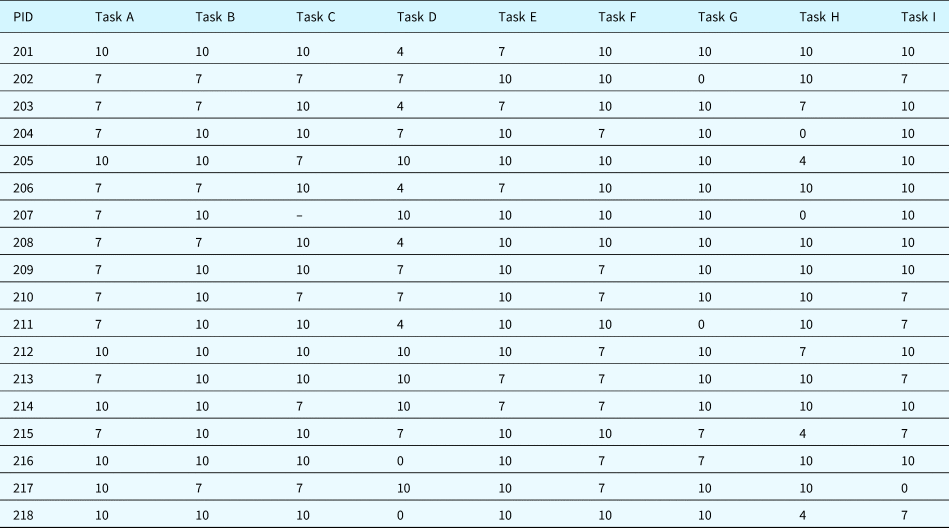
Feasibility for each design task was scored on a four-level scale, ranging from 0 to 10, as depicted in Figure 4. Solutions that were not technically feasible received a score of 0. Solutions that were technically difficult for the context received a score of 4. Solutions that did not match an existing idea received a score of 7 and those that did match an existing idea received a score of 10. Existing ideas were defined as ideas that mapped to solutions or products already in existence. This was determined using keywords across search engines and within patent databases.
Feasibility metric.

The feasibility scale was initially a three-level scale created by Linsey (Reference Linsey2007), which has been modified to include an “existing ideas” level, as shown in other design studies (Srivathsavai et al., Reference Srivathsavai, Genco, Hölttä-Otto and Seepersad2010; Raviselvam et al., Reference Raviselvam, Hölttä-Otto and Wood2016). One of the biggest issues in creativity metrics is developing scales where scores have repeatability across multiple researchers. Linsey (Reference Linsey2007) refers to coarse scales performing better than unanchored scales, and Srivathsavai et al. (Reference Srivathsavai, Genco, Hölttä-Otto and Seepersad2010) show that both the three and four point scales perform better than more refined scales with higher levels. The “existing ideas” assessment hopes to add an objective element on top of the more subjective decision of whether a concept is “technically difficult”.
Each participant received nine design task feasibility scores. Feasibility scores for design tasks completed in the same condition were averaged to produce three average condition scores per participant. Group feasibility scores were created with participants who were assigned to see conditions in the same order, as shown in Figure 3, by averaging their feasibility scores for the corresponding conditions.
Results
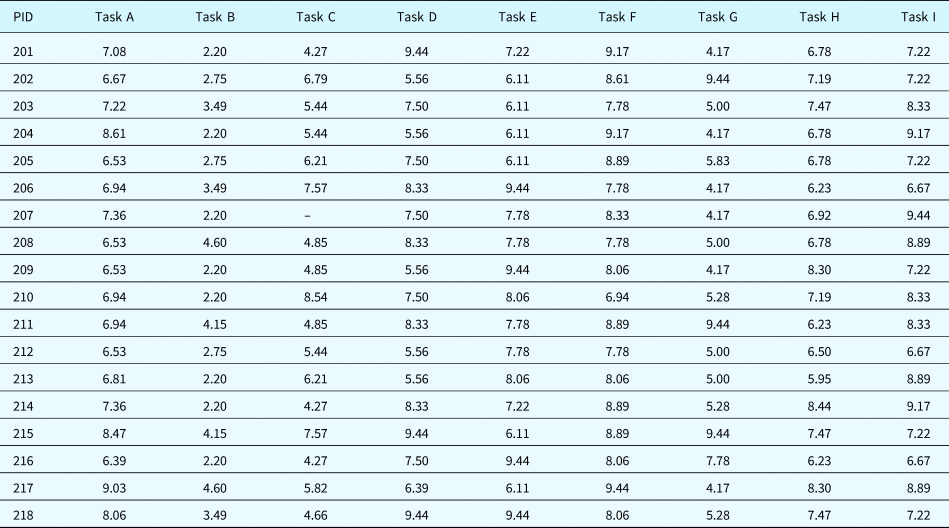
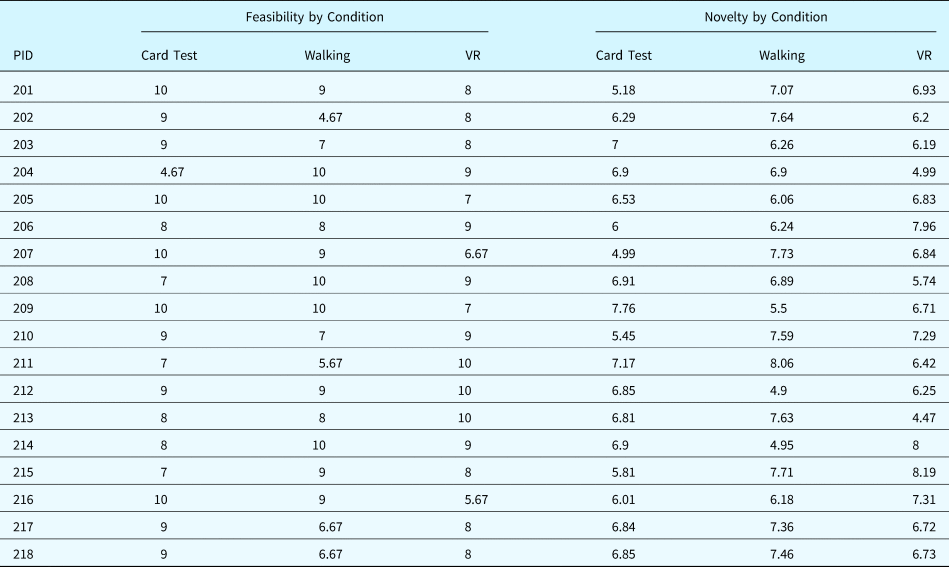
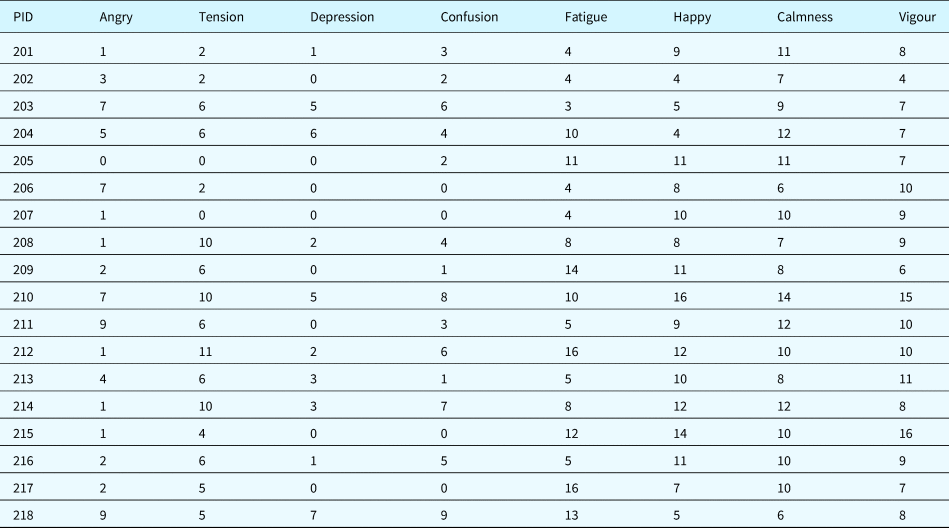
Eighteen participants each completed nine individual design tasks, resulting in 162 total solutions. One of the 18 participants received only eight scores; one design task was eliminated from scoring due to the participant misreading the prompt. The solution could not be scored in a comparable manner to the other participants, so the design data from this task was excluded for this participant. Tables A1 and A2 show the novelty and feasibility scores by task for each participant. Table A3 shows each participant's average score across the three conditions, and Table A4 provides mood scores across the eight main mood categories for all participants.
Differences in interventions and performance
Three unique interventions were tested to determine their effect on the novelty and feasibility of design solutions: the Card Rotation Test, Physical Walking, and movement in Virtual Reality. Each participant completed all design tasks and experienced all three interventions, allowing for a within-subjects quantitative analysis of performance. In addition, participants were assigned to one of six groups that determined the order in which they experienced the interventions, allowing for a between-subject analysis of performance based on group scores.
Novelty did not vary across the three conditions with any statistical significance. 44% of participants received their highest novelty scores for designs produced after Walking, while 28% scored highest after exposure to Virtual Reality. The remaining 28% produced the most novel designs after completing the Card Rotation Test. Feasibility also did not vary across conditions with any statistical significance.
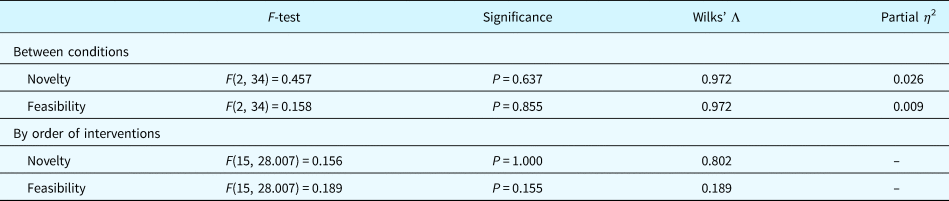
A repeated measures MANOVA was conducted to evaluate the effect of the conditions on participants’ novelty and feasibility scores (within-subjects). This statistical methodology was chosen due to there being multiple dependent variables, and because participants took part in each of the three conditions. The MANOVA was also selected to reduce family-wise error and increase observed power. Homogeneity specifications were ignored because there were no between-subjects factors for this analysis. Mauchly's Test of Sphericity indicated that the assumption of sphericity was not violated, χ 2(2) = 0.995, P = 0.957, and therefore, no corrections were used. As shown in Table 4, analysis determined that there was no statistically significant difference in novelty or feasibility between conditions. There was also no statistically significant difference in novelty or feasibility scores based on the order of intervention types.
Repeated measures MANOVA results for novelty and feasibility across interventions

Differences in mood across peak performance groups
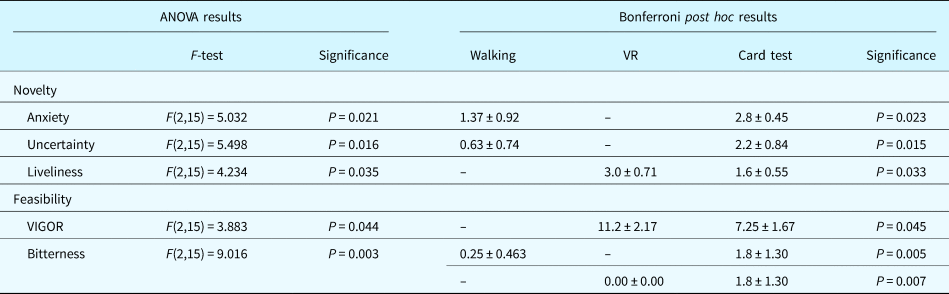
Participants received novelty and feasibility scores for each intervention condition. Peak performance was defined as the intervention condition in which the participant scored the highest, and participants were grouped accordingly. In cases where participants’ scores were the same for multiple conditions, their data was included in the analysis for each group. For example, if a participant's feasibility score was 10.00 in the Virtual Reality condition, 10.00 in the Card Rotation condition, and 7.00 in the Walking condition, both Virtual Reality and Card Rotation were considered peak performance groups, and their scores were included in group calculations for both conditions. The relationship between self-reported mood and the condition in which the participants received the highest novelty scores was examined using a one-way ANOVA. This was chosen as a between-groups analysis because participants were only represented in the condition of their peak performance. Significant results only are presented in Table 5. Homogeneity of variances was checked using Levene's test for each of the following calculations, and no significant differences were found; therefore, no adjustments were made. Using Shapiro–Wilk Test of Normality, three statistically significant differences in groups were identified. After the one-way ANOVA confirmed significant differences in the data, a Bonferroni post hoc test was used to find exactly where the differences lie between groups.
Significant impact of mood on peak performance groups

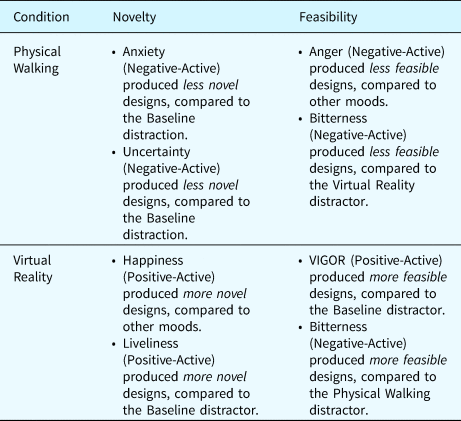
The ANOVA results and Bonferroni test reveal statistically significant differences in self-reported anxiety, uncertainty, and liveliness scores between groups. Self-reported anxiety scores were significantly lower for participants who produced more novel designs after Walking, rather than after completing the Card Rotation Test. Self-reported uncertainty scores were also significantly lower for participants who produced more novel designs after Walking than after completing the Card Rotation Test. On the other hand, self-reported liveliness scores were significantly higher for participants who produced more novel designs after exposure to Virtual Reality than after completing the Card Rotation Test.
The relationship between mood and the condition in which the participants received the highest feasibility scores was also examined. Three statistically significant differences in groups relative to VIGOR and Bitterness. As shown in Table 2, the VIGOR mood category score is the sum of a participant's scores for being active, alert, energetic, and lively. Self-reported VIGOR scores were significantly higher for participants who produced more feasible designs after exposure to Virtual Reality than after completing the Card Rotation Test. Bitterness scores were significantly lower for participants who produced more feasible designs after completing the Card Rotation Test or Walking, compared with exposure to Virtual Reality.
Self-reported mood correlations
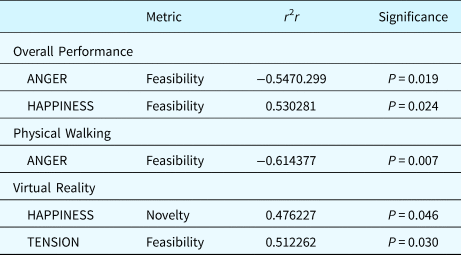
Bivariate correlation analysis was used to find correlations between self-reported mood and performance scores. This analysis can provide the strength and direction of a linear relationship between the two continuous variables. The relationships between self-reported mood and performance scores highlighted statistically significant (P < 0.05) interactions across two of the three conditions, as well as correlations with overall performance, as shown in Table 6. Novelty and feasibility scores for solutions created after participants completed the Card Rotation Test did not correlate with any self-reported mood scores. Overall performance scores were calculated as the average of all novelty or feasibility scores for an individual participant. Analysis revealed that overall novelty scores were negatively correlated with overall feasibility scores, indicating that participants’ solutions that were more novel were less feasible, and solutions that were less novel were more feasible. Participants with higher self-reported ANGER scores also produced less feasible designs, while participants who with higher self-reported HAPPINESS scores produced more feasible designs.
Bivariate correlation results for mood and performance scores (n = 18)

At the condition level, results show that after exposure to Walking, participants’ novelty scores did not correlate with any self-reported mood scores. However, self-reported ANGER scores were negatively correlated with the feasibility of solutions after Walking. After exposure to Virtual Reality, participants’ novelty scores were positively correlated with self-reported HAPPINESS scores, and feasibility scores were positively correlated with self-reported TENSION scores.
Discussion
The objective of this research was to evaluate the effect of physical motion versus motion in a virtual environment on the creative output of industrial design students. Specifically, Walking around the Georgia Institute of Technology campus was compared with navigating the campus in Virtual Reality, with a baseline comparison condition using the Card Rotation Test. Walking has previously been linked to increased creativity (Oppezzo and Schwartz, Reference Oppezzo and Schwartz2014; Kuo and Yeh, Reference Kuo and Yeh2016). This project sought to investigate how movement in Virtual Reality would impact creativity compared with Walking. In addition, self-reported mood data were collected to further explore the relationship between mood and creativity.
Specific research questions included in the following:
1) How do the novelty and feasibility of design solutions vary after exposure to each intervention, Walking versus VR movement versus Card Rotation Test?
2) How do self-reported mood scores correlate with performance after exposure to each intervention, Walking versus VR movement versus Card Rotation Test?
Performance across conditions
This study explored how manipulating what occurred during an incubation period might affect creative performance for industrial design students. The Card Rotation Test (Ekstrom et al., Reference Ekstrom, French, Harman and Derman1976) was introduced as a baseline distractor activity, keeping the designers sedentary while preventing them from thinking about the design task. Walking was chosen as an intervention based on prior work supporting a link between walking and increased creative output (Oppezzo and Schwartz, Reference Oppezzo and Schwartz2014). Movement in Virtual Reality was introduced as an exploratory intervention based on its ability to produce an immersive experience in an environment where walking may be replicated. Results show no significant difference in overall performance when comparing the Walking, Virtual Reality, and Card Rotation Test conditions. This would imply that there is no added benefit to physical activity over virtual activity. However, 44% of participants produced their most novel results after physically walking, which suggests the authors should not entirely discard the idea that walking may provide some advantages.
Analysis indicated that overall novelty scores were negatively correlated with overall feasibility scores. It makes sense that a solution falling lower on the feasibility scale may be more unique relative to other solutions, and vice versa. As there were no significant differences in novelty or feasibility across the three conditions, it seems that the conditions did not impact that trend in any way. It may also be due to the nature of the study design. It is possible that one may require many solution ideas before developing a design that is both novel and feasible. However, as this study provides insight into intuition, it did not allow time for a large quantity of ideas.
Several aspects of the study may have played a part in the lack of significance, such as the environments presented in Walking and Virtual Reality, the age of participants, or any activities that participants may have performed before entering the study. Relative to prior work in studying creativity, population specificity may be one important factor to highlight. Previous studies of walking and creativity focused on general populations including undergraduate students, undergraduate psychology students, and general adult populations (Oppezzo and Schwartz, Reference Oppezzo and Schwartz2014; Kuo and Yeh, Reference Kuo and Yeh2016). By comparison, this study focused specifically on industrial design students. Designers have been shown to have modifications to their cognitive processes and skills through their education, compared to the general population (Guaghran, Reference Guaghran2002; Williams et al., Reference Williams, Gero, Lee and Paretti2011). Designers are taught design thinking methods specific to problem-solving and conceptual design. Therefore, it may be best to compare results specifically for designers in the context of physical activity and creativity.
An additional factor in the lack of significant results may be the variation in assessment types, which highlights a difference in the measurement of creativity. Previous studies of walking and creativity assessed creativity using standardized assessments of convergent and divergent thinking (Oppezzo and Schwartz, Reference Oppezzo and Schwartz2014; Kuo and Yeh, Reference Kuo and Yeh2016). By comparison, this study assessed creativity using an applied creative task and standardized performance metrics for design ideation. Word association metrics of divergent and convergent thinking are a different type of task from complex, multi-faceted design problems, drawing on different skill sets, and types of information processing.
Mood and performance
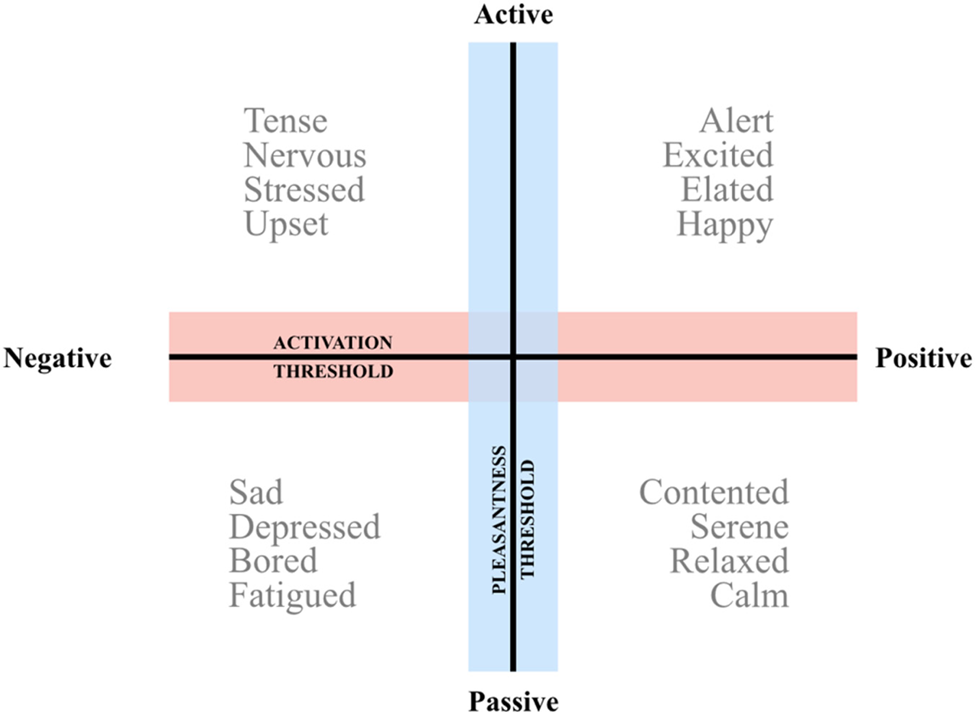
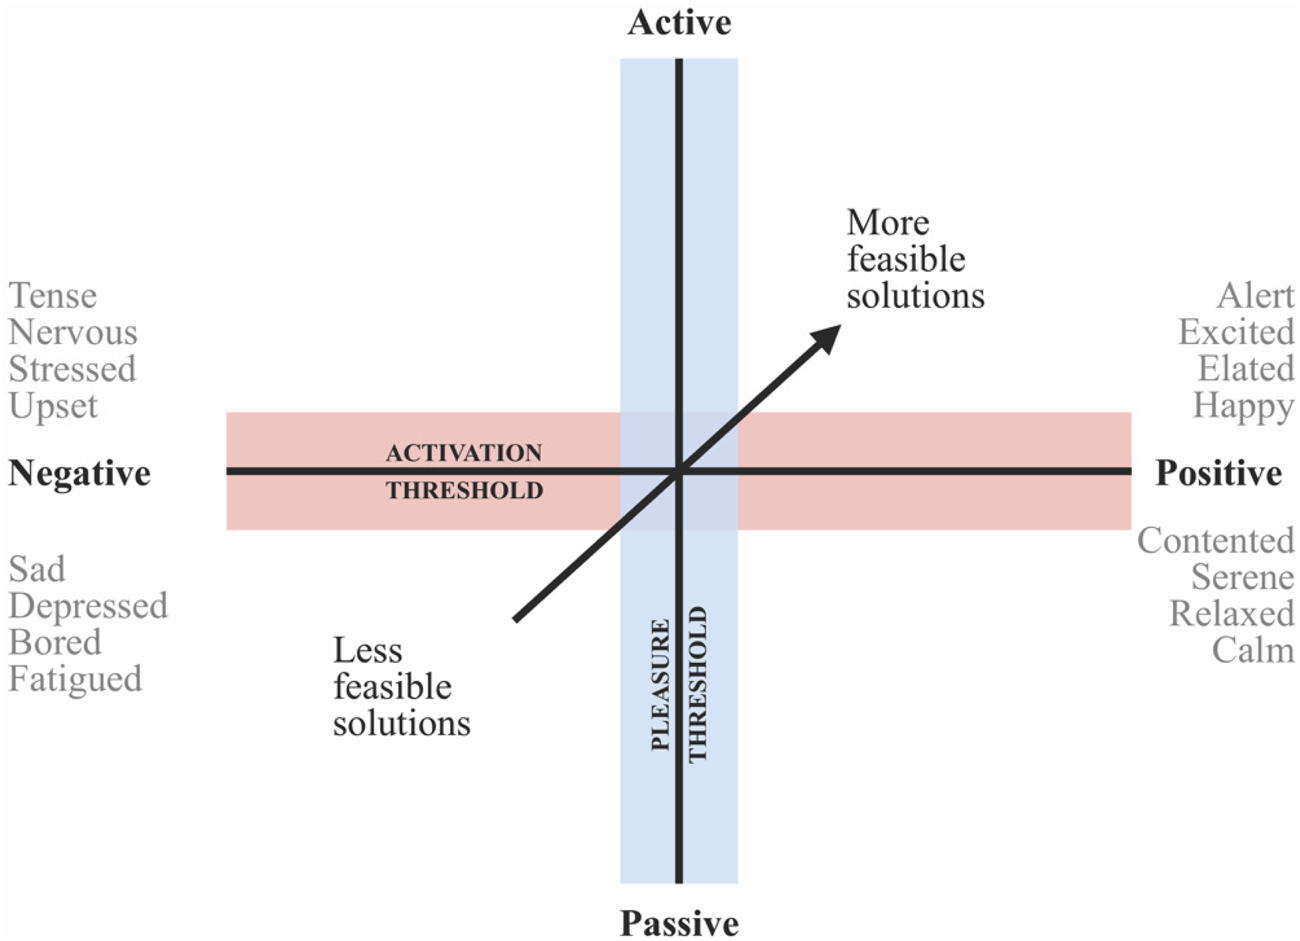
Analysis of prior correlations using Russell's Circumplex Model of Affect (Russell, Reference Russell1980) provides an interesting baseline against which to consider the results of mood and performance in this study. While moods are often considered independent states, Russell asserts that they are systematically related to each other, as a combination of both pleasure and activation (Russell, Reference Russell1980). This model was later used to develop tools such as the Positive and Negative Affect Schedule (PANAS), a self-reported mood assessment similar to BRUMS (Watson et al., Reference Watson, Clark and Tellegen1988). Russell's Circumplex Model of Affect maps affective states along two axes: pleasantness and activation (Russell, Reference Russell1980). For the purposes of this discussion, we have adapted the model slightly to refer to “pleasantness” as a spectrum from positive to negative, and “activation” as a spectrum from active to passive, shown in Figure 5. These axes have been presented similarly to other studies (Desmet et al., Reference Desmet, Vastenburg, Van Bel and Romero2012). Nervousness and excitement, for example, are both active states. However, excitement is a positive mood state, while nervousness is characterized as negative. The transitions from positive to negative or active to passive can be considered the threshold where that characteristic shifts the mood itself.
An overview of Russell's Circumplex Model of Affect (Russell, Reference Russell1980), highlighting the activation threshold where moods shift from active to passive, and the pleasantness threshold where moods shift from negative to positive.

Based on the typologies laid out by Desmet et al. (Reference Desmet, Vastenburg, Van Bel and Romero2012), each of the eight mood states from BRUMS can be placed into one of the four quadrants of the Model of Affect. From a previous study performed by the authors (paper under review), self-reported mood scores collected using BRUMS correlated significantly with feasibility scores. When developing design solutions after an incubation period, self-reported DEPRESSION was negatively correlated with solution feasibility, while self-reported VIGOR positively correlated with feasibility. Using this model, prior analyses showed that feasibility increased when both the activation and pleasantness thresholds are crossed, shifting from DEPRESSION (a negative, passive mood) to VIGOR (a positive, active mood) (Fig. 6).
The shift in solution feasibility corresponded with a shift in moods across the pleasantness (negative to positive) and activation (passive to active) thresholds. (Results from prior work – paper under review.)

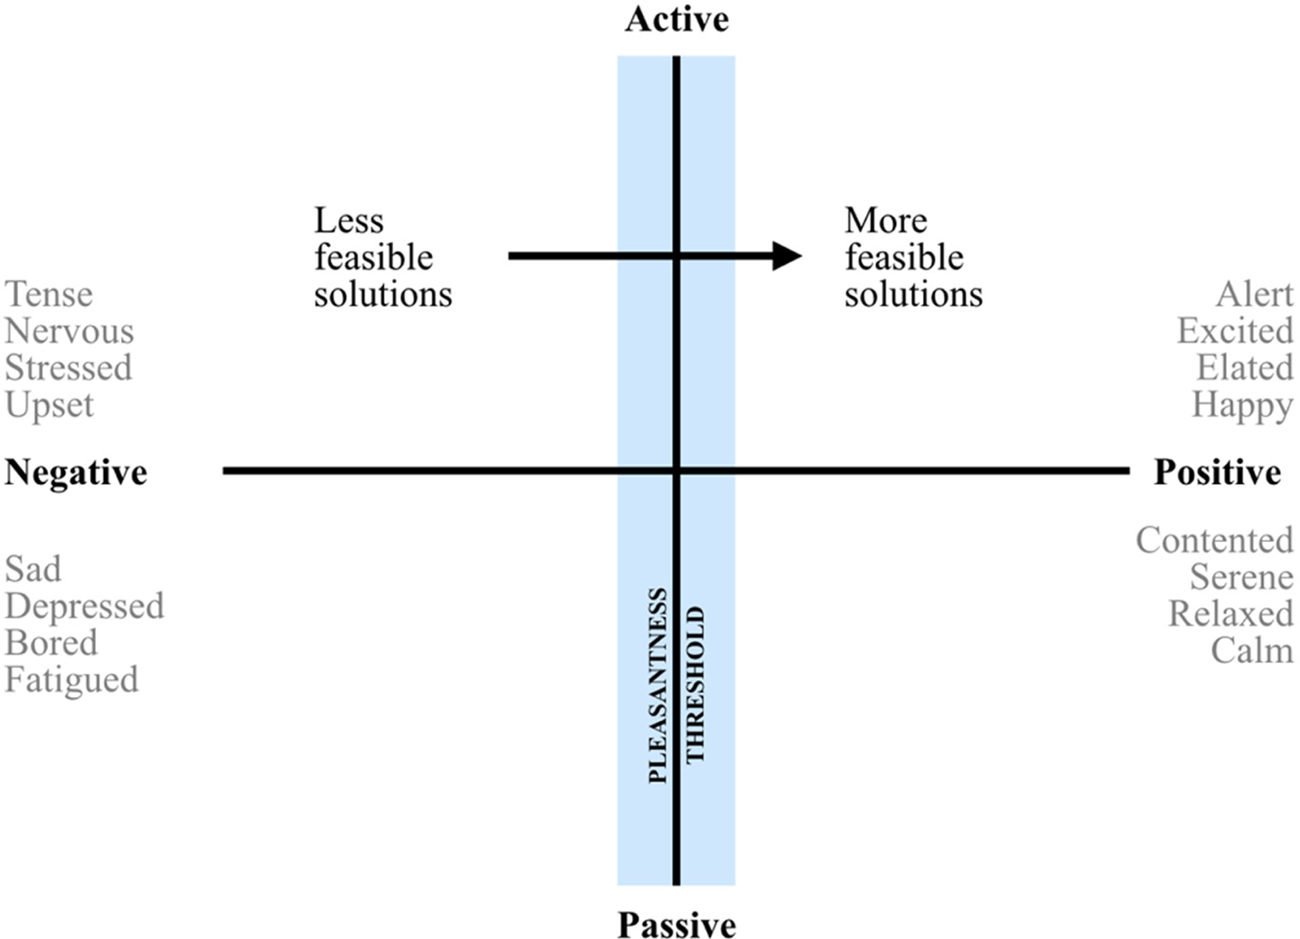
In the present study, feasibility increased with HAPPINESS (a positive, active mood) and decreased with ANGER (a negative, active mood). As shown in Figure 7, only one threshold was crossed in this scenario, the pleasantness threshold. Across both studies, it has been shown that the feasibility of the solution increased when designers displayed particular positive moods and decreased for particular negative moods. These results are specifically for designers who ideate after a period of incubation, with no impact shown based on the type of activity performed.
The shift in solution feasibility corresponded with a shift in moods across the pleasantness (negative to positive) thresholds. (Results from the current paper.)

Passive mood states
In general, zero passive mood states were significant in any form in this study. As such, it was not able to replicate the significance of the negative, passive state of DEPRESSION and feasibility as found in the previous study performed by the authors (paper under review). It is not immediately clear why passive states received no correlations, but this is something worth investigating in future work. For speculation, boredom may have played a role in the lack of significant with moods such as depression. The link between depression and creativity has been demonstrated by a number of different studies (Cohen and Ferrari, Reference Cohen and Ferrari2010; Verhaeghen et al., Reference Verhaeghen, Joormann and Aikman2014). Boredom has been described as being unable to engage in an activity, despite one's desire to do so (Eastwood et al., Reference Eastwood, Frischen, Fenske and Smilek2012). Though distinct from depression (Goldberg et al., Reference Goldberg, Eastwood, Laguardia and Danckert2011), boredom, and depression are highly correlated (Farmer and Sundberg, Reference Farmer and Sundberg1986; Vodanovich, Reference Vodanovich2003) and often considered a secondary symptom of depression (Goldberg et al., Reference Goldberg, Eastwood, Laguardia and Danckert2011).
Active mood states
Significant results show that walking tends to perform the worst under negative-active mood states. Participants with higher ANGER scores produced significantly lower feasibility scores after walking. For novelty, at the affect adjective level, those who reported higher anxiety and uncertainty performed better in the card tasks than the walking tasks. For feasibility, participants with higher bitterness performed better with VR rather than Walking. Therefore, it seems as if walking with a negative-active mood is not likely to increase the novelty and feasibility of ideas. The results regarding ANGER may possibly be explained by prior research. Baas et al. (Reference Baas, De Dreu and Nijstad2011) previously showed that while anger may be associated with an initial increase in creative output, the relationship is also characterized by a steep decline in creativity due to resource depletion. In this case, the added physical activity and cognitive load of walking prior to designing solutions may have accelerated the depletion of resources, leading to lower feasibility scores.
Because much of the literature with VR has an association with anxiety, it is worth looking into the affect adjective results for anxiety. For novelty, there were no correlations between anxiety and performance with Virtual Reality, but participants who performed best in the Card Rotation Test condition had significantly higher uncertainty and anxiety scores than the Walking condition. Uncertainty and anxiety can both make it difficult to engage in effective decision-making and have been correlated with decreased creativity (Baas et al., Reference Baas, De Dreu and Nijstad2008). However, the Card Rotation Test and Virtual Reality experience may have effectively mitigated the impact of participants’ anxiety and TENSION by providing a high cognitive load distractor task. The Card Rotation Test required participants to focus intently on matching shapes, while the Virtual Reality experience required navigation of the environment. Anxiety has previously been shown to have a higher impact on low-load cognitive tasks, compared to tasks that require high cognitive functioning (Vytal et al., Reference Vytal, Cornwell, Arkin and Grillon2012). This is because the task requires more executive function, shifting cognitive resources and helping to alleviate anxiety (Vytal et al., Reference Vytal, Cornwell, Arkin and Grillon2012).
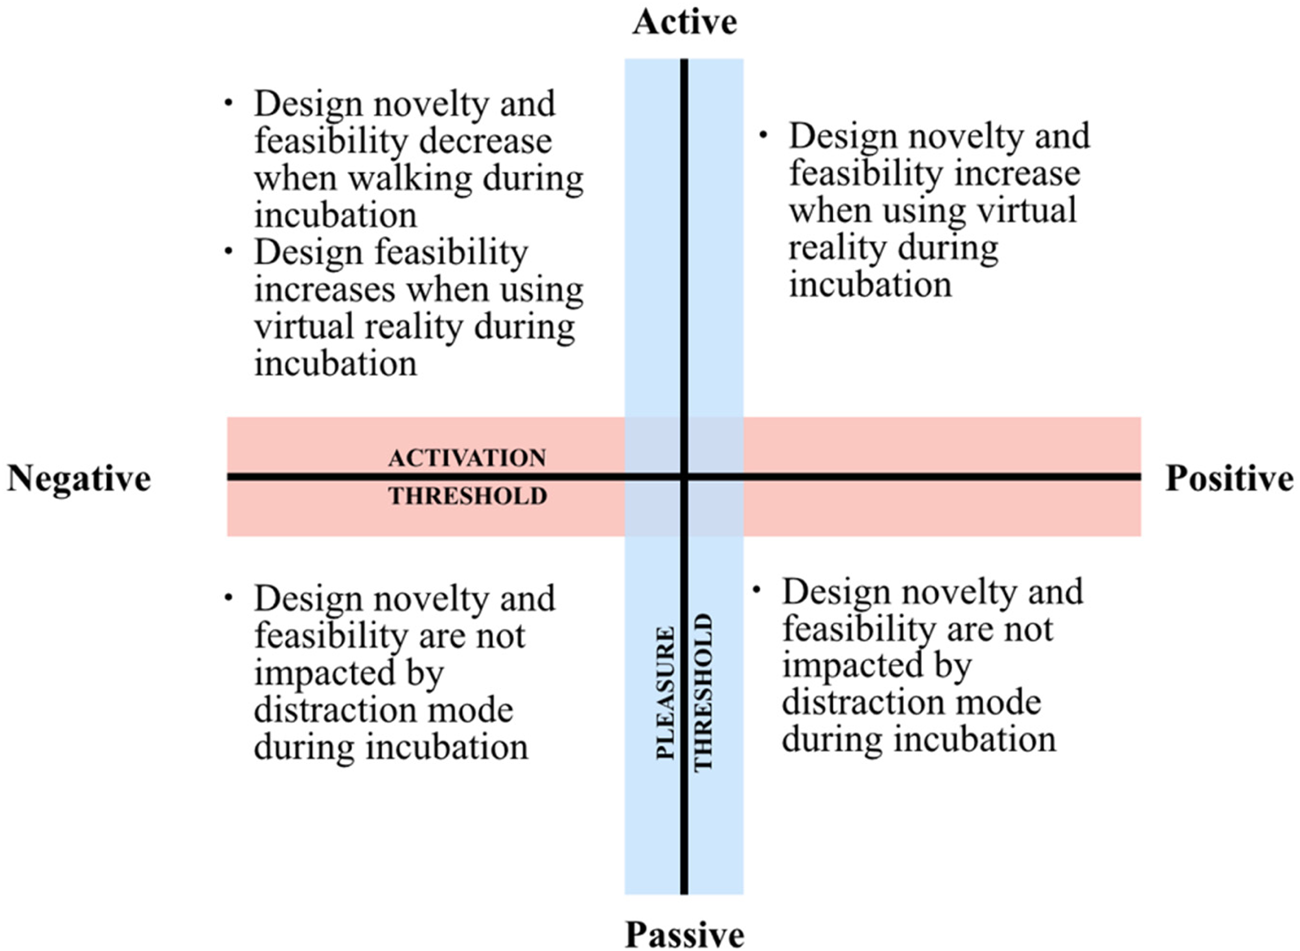
Contrary to Walking, the VR task appears to perform best in the negative, active mood states. While overall performance saw a decrease in feasibility with ANGER, VR saw an increase in feasibility with TENSION and higher peak performance with bitterness relative to other activities. Significant results also point toward recommending the use of VR when the mood states are positive and active. VR users produced their most novel results when happier. Compared to peak Card Rotation Test performers, peak VR users had higher novelty with liveliness and more feasibility when VIGORous. VR is the one mode to have significance of any form within the positive, active mood states. A summary of the impact of mood states are given in Table 7, and hypotheses for moving forward with future studies are shown in Figure 8. The practical implications are that:
• The type of distraction chosen for design problem incubation may have no difference in impact on designers in passive moods.
• Designers in active moods may benefit from Virtual Reality over Walking as a distraction to allow design problems to incubate.
• Designers in negative-active moods may avoid walking as a distraction to let design problems incubate.
Hypothesized performance trends using significant mood correlations in each quadrant.

How active moods significantly impacted condition novelty and feasibility

Conclusion
This study examined how design novelty and feasibility were impacted by various activities within a period of incubation for designers. It assessed whether differences in output were present for designers who engage in Physical Walking versus Virtual Reality movement. Lastly, it assessed if mood had any impact on these results. The conclusions of this study included in the following:
• There were no significant differences found in overall performance across conditions, although more participants produced their highest novelty scores in the Walking condition.
• When considering mood and overall performance, participants with more ANGER produced less feasible results, and those with more HAPPINESS produced the most feasible results.
• When considering mood across each incubation condition, participants with more HAPPINESS produced more novel designs in the Virtual Reality condition and less feasible designs in the Walking condition. Participants with more TENSION also had more feasible designs in the Virtual Reality condition.
• When generalizing mood results, this study shows that passive moods produced no significant difference in novelty or feasibility. Active moods were beneficial to virtual reality users, and negative-active moods tend to result in poor performance for those who were Physically Walking.
These results show that, without considering mood, the participants performed problem solving at an equal level, regardless of exposure to physical activity or virtual reality. When considering mood, virtual reality was seen as a significantly better incubator in terms of novelty and feasibility, for multiple mood states. This serves as motivation for continuing to study how VR can provide an impact on a designer's creative output. Future work should continue to explore performance between the four main groups of moods (positive-passive, positive-active, negative-passive, and negative-active) and the hypothesized trends in novelty and feasibility. If designers begin to have a more conscious awareness of their mood state, they could modify and optimize their methods and creative process based on evidence found in this study and others.
Limitations and future research
Several limitations to the study provide a basis for reflection on how to move into future research. For example, while the Card Rotation Test did not pertain to the design prompts, it is possible that the spatial reasoning required for the test had some indirect influence on designers. Distractors that involve other cognitive skills may be inserted into future studies to understand these effects. This may help explain why neither the physical nor simulated walking experiences were able to provide a significant advantage over the baseline, non-physical distraction. Additionally, the mood assessment does not account for any intense, short-term emotions that may arise during design tasks. Future work may seek to obtain the current emotional state of participants after each design task, to see if this may have had a significant impact on the quality of design outcomes as well. This could include using technology such as biometrics or EEG to track emotions in real time.
This study should also consider alternative or reformed metrics that may derive more accurate quantifications of design feasibility, and therefore provide more realistic measures of creativity in design outcomes. For example, future work may include feasibility metrics that dissect designs at the feature level, rather than the concept level (Srivathsavai et al., Reference Srivathsavai, Genco, Hölttä-Otto and Seepersad2010). While novelty was analyzed at the feature level, improvements could be made through categories that improve judgements when grouping solutions together. Feature-based feasibility metrics can be beneficial for applications such as additive manufacturing, where technology has allowed designers to produce more novel structures than traditional manufacturing. While novel, the architectures must also be feasible to produce as a 3D printed part without failure, making these two assessments of creativity very relevant to the additive manufacturing perspective.
Virtual reality is becoming increasingly accessible and affordable. In this study, it allowed designers to disengage from their design task while moving through an environment. Future testing with more realistic environments, including photorealistic surroundings that are dynamic with more natural walking motions, would be interesting to understand how the quality of the virtual environment impacted the outcomes of this study. More realistic environments may also allow designers to better experience environments for which they are designing, helping to increase contextual knowledge and deepen empathy. For example, designers of military applications could explore an aircraft carrier or enter classified locations. Virtual reality could also help bring designers into otherwise inaccessible problem spaces where their expertise and skills would be valuable.
Just as general studies of creativity may not be generalizable to designers, it is important to remember that not all designers are the same. Graphic design, industrial design, architecture, and interaction design – just to name a few – are all unique disciplines that apply creativity in unique ways and produce drastically different creative outputs. For this study, the results should be considered in the context of industrial design students but may not be directly generalizable to all designers. Further research into creativity of designers across the disciplines and levels of expertise would be value in understanding how designers are similar, what can be generalized, and how creativity can or should be understood.
From the mood perspective, there should be a continued effort to map moods and the transition of design novelty and feasibility. Russell's Model of Affect allowed for visualization of the differences in moods that influenced solutions. Because each quadrant contains multiple moods, future work should test hypotheses for whether certain quadrants as a whole influence design. For example, whether VR is truly the best method for all designers in a positive, active mood state. This may involve using other mood scales that map to Russell's Affect model (Desmet et al., Reference Desmet, Vastenburg, Van Bel and Romero2012). There may also be an opportunity to use biometrics, such as heart rate, body temperature, EEG, or fMRI, to deduce mood from empirical data as opposed to self-reported mood data.
Acknowledgments
The authors thank all of the students for their voluntary participation in this study. This work is supported by the National Science Foundation under CMMI grant number 1645316. Any opinions, findings, and conclusions or recommendations expressed in this material are those of the authors and do not necessarily reflect the views of the National Science Foundation.
Kenton B. Fillingim is a graduate research assistant at Georgia Tech pursuing a PhD in Mechanical Engineering. He earned his MS in Mechanical Engineering in 2018 from Georgia Tech and BS in Mechanical Engineering in 2016 from the University of South Alabama. His research focuses on understanding the use of approximations and heuristics in systems engineering and design.
Hannah Shapiro is an undergraduate research assistant at the Georgia Institute of Technology pursuing a BS in Mechanical Engineering while minoring in Industrial Design. Her research interests focus on engineering design and early concept development. She is currently working to study how computational supports for design by analogy enhance the development of effective and innovative concept development.
Catherine J. Reichling is a Product Designer with ADAPT at Bain & Company, working with leading Fortune 500 companies to solve business challenges and shape digital products and services. She holds a Bachelor of Arts degree in Psychology and International Relations from Brown University and earned a Master's degree in Human Computer Interaction from the Georgia Institute of Technology.
Katherine Fu is an Assistant Professor of Mechanical Engineering at the Georgia Institute of Technology. She was a Postdoctoral Fellow at MIT and SUTD. She completed her PhD (2012) and MS (2009) in Mechanical Engineering at Carnegie Mellon. She earned her BS in Mechanical Engineering from Brown University in 2007. Her work focuses on studying engineering design through cognitive studies, and extending those findings to the development of methods and tools to facilitate more effective, inspired design and innovation.
Appendix
Novelty scores for participants per design task (0–10 scale)

Feasibility scores for participants per design task (0–10 scale)

Participant averages across conditions (0–10 scale)

Mood scores for each participant under each mood category (0–16 scale)