Numerous investigations show that stigma associated with HIV has a negative impact on diverse variables related to quality of life and psychological well-being (Franke et al., Reference Franke, Muñoz, Finnegan, Zeladita, Sebastian, Bayona and Shin2010; Logie & Gadalla, Reference Logie and Gadalla2009; Steward et al., Reference Steward, Chandy, Singh, Panicker, Osmand, Heylen and Ekstrand2011). The perception of stigma can also have negative implications for physical health (Obermeyer & Osborn, Reference Obermeyer and Osborn2007; Rao, Kekwaletswe, Hosek, Martínez, & Rodriguez, Reference Rao, Kekwaletswe, Hosek, Martinez and Rodriguez2007; Strachan, Bennett, Russo, & Roy-Byrne, Reference Strachan, Bennett, Russo and Roy-Byrne2007). Stigma and discrimination also influence public health negatively because they discourage people from being tested voluntarily for HIV and they deter people with HIV from disclosing their status or even from following a treatment for their infection (Clum, Chung, & Ellen, Reference Clum, Chung and Ellen2009; King et al., Reference King, Katuntu, Lifshay, Packel, Batamwita, Nakayiwa and Bunnell2008; UNAIDS, 2002).
The stigma associated with HIV is a complex construct that includes diverse categories and dimensions. One traditional classification divides it into two categories, enacted and internalized stigma (Parker & Aggleton, Reference Parker and Aggleton2003; Tsutsumi & Izutsu, Reference Tsutsumi, Izutsu, Preedy and Watson2010; UNAIDS, 2002). In the former, the source of stigma is external (Enacted stigma), and in the latter, it is internal (Internalized stigma). More recently, Bos, Pryor, Reeder, and Stutterheim (Reference Bos, Pryor, Reeder and Stutterheim2013) pointed out that public stigma (common knowledge that a certain social attribute is devaluated) affects the self in three ways: (a) through enacted stigma (perceived negative treatment of the stigmatized people); (b) through felt stigma (experience or anticipation of the stigmatization); and (c) through internalized stigma (reduction of self-worth of the stigmatized people). This differentiation is important because different types of stigma as such constitute sources of stigma that can differentially affect the stigmatized people.
Stigma and discrimination towards people with HIV are a reality that has been documented in diverse countries (FIPSE, 2005; Fuster, Molero, Gil de Montes, Vitoria, & Agirrezabal, 2013; Fuster-RuizdeApodaca et al., Reference Fuster-RuizdeApodaca, Molero, Gil de Montes, Agirrezabal, Toledo and Jaén2014; Li, Liang, Lin, Wu, & Wen, Reference Li, Liang, Lin, Wu and Wen2009; Mahajan et al., Reference Mahajan, Sayles, Patel, Remien, Sawires, Ortiz and Coates2008). A recent study of a representative sample of Spanish population showed that an important percentage of them still felt discomfort in the presence of people with HIV (from 25.8 to 49.8%, depending to the daily life scenario). Moreover, 29% of the population would avoid the contact with them. Furthermore, around 13% of the population advocates discriminatory policies, and about 15% blame people with HIV for having the disease (Fuster-RuizdeApodaca et al., Reference Fuster-RuizdeApodaca, Molero, Gil de Montes, Agirrezabal, Toledo and Jaén2014). Concerning internalized stigma, in recent years, research has revealed its magnitude and relevance in people with HIV and its important consequences for their psychological well-being and quality of life (Berger et al., Reference Berger, Ferrans and Lashley2001; Kalichman et al., Reference Kalichman, Simbayi, Cloete, Mthembu, Mkhonta and Ginindza2009; Visser, Kershaw, Makin, & Forsyth, Reference Visser, Kershaw, Makin and Forsyth2008). In a study conducted in Spain in which 221 people with HIV participated, it was found that the levels of enacted and internalized stigma were a little higher than the theoretical mean of the scale (Fuster-RuizdeApodaca, Molero, & Ubillos, Reference Fuster-RuizdeApodaca, Molero and Ubillos2015).
Various instruments have recently been designed to measure HIV-related stigma. One of the most frequently used and referenced is the Stigma Scale of Berger et al. (Reference Berger, Ferrans and Lashley2001). This scale has a reported four-factor structure (Personalized Stigma, Disclosure Concerns, Negative Self-Image, and Concern with Public Attitudes about People with HIV). Berger et al.’s Stigma Scale has the advantage of being well-validated in several settings and used fairly extensively in many studies and countries. (In the table presented as Annex 1, the studies that validated this scale can be consulted along with the main psychometric properties and validation data of these studies).
Of the four factors of Berger et al’s. (Reference Berger, Ferrans and Lashley2001) scale, two of them (Personalized Stigma and Concern with Public Attitudes) measure perceived stigma expressed by others (experiences with enacted stigma and felt stigma). For the other two factors (Disclosure Concerns and Negative Self-Image), the source of the stigma is the person with HIV, in other words, external and internal source, respectively. Thus, according to the distinction proposed in the literature, these four factors could be included within two more general dimensions, perceived external stigma (enacted and felt stigma), and internalized stigma. However, some authors (Kalichman et al., Reference Kalichman, Simbayi, Cloete, Mthembu, Mkhonta and Ginindza2009) noted that Berger et al.’s scale does not include items that are sufficiently representative of stigma internalization, and, therefore, they developed a specific measure of internalized stigma. To our knowledge, no studies have been conducted to analyze a possible second-order bidimensional structure accounting for the two general sources of the perception of stigma (external and internal) by people with HIV. We hypothesize that this second-order structure could be achieved by adapting items from an internal source to adequately measure internalized stigma. This proposal could be useful to measure both sources of stigma with the same scale and to analyze their effects on people with HIV. This analysis could contribute to designing interventions to reduce the problem of public stigma and to enable people with HIV to better cope with the problem.
This investigation had two goals: The primary goal was to adapt the Stigma Scale (Berger et al., Reference Berger, Ferrans and Lashley2001) with two aims: to be able to adequately measure internalized stigma, and for its use in Spain. The second goal was to analyze whether the factor structure of the adapted scale could be explained by two new higher order dimensions related to perceived external (enacted and felt stigma) and internalized stigma.
Method
This research was conducted during a two-year interval (2008 and 2009) and it is part of a more extensive investigation (Fuster, Reference Fuster2011), consisting of three studies involving a total sample of 687 people with HIV. The research described here involved the first two studies of the investigation (Fuster, Reference Fuster2011). The first study, a qualitative one, was used to adapt the items of the Stigma Scale reduced and refined by Bunn et al. (Reference Bunn, Solomon, Millar and Forehand2007), in order to obtain evidence of content validity. The second study, quantitative and cross-sectional, was conducted to obtain evidence of construct and criterion validity of the adapted scale.
Participants
A total sample of 597 people participated in the investigation. The inclusion criteria were: positive HIV diagnosis, being over 18 years of age, and not having any severe psychiatric or cognitive disorder.
In the first study, 40 people with HIV were interviewed. One half of them were men and one half were women. Their ages ranged from 28 to 59 years (M = 42.98, SD = 5.95). Most of them (57.5%) were working, 40% had finished high school, and 30% had attended elementary school. Regarding health characteristics, 60% of the interviewees had acquired the infection through unprotected sexual relations, 92.5% were undergoing antiretroviral treatment, and 82.5% had satisfactory immunological and virological status.
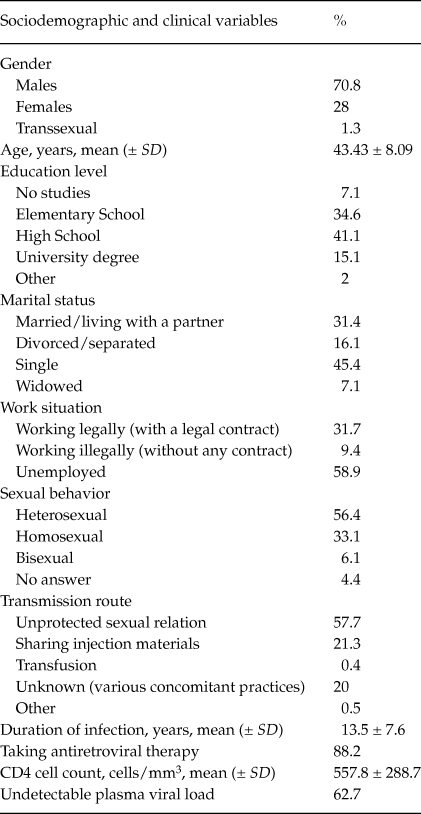
In the second study, there were 557 participants with HIV, aged 18–76. Most of them were men and more than half of them were heterosexual, single, and unemployed. On average, the participants had been infected by HIV for more than ten years, and more than half of them had acquired the infection through sexual contact. Medically, they were currently taking antiretroviral therapy and had a good immunological and virological status (Table 1).
Sociodemographic and clinical characteristics of the 557 participants of the quantitative study

Note: Data in percentages unless otherwise stated.
Instruments
The instrument employed in the qualitative study was a semistructured interview with open questions. The interview was comprised of six blocks of questions. For the purpose of this investigation—the adaptation of the Stigma Scale (Bunn et al., Reference Bunn, Solomon, Millar and Forehand2007) items—we used the discourse categories corresponding to the following questions: (a) main problems perceived of the collective of people with HIV (“Can you tell me what you think are the main problems or difficulties faced by people with HIV in our society?”), main perceived personal problems and concerns (“What are the main problems or difficulties that you must face in your daily life because of your condition of being a person with HIV?”), thoughts, and feelings related to their HIV status (“What thoughts and feelings does a person with HIV provoke in you?”); (b) perception of stigma and discrimination (“To what extent do you think that stigma and discrimination towards people with HIV are currently a problem?, Have you ever suffered some kind of rejection?, Can you tell me what happened?”), justification of discrimination (“What do you think are the reasons for stigma?”), personal responses to perceived stigma and to personally experienced stigma (“Could you tell me about your feelings, thoughts, and actions when you suffered rejection?”); (c) level of disclosure of serologic status: reasons and drawbacks (“To what extent do you usually disclose to others that you have HIV?, What are your reasons for disclosing it?, And for concealing it?”).
To measure stigma and the variables used to assess the criterion validity in the quantitative study, the following instruments were used:
Stigma Scale
We used the revised and refined adapted version of Bunn et al. (Reference Bunn, Solomon, Millar and Forehand2007). These authors re-analyzed the psychometric properties of Berger et al.’s (2001) scale. The scale is rated on a 4-point Likert-type response format (1 = strongly disagree, 4 = strongly agree). This scale showed a good internal consistency and evidences of construct and criterion validity (Appendix 1).
The scale was translated following the International Test Commission (2006) guidelines for the translation and adaptation of questionnaires. For this purpose, backward translation was performed: The scale was translated independently from English to Spanish by two expert translators, who were familiar with the basic psychometric aspects of item construction. The research team assessed the translations, reaching a consensus on the final items. After translation, the scale was adapted to the reality of people with HIV in Spain. For this purpose, a team of seven experts reviewed it to verify that the items coincided with the discourse categories found in the qualitative study. As a result of this analysis, some new items were included and others were eliminated or their wording was changed. The final, 30-item translated version was reviewed individually by 15 people with HIV in order to guarantee apparent validity. Then, all the items were re-translated into English by a bilingual person who was blind to the prior translation process. The items of this translation were compared with the original items to verify that there were no important differences.
Quality of Life Questionnaire ( Ruiz & Baca, Reference Ruiz and Baca1993 )
The scale has a 5-point self-report response format, with higher scores indicating better health status (1 = Not at all, 5 = Very much). This instrument has shown evidences of good internal consistency, temporal stability, sensitivity to significant clinical changes, and content and construct validity (internal structure, concurrent and discriminant validity) in Spanish adult population. Thus, the Cronbach alpha coefficient across studies ranged from α = .82 to α = .94. The questionnaire also showed test-retest reliability, with levels of stability ranging from r = .77 to r =.97. The correlations among quality of life and the criterion variables ranged from r = –.33 and r = –.73. Three of the four factors of this questionnaire were used for this investigation: Social Support, General Satisfaction, and Physical and Psychological Well-being. The Cronbach alpha coefficients for these factors in this study were α = 85, α = .86, and α = .82, respectively.
Perceived Self-Efficacy to Cope with Stigma Scale ( Fuster, Reference Fuster2011 )
Based on the self-efficacy literature, we used four items that are rated on a 4-point Likert-type response format, with higher scores indicating a higher perceived self-efficacy. The construct of this scale was also validated by means of confirmatory factor analysis, and the results showed a first-order one-dimensional structure (Fuster, Reference Fuster2011). The internal consistency of the scale was satisfactory (α = .78).
Degree of HIV status disclosure
Based on the research of Stratchan et al. (2007), we used one item rated on a 5-point Likert-type response format with higher scores indicating more HIV status disclosure (1 = Never disclose, 5 = Always disclose).
Health status.
We included questions related to years living with HIV, lymphocyte CD4 count, viral load copies, and suffering from AIDS-related opportunistic infection.
Procedure
During their consultations or when attending to diverse services, professionals from health centers explained the goals of the study to the participants, requesting their participation and obtaining their informed consent. In the case of the qualitative study, participants were requested to take part in an in-depth interview, and, if they agreed, the researcher-interviewer contacted them to schedule a meeting. At the beginning of the interview, permission was requested to audio-tape the interview, informing the participants of its subsequent transcription and of the confidentiality of the data. In the case of the quantitative study, the professionals handed out the anonymous and self-administered questionnaire to the participants to complete while in the waiting-rooms of the centers and subsequently return to the professionals.
Ethical approval and permission to conduct the research was granted by the non- governmental organizations and hospitals involved in the study. All the procedures of this study followed the 1964 Helsinki declaration (revised in 1996), as well as the guidelines for good clinical practice.
Data Analysis
Content Validity
To analyze the qualitative data, content analysis of the interviews was conducted by a team of seven experienced investigators. The narrations of the interviews were categorized, mainly inductively and according to the topic and the conceptual areas provided by the interview as a whole. Next, the data were coded by counting the frequencies of the references in each category of the narration. Each section of the interview was categorized and coded by two of the seven researchers of the study. Inter-rater agreement of the coding of each pair of researchers was applied to study the reliability of the codifications. Inconsistencies were resolved by consensus. The analysis yielded substantial reliability (κ = .77, SD = .10, statistic value range from .62 to 1).
Validation of the internal structure of the adaptation of HIV Stigma Scale for use with Spaniards (HSSS)
First, we conducted first-order confirmatory factor analysis (CFA) to assess the fit of the adapted questionnaire to the factor structure proposed by the authors of the original scale (model 2; Berger et al., Reference Berger, Ferrans and Lashley2001; Bunn et al., Reference Bunn, Solomon, Millar and Forehand2007). Next, to address the second goal of this investigation, second-order CFA was performed to determine whether the four first-order factors could be explained by means of two new dimensions or latent factors (model 1). The new proposed dimensions were Perceived External Stigma, which would include Personalized Stigma and Concern with Public Attitudes, and Internalized Stigma, which would include Disclosure Concerns and Negative Self-image. Finally, in order to compare the model fit to the proposed structure (four first-order factors and two second-order factors), we tested two alternative models. The first one assessed the fit of the adapted questionnaire to two first-order factors (Perceived External Stigma and Internalized Stigma; model 3). The second one assessed its fit to four first-order factors and one second-order factor (model 4). We compared the change of the fit between these models and our proposed model (four first-order factors and two second-order factors).
The robust unweighted least square method was used, as the factors of the scale did not meet the assumption of normality. To determine goodness of fit, the following indexes were employed: the Satorra-Bentler chi square, the chi-square-df ratio, the goodness of fit index (GFI), the adjusted goodness of fit index (AGFI), the root mean square residual (RMR), the standardized root mean square residual (RMSEA), the comparative fit index (CFI), the normed fit index (NFI), the nonnormed fit index (NNFI), the incremental fit index (IFI), and the consistent Akaike information criterion (CAIC).
Criterion validity
Next, we analyzed the criterion validity of the adapted version of the Stigma Scale. For this purpose, we analyzed, using Pearson`s correlation, the relation between the stigma dimensions and the following variables related to well-being: (a) the total score of participants’ quality of life and each one of its dimensions (Social Support, Life Satisfaction, and Physical and Psychological Well-being); (b) their perceived self-efficacy to cope with stigma; and (c) the degree of HIV status disclosure. In accordance with the literature (Fuster-RuizdeApodaca et al., Reference Fuster-RuizdeApodaca, Molero and Ubillos2015; Greeff et al., Reference Greeff, Uys, Wantland, Makoae, Chirwa, Dlanini and Holzemer2010; Holzemer et al., Reference Holzemer, Uys, Chirwa, Greeff, Makoae, Kohi and Durrheim2007; Logie & Gadalla, Reference Logie and Gadalla2009), we expect a negative relation between stigma dimensions and these variables. Finally, we analyzed whether there were differences in health-related variables as a function of participant’s perceived external and internalized stigma. We expected poorer physical health in individuals with higher levels of stigma perception (Logie & Gadalla, Reference Logie and Gadalla2009).
The PRELIS and LISREL 8.7 programs were used for the CFAs, and, for the remaining analyses, SPSS 15.
Results
Review and Adaptation of the Stigma Scale Items
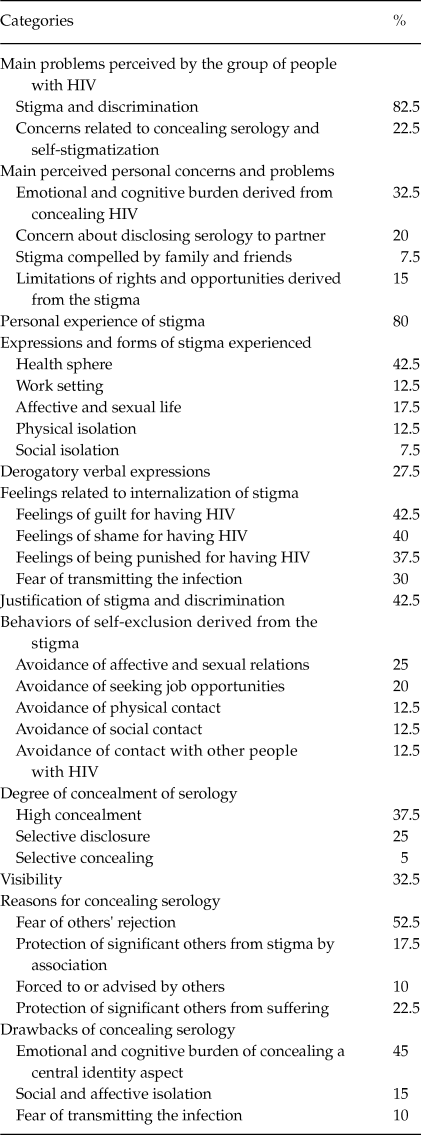
First, we compared the translation of the scale items with the analyzed discourses of the people with HIV in those sections of the interview from the qualitative study corresponding to the topic of this study. A summary of the main categories and their frequencies can be seen in Table 2. Next, the following modifications were carried out on Bunn et al.’s (Reference Bunn, Solomon, Millar and Forehand2007) revised and reduced version of the HIV Stigma Scale. Items 28, 38, and 39, all belonging to the factor Personalized Stigma, were eliminated. There were two reasons for these eliminations. The first was to reduce the scale, because this factor contained the most items, and the items that were eliminated loaded on three factors of Berger et al.’s (Reference Berger, Ferrans and Lashley2001) original scale. The second reason was that, after translation, the content of the items was less representative of the reactions of the Spanish population towards people with HIV than the rest of the items of this factor. Additionally, item 14 was also eliminated, and items 8, 10, and 12 were reworded because their original wording contained statements and terms that generated rejection or distress or did not coincide with Spanish reality. Finally, items 15 and 23 were eliminated from the factor Negative Self-image, and four new items were added to this factor (items 11, 13, 14, and 18). These new items contained potential attitudes or emotions derived from stigma internalization that were more representative of the reality of people with HIV in Spain because they had appeared in the participants’ discourse in the qualitative study, and they were not included in the items of the original scale. These items referred to the justification of stigma, the fear of infecting other people, self-exclusion from affective-sexual life for fear of transmitting HIV, and the feeling of deserving punishment for having the infection (see Table 2). The final scale comprised 30 items, and this was administered to the 557 participants in the second study. The items that comprised the questionnaire are shown in the Appendix 2.
Categories of the content analysis of the qualitative study and percentages of people who mention each one (n = 40)

Note: Main global categories obtained from the sections of the interview used in the present investigation. Responses to many of the categories allowed multiple coding.
Construct validity
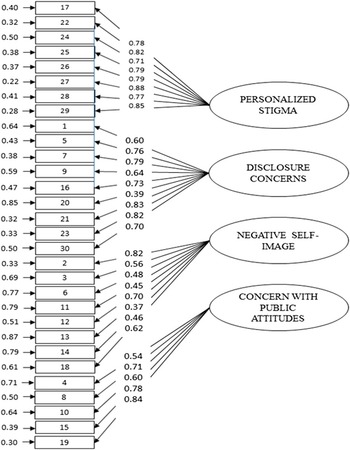
The results of the first-order CFA confirmed the model proposed by the authors (model 2; Berger et al., Reference Berger, Ferrans and Lashley2001). The results showed an acceptable fit of the model to the data (Table 3). As shown in Figure 1, most of the standardized loadings were near or higher than 0.5, the level considered adequate (Green, Reference Green1978). The results of the covariances among the factors are presented in Table 4.
Fit indexes of the proposed model and the alternative models

Note: 1Change in chi-square between the proposed model (Model 1) and the rest of the proposed alternative models.
First-order confirmatory factor analysis of the adapted HIV Stigma Scale. Estimation of the robust unweighted least squares.

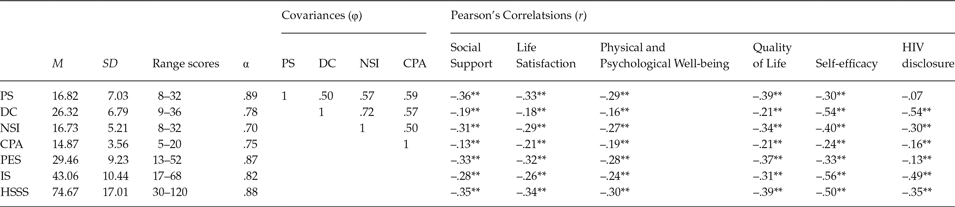
Descriptive statistics, covariances (φ) between the factors of the Spanish HIV Stigma Scale and correlations between the factors of the Spanish HIV Stigma Scale and the criterion variables

Note: The scale has a range of 4 points. PS = Personalized Stigma, DC = Disclosure Concerns, NSE = Negative Self-Image, CPA = Concern with Public Attitudes, PES = Perceived External Stigma, IS = Internalized Stigma. Perceived External Stigma and Internalized Stigma are the dimensions resulting from the second-order CFA. HSSS = HIV Stigma Scale Spain.
** p < .01.
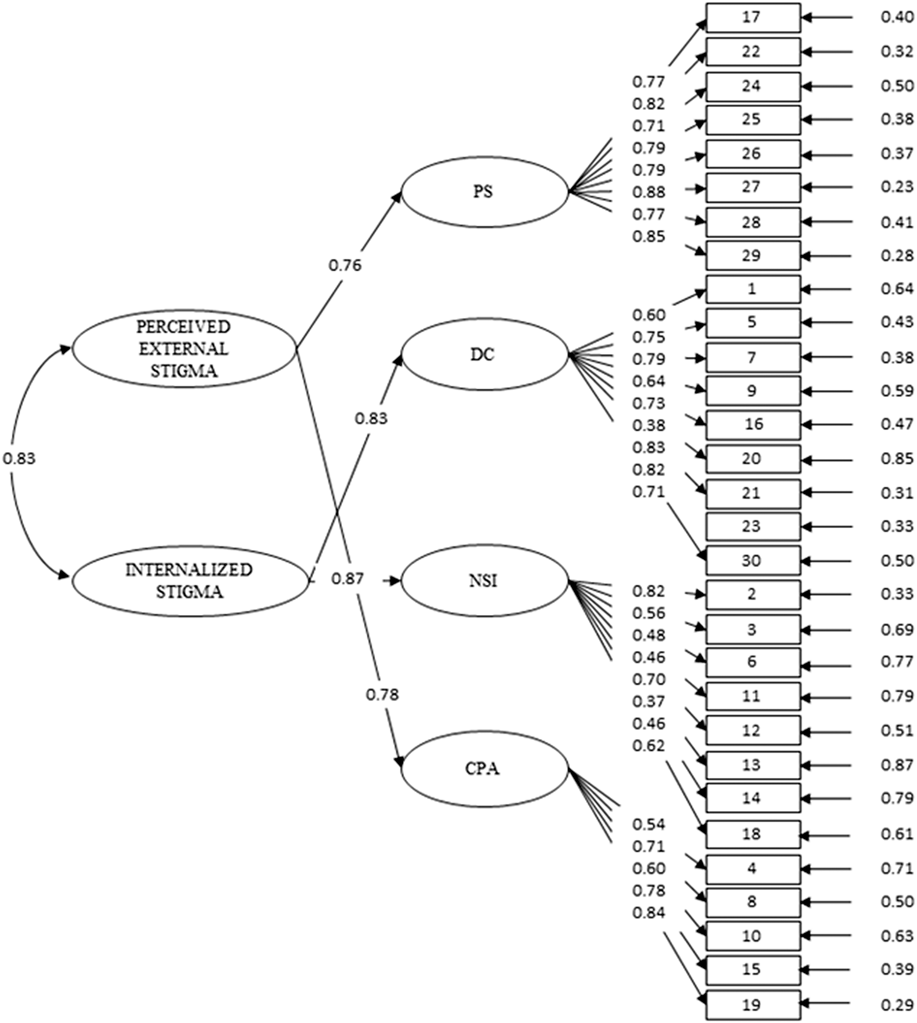
Next, second-order CFA was performed. The model confirmed the four first-order factors found and two second-order factors (model 1). These were Perceived External Stigma (on which loaded Personalized Stigma and Concern with Public Attitudes) and Internalized Stigma (which grouped Disclosure Concerns and Negative Self-image). The model presented an acceptable fit to the data (table 3). Figure 2 shows the model with the standardized parameters. All the parameters of the model were statistically significant (p < .05) and the standardized coefficients generally presented high values although they were moderate in some cases. Likewise, a high correlation was observed between the second-order dimensions (φ= .83).
Second-order confirmatory factor analysis of the adapted HIV Stigma Scale. Estimation of the robust unweighted least squares. PS = Personalized Stigma, DC = Disclosure Concerns, NSI = Negative Self-Image, CPA = Concern with Public Attitudes.

Finally, we compare the fit of the different proposed alternative models. As shown in Table 3, the proposed second-order model (model 1) showed a better RMSEA value than the model with four first-order factors (model 2). In addition, the change in chi-square was significant and the fit was the most parsimonious. Also, this proposed second-order model presented a better fit than the alternative model that confirmed that the two proposed dimensions of stigma - Perceived External Stigma and Internalized Stigma -could be explained by two first-order factors (model 3). Finally, we found no differences in chi-square compared with the alternative model with a single second-order factor (model 4). However, some fit indices were somewhat better (RMR, AGFI, and CFI) in the model with two second-order factors.
Internal consistency
Table 4 shows that the dimensions with the highest internal consistency were Personalized Stigma and Disclosure Concerns, whereas Negative Self-image and Concern with Public Attitudes had somewhat lower, albeit good, internal consistency. The internal consistency of the two second-order dimensions, was also high.
Criterion validity
As can be seen in Table 4, we found negative correlations between the dimensions of stigma and the target variables related to well-being. Firstly, both the total score on Quality of Life and on each one of its dimensions—Social Support, Life Satisfaction, and Physical and Psychological Well-being—had negative relationships with the diverse factors of the Stigma Scale. The highest negative relationship was with the second-order dimension, Perceived External Stigma. Regarding the first-order factors, Personalized Stigma and Negative Self-image had higher negative relations with total Quality of Life and its dimensions than the other two factors (Disclosure Concerns and Concern with Public Attitudes of Rejection). Furthermore, we found negative correlations between all the stigma dimensions and perceived self-efficacy to cope with stigma. In this case, the highest correlation was found between self-efficacy and internalized stigma. Moreover, the same patterns of correlations were found between stigma dimensions and the degree of disclosure of HIV-positive status. However, in this case, the correlation between disclosure and the first-order factor Personalized Stigma was nonsignificant.
Finally, some differences as a function of the participant’s physical health were found. Those who had suffered AIDS-related opportunistic infections had a higher score in the Perceived External Stigma dimension (M = 2.66, SD = .68) than those who had not suffered them (M = 2.48, SD = .65), t (493) = 3.02, p = .003, d = 0.26. We found no significant differences in the scores of the Internalized Stigma dimension.
Stigma Scale Scores
The scores of the total Stigma Scale and its factors were calculated according to the method described by Berger et al. (Reference Berger, Ferrans and Lashley2001), adding the values corresponding to each response, such that higher scores are related to higher perceived stigma in its diverse dimensions. The scores of factors Personalized Stigma and Negative Self-image were slightly below the theoretical mean of the possible score for these factors. The mean scores of the factors of Concern with Public Attitudes of Rejection and Disclosure Concerns were high, exceeding the theoretical mean. With regard to the second-order dimensions, we observed that the Internalized Stigma score was slightly higher than the theoretical mean of the scale, whereas the Perceived External Stigma score was lower than that mean (see Table 4).
Discussion
As a result of this investigation, we have a version of the Stigma Scale (Berger et al., Reference Berger, Ferrans and Lashley2001; Bunn et al., Reference Bunn, Solomon, Millar and Forehand2007) adapted to a large sample of people with HIV in Spain. Thus, an outcome of this adaptation study, a questionnaire that measures two important dimensions of stigma (perceived external and internalized stigma) suffered by people with HIV is available. These results indicate that the 30-item version proposed shows diverse evidence of validity –content, apparent, construct, criterion validity– and therefore has good psychometric properties for use with Spaniards.
Regarding validity, the adaptation was performed on the basis of the results of a broad qualitative study, which allowed us to know at first hand the relevant issues about the perception of stigma and discrimination by Spaniards with HIV. Thus, both the original items retained and those included or modified are representative of Spaniards’ experience of stigma (both perceived external stigma and internalized stigma). Therefore, these items provide evidence of content validity and allow the measurement of both sources of stigma with the same instrument. Moreover, a small study of comprehension and appraisal by people with HIV was conducted, which allowed us to adjust the drafting and translation of the items to the reality of their situation and to the idiomatic language used in Spain. This provides evidence of apparent validity.
Second, evidence of construct validity was provided, both for internal (internal structure) and external aspects (criterion validity). Concerning the internal structure of the scale, this study has confirmed the four-factor structure proposed by its original authors (Berger et al., Reference Berger, Ferrans and Lashley2001). From the results, we conclude that the stigma perceived by people with HIV corresponds to a multidimensional model of four first-order factors that are related to each other, although with different contents.
However, this study has also gone one step further, showing that these four factors can be grouped into and summarized as two latent second-order dimensions, perceived external and internalized stigma. This factorial structure had the best and more parsimonious fit. Furthermore, this structure responds to the division identified in the literature and by international organizations about the types of stigma perceived by people with HIV (Bos et al., Reference Bos, Pryor, Reeder and Stutterheim2013; Herek, Saha, & Burack, Reference Herek, Saha and Burack2013; Parker & Aggleton, Reference Parker and Aggleton2003; Tsutusmi & Izutsu, Reference Tsutsumi, Izutsu, Preedy and Watson2010; UNAIDS, 2002). Thus, a second-order dimension related to diverse situations of rejection that people with HIV perceive from an external source, the majority group, was found. This dimension, perceived external stigma, includes personally experienced situations of rejection or discrimination, and also the rejection that people with HIV perceive directed towards the HIV community in general. Therefore, this dimension includes the concepts of enacted and felt stigma, as used by Herek et al. (Reference Herek, Saha and Burack2013). The second dimension, internalized stigma, includes feelings and concerns derived from the internalization of the negative attitudes of society and expressed in this scale through negative self-image and concerns about serostatus disclosure. Thus, this dimension is similar to the concept of self-stigma used both by Boss et al. (Reference Bos, Pryor, Reeder and Stutterheim2013) and by Herek et al. (Reference Herek, Saha and Burack2013).
Regarding this second-order factorial structure, it is important to note that the relation found between the two second-order dimensions is high, and no significant differences were found with respect to a single second-order factor. However, this could be because both are dimensions of the same social problem, the stigma suffered by people with HIV. In our opinion, the evidence of the content validity (based on of the theory of stigma and a qualitative study) and the differences in the size of the correlations of the two second-order dimensions of stigma with the criterion variables indicate that they are two different dimensions. The differentiation and study of these two sources of stigma is important because they allow us to better understand their implications in people with HIV.
Evidence of criterion validity was also provided. Firstly, we found a negative relation of all the dimensions of stigma with the dimensions of quality of life and self-efficacy to cope with stigma and the degree of disclosure of HIV-positive status.
With regard to the relations of the first-order factors with quality of life, the lowest correlations were found in the factors Disclosure Concerns and Concern with Public Attitudes. With regard to the second-order dimensions, Perceived External Stigma was the dimension with the strongest association. These findings are consistent with other investigations (Holzemer et al., Reference Holzemer, Uys, Chirwa, Greeff, Makoae, Kohi and Durrheim2007). Thus, Franke et al. (Reference Franke, Muñoz, Finnegan, Zeladita, Sebastian, Bayona and Shin2010) found that the perception of stigma is negatively related to quality of life. Although these authors used a different measure of quality of life, they also found that the factors with the lowest correlations were Disclosure Concerns and Concern with Public Attitudes. Previously, both Berger et al. (Reference Berger, Ferrans and Lashley2001) and Bunn et al. (Reference Bunn, Solomon, Millar and Forehand2007) had reported that high scores on the Stigma Scale correlated negatively with an important component of psychological well-being (self-esteem). In the study of Bunn et al., the lowest relation was also found with the factor Disclosure Concerns. There are several possible explanations for these findings. Regarding the factor Concern with Public Attitudes, perceiving stigma and discrimination towards people with HIV does not necessarily imply that the person has suffered it in the personal sphere. This would have a more negative impact on quality of life. In fact, research of discrimination in diverse socially disadvantaged groups concludes that there is a discrepancy between personal and group discrimination. This discrepancy may be due to the benefits for well-being of denying personal discrimination (Taylor, Wright, & Porter, Reference Taylor, Wright, Porter, Zanna and Olson1994). With regard to the factor Disclosure Concerns, other studies have shown that its impact on quality of life could derive through the mediation of other variables, such as self-efficacy or coping strategies (Fuster, Reference Fuster2011).
Regarding the negative correlations of the dimensions of stigma with perceived self-efficacy to cope with stigma, we found that the strongest correlation was with internalized stigma. This result is consistent with research showing the negative effects of internalized stigma not only on the well-being of people with HIV but also on their capacity to seek social support or to cope with stigma (Fuster-RuizdeApodaca et al., Reference Fuster-RuizdeApodaca, Molero and Ubillos2015; Herek, et al., Reference Herek, Saha and Burack2013; Stutterheim et al., Reference Stutterheim, Bos, Pryor, Brands, Liebregts and Schaalma2011; Visser et al., Reference Visser, Kershaw, Makin and Forsyth2008). Furthermore, some authors have indicated that, as internalized stigma is a negative attitude towards an aspect of oneself, this constitutes some sort of specific domain of low self-esteem (Herek et al., Reference Herek, Saha and Burack2013).
The negative correlations found between the dimensions of stigma and the degree of disclosure of HIV-positive status are also consistent with the literature (Logie & Gadalla, Reference Logie and Gadalla2009). In this case, internalized stigma had also the strongest negative correlation. In fact, disclosure concerns are a relevant dimension of internalized stigma.
Finally, we found some relation between stigma dimensions and the participants’ psychical health. Those who had suffered opportunistic infections related to AIDS had a higher punctuation in the Perceived External Stigma dimension. This result is also consistent with the literature showing the negative effects of stigma on physical health (Logie & Gadalla, Reference Logie and Gadalla2009; Stratchan et al., Reference Strachan, Bennett, Russo and Roy-Byrne2007).
The internal consistency found for the total scale and for the factors is good. The coefficients are lower than those of the original scale (Berger et al., Reference Berger, Ferrans and Lashley2001), which may be related to the lower number of items in this adapted version. However, compared to the reduced version of Franke et al. (Reference Franke, Muñoz, Finnegan, Zeladita, Sebastian, Bayona and Shin2010), similar and even higher coefficients were found in some factors, such as Disclosure Concerns.
Finally, the results of the scale scores show that the most relevant concerns are related to public attitudes about people with HIV and to disclosure. This same result was found by Franke et al. (Reference Franke, Muñoz, Finnegan, Zeladita, Sebastian, Bayona and Shin2010) in the version of the scale validated for Peruvians. In other studies with the scale, personalized stigma appeared as one of the most relevant sources of stigma for the interviewees (Bunn et al., Reference Bunn, Solomon, Millar and Forehand2007). The coincidence of the results found with the scale of Franke et al. (Reference Franke, Muñoz, Finnegan, Zeladita, Sebastian, Bayona and Shin2010) and the differences with the other studies carried out in an American population indicate that the realities experienced by people with HIV in varied cultural settings may be very different. In Spain, approximately 80% of the people with HIV conceal their condition to some extent (Agirrezabal, Fuster, & Valencia, Reference Agirrezabal, Fuster and Valencia2009; Fuster, Reference Fuster2011). This high rate of concealment could imply, on the one hand, less personal exposure to stigma and discrimination or, on the other hand, cognitive overload related to the constant concern about secret thoughts (Quinn, Reference Quinn, Levin and van Laar2006). In fact, in this study, the stigma dimension with the highest score in our participants was that of Internalized Stigma. It does not, therefore, seem that the problem of stigma in Spain derives from third persons but instead that the main source of stigma is internal; that is, the people with HIV. This result had been found in other studies (Visser et al., Reference Visser, Kershaw, Makin and Forsyth2008).
The results of this study have important implications, as they clear the way to the possibility of performing two strategies for the assessment of stigma perceived by people with HIV. The use of first- or second-order scores will depend on the researchers’ interests and the purpose of the measure. Assessment through the second-order dimensions could provide a continued appraisal of the sources of stigma in our society, clarifying the intensity and the direction and dimension of the response. In this sense, for example, through the second-order dimensions, those in charge of designing policies and allocating resources to address the topic of this study could determine the kind of interventions that are needed. On the other hand, four-dimensional assessment, by explaining more response variability and, as a result, gaining discriminative capacity, might detect more particular problems with stigma and, thereby, contribute to designing more specific interventions as a function of the people involved.
Despite the fact that a strong point of this study was the large sample size, it has some limitations. One of them is that the HIV community is heterogeneous, so future studies are needed to analyze scale invariance across sexes and as a function of other sociodemographic or relevant health characteristics. This is a central issue in the field of measurement and one that would allow generalization of the model (Vandenberg & Lance, Reference Vandenberg and Lance2000). Furthermore, it would be necessary to conduct crossed validation of the results in future studies.
Finally, it is important to underline that in this research, we adapted the Stigma Scale (Berger et al., Reference Berger, Ferrans and Lashley2001). This adaptation has allowed us to measure two major sources of stigma with the same scale. However, given that changes have been made in some items, this will affect cross-cultural comparisons.
This study was supported by the Fundación para la Investigación y Prevención del Sida en España (FIPSE). Research Grant: 24637/07.
Appendix 1
Studies that have made adaptations and validations of the HIV Stigma Scale

Appendix 2
Spanish adaptation of the HIV Stigma Scale
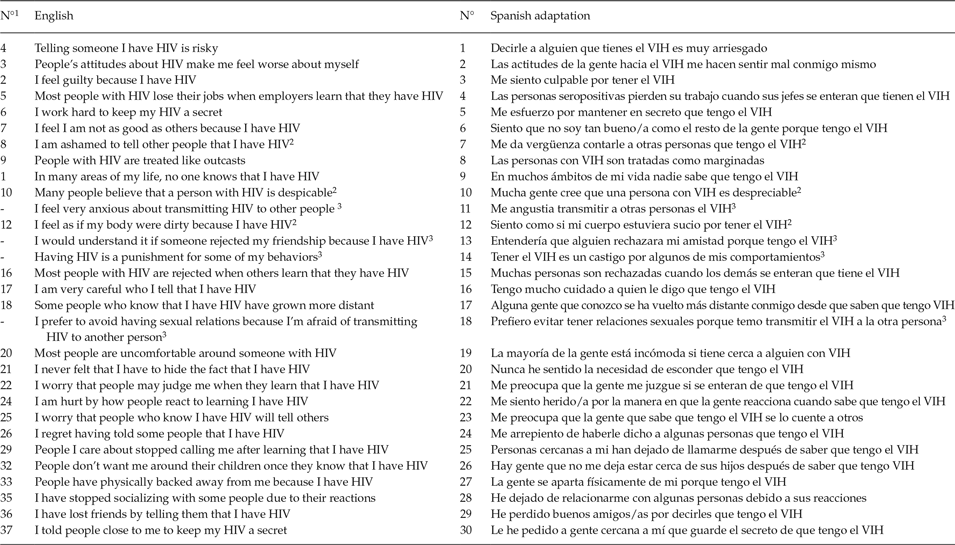
Note: 1Item number of the original scale 2Item with variations in the translation compared to the original item. 3Item added based on the content analysis of the qualitative study.