
I. INTRODUCTION
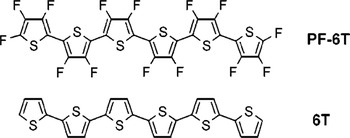
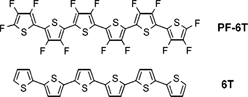
Organic semiconductors are a class of materials, which offer a wide range of possibilities for basic research and technical applications. Reference Forrest1 The exploration of their physical properties in thin films plays an important role in improving organic based devices. Reference Witte and Wöll2 α-sexithiophene (6T, C24H14S6), an organic p-type semiconductor with high hole mobility, has already been applied in organic devices Reference Dodabalapur, Katz, Torsi and Haddon3 and is known since the 1940s, Reference Steinkopf, Leitsmann and Hofmann4 whereas the first perfluorinated oligothiophene tetradecafluoro-α-sexithiophene (PF6T, C24F14S6) was synthesized in 2001 in Japanese laboratories Reference Sakamoto, Komatsu and Suzuki5,Reference Sakamoto, Komatsu and Suzuki6 and represents a thus far rarely studied organic semiconductor. Both 6T and PF6T are similar in size and shape (see Fig. 1); they are centrally symmetric and their thiophene rings are linked together by C–C bonds, which is not the case for other organic semiconductors such as the well-known pentacene (PEN) and perfluorinated pentacene (PFP). These molecules are mirror symmetric and their benzene rings are connected directly by the sharing of two carbon atoms. Furthermore, PF6T exhibits strong electric dipole moments within each thiophene ring pointing from the sulfur atom to the opposite fluorine atoms. The crystalline structure of 6T single crystals is well studied. Reference Horowitz, Bachet, Yassar, Lang, Demanze, Fave and Garnier7 Thin films of pure 6T grown on silicon oxide exhibit polymorphism depending on the experimental growth conditions, such as growth rate and substrate temperature. Low substrate temperatures result in crystal structures similar to those grown at high deposition rates. Reference Servet, Ries, Trotel, Alnot, Horowitz and Garnier8–Reference Moser, Salzmann, Oehzelt, Neuhold, Flesch, Ivanco, Pop, Toader, Zahn, Smilgies and Resel10 A recent study demonstrated that at room temperature two competing phases of the 6T crystal coexist. Reference Lorch, Banerjee, Frank, Dieterle, Hinderhofer, Gerlach and Schreiber11 In both cases the molecules are in a standing-up configuration exhibiting a small tilt angle with respect to the normal of the substrate surface. Depending on the stage of growth and the substrate temperature during growth, either the less tilted or the more tilted orientation is predominant. A theoretical approach recently described the transition between these two 6T polymorphs. Reference Klett, Cocchi, Pithan, Kowarik and Draxl12 For thin films of pure PF6T, a similar structural behavior is expected. In a suitable combination, PF6T could serve as an acceptor material in organic devices exhibiting a potential charge transfer (CT) mechanism, which has received widespread attention in the last few years in organic donor–acceptor systems. Reference Amsalem, Niederhausen, Wilke, Heimel, Schlesinger, Winkler, Vollmer, Rabe and Koch13 CT has already been studied for 6T Reference Blinov, Palto, Ruani, Taliani, Tevosov, Yudin and Zamboni14,Reference Taliani and Blinov15 and blends containing 6T, Reference Duhm, Glowatzki, Cimpeanu, Klankermayer, Rabe, Johnson and Koch16,Reference Niederhausen, Amsalem, Wilke, Schlesinger, Winkler, Vollmer, Rabe and Koch17 as well as for PEN and PFP. Reference Broch, Heinemeyer, Hinderhofer, Anger, Scholz, Gerlach and Schreiber18–Reference Kolata, Breuer, Witte and Chatterjee21 Many studies of mixed thin films containing PEN and PFP addressing the effect of fluorination and mixing on various physical properties already exist, Reference Inoue, Sakamoto, Suzuki, Kobayashi, Gao and Tokito22–Reference Medina, Beljonne, Egelhaaf and Gierschner37 but there are less studies of PF6T thin films and to our knowledge no studies of mixed thin films of 6T and PF6T.
Structure of α-sexithiophene 6T and the perfluorinated tetradecafluoro-α-sexithiophene PF6T. Reference Sakamoto, Komatsu and Suzuki5,Reference Sakamoto, Komatsu and Suzuki6

The goal of this study is to exploit the effect of perfluorination and mixing in thin films of 6T and PF6T on their morphology, their crystalline structure, and their optical and electronic properties. For this purpose, we prepared and examined pure and mixed thin films of 6T and its perfluorinated counterpart PF6T by coevaporation following previous studies. Reference Lorch, Banerjee, Frank, Dieterle, Hinderhofer, Gerlach and Schreiber11,Reference Hamano, Kurata, Kubota and Koezuka38–Reference Hinderhofer and Schreiber41
II. EXPERIMENTAL METHODS
Pure and mixed films of 6T and PF6T in the molar ratio 6T:PF6T, 3:1, 2:1, 1:1, 1:2, and 1:3 were grown by coevaporation under ultrahigh vacuum conditions on native silicon oxide, thermally oxidized silicon, and quartz glass at a substrate temperature of 300 K. In addition, pure PF6T was grown at various substrate temperatures on native silicon oxide. The growth rate was 2 Å/min and the duration of growth was 50 min resulting in a mean thickness of 10 nm for all films.
X-ray diffraction experiments were performed for structural investigations ex situ after growth and in real-time in situ during growth. For this purpose a portable ultrahigh vacuum chamber for organic molecular beam deposition Reference Ritley, Krause, Schreiber and Dosch42 and synchrotron radiation with an energy of 13 keV corresponding to a wavelength of 0.954 Å at the material science beam line MS-X04SA (PSI, Villigen, Switzerland) for surface analysis of the Swiss Light Source Reference Willmott, Meister, Leake, Lange, Bergamaschi, Böge, Calvi, Cancellieri, Casati, Cervellino, Chen, David, Flechsig, Gozzo, Henrich, Jäggi-Spielmann, Jakob, Kalichava, Karvinen, Krempasky, Lüdeke, Lüscher, Maag, Quitmann, Reinle-Schmitt, Schmidt, Schmitt, Streun, Vartiainen, Vitins, Wang and Wullschleger43 was used. The detector was a Pilatus II area detector (Dectris, Baden-Daettwil, Switzerland) with 486 × 195 pixels. The acquired X-ray reflectivity (XRR) profiles were transformed into q z -space and provided information about the crystal structure in the out-of-plane direction. Grazing incidence X-ray diffraction (GIXD) profiles providing information about the crystal structure in the in-plane direction were transformed into q xy -space. X-ray diffraction data of pure 6T, grown at a deposition rate between 1.3 and 1.6 Å/min and a mean thickness of 20 nm, were taken from a previous study for comparison. Reference Lorch, Banerjee, Frank, Dieterle, Hinderhofer, Gerlach and Schreiber11 The surface morphology was probed with atomic force microscopy (AFM) using a JPK Nanowizard II instrument (JPK Instruments AG, Berlin, Germany) in tapping mode under ambient conditions and image processing and analysis were done by using the Gwyddion software.
We investigated the core-levels with X-ray photoelectron spectroscopy (XPS) using a monochromatic Al Kα source with a photon energy of 1.4867 keV. The kinetic energy of photoelectrons was measured by an Omicron Sphera hemispherical analyzer (Omicron NanoTechnology, Taunusstein, Germany) with a multichannel detection. Ultraviolet photoelectron spectroscopy (UPS) measurements using a home-designed ultrahigh sensitivity UPS system equipped with an MBS A-1 analyzer and an MBS M-1 monochromator (MB Scientific AB, Uppsala, Sweden) for monochromatic He Ia light source of a photon energy of 21.218 eV provided information about the electrons in the outer most shells. The angle of incoming photons was 60° for XPS and 45° for UPS related to the surface normal and the emission angle was 0° for both, XPS and UPS. Apart from investigating the electronic structure, we also used XPS to check the mixing ratio of the 1:1 mixture. 44
The optical properties were examined by absorption measurements in normal incidence on transparent quartz glass using the Varian Cary UV–VIS spectrophotometer (Varian, Middelburg, The Netherlands) operating in the ultraviolet (UV), the visible (VIS), and the near infrared (NIR) range, which corresponds to wavelengths ranging from 190 nm to 1100 nm and in terms of energy it corresponds to a range of 1–6 eV. The in-plane absorption k was evaluated from the measured transmission T = I/I 0. 44–Reference Beltzer46 We probed the optical features for both in- and out-of-plane directions by variable angle spectroscopic ellipsometry (VASE) by using the Woollam M2000 ellipsometer (LOT-QuantumDesign GmbH, Darmstadt, Germany) on two different substrates, namely, naturally and thermally oxidized silicon, which is necessary to have enough input parameters for fitting the refractive index n and the absorption k. Photoluminescence and Raman spectroscopy were done by illuminating the samples with a green laser with a wavelength of 532.17 nm and an intensity of 0.05 mW in normal incidence for 3 s while measuring the emitted light with a nitrogen cooled LabRAM HR-UV CCD detector (Horba Jobin Yvon, Villeneuve d'Ascq, France) from HORIBA Jobin Yvon. The samples were measured in a nitrogen protection atmosphere to avoid an UV-driven oxidation during the exposure.
III. RESULTS AND DISCUSSION
A. Crystal structure
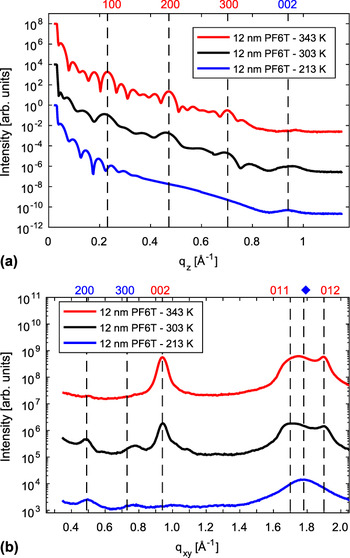
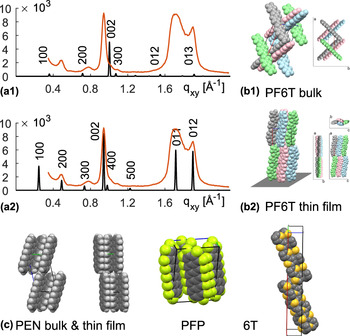
The crystal structure of organic thin films influences their electronic and optical properties and will be discussed first. Figure 2 shows XRR and GIXD profiles of pure PF6T thin films grown at three different substrate temperatures, i.e., 343, 303, and 213 K. The q-values of PF6T Bragg peaks from the thin film do not fit to the unit cell parameters of PF6T single crystals, Reference Sakamoto, Komatsu and Suzuki5,Reference Sakamoto, Komatsu and Suzuki6 showing that the thin film grows in another polymorph. Differences between thin film polymorphs and the single crystal bulk phase have also been observed for other molecules such as PEN and were identified as substrate induced polymorphism. Reference Jones, Chattopadhyay, Geerts and Resel47–Reference Schiefer, Huth, Dobrinevski and Nickel50 Assuming a rectangular unit cell (with allowance for small deviations) for the PF6T thin film polymorph, the lattice parameters fitting best to our data are a = 25.6 Å, b = 3.8 Å, and c = 13.3 Å. The following procedure was applied to find a possible PF6T thin film structure. The first assumption is that only (0kl)-peaks of standing-up molecules and (h00) peaks of lying-down molecules are visible in the GIXD profile. Other reflections are too far away from the grazing incidence scattering geometry. The second assumption is that the space group P21/c remains the same for thin film and bulk, implying that the symmetry elements are sustained. Then the unit cell lengths were chosen, such that the (0kl)-peaks and the (h00)-peaks fit to the measured GIXD peaks. Subsequently the molecular orientation was changed by rotating the molecules around their center such that the peak intensities agree with the measured peaks. It was ensured that peaks, which are not visible in the measured profile, are extinct. The molecules are equally distributed in the unit cell, tightly packed, and do not overlap. Figure 3(a1) shows a comparison of the measured GIXD profile of pure PF6T grown at 300 K with peak positions and intensities calculated for the crystal structure of the PF6T bulk phase, and Fig. 3(a2) shows a comparison of the measured GIXD profile of pure PF6T grown at 300 K with peak positions and intensities calculated for the PF6T thin film crystal structure. Figures 3(b1) and 3(b2) show a schematic representation of the corresponding crystal structures. For comparison Fig. 3(c) reprints schematic representations of the PEN bulk crystal, Reference Mattheus, Dros, Baas, Meetsma, Boer and Palstra49 the PEN thin film crystal, Reference Schiefer, Huth, Dobrinevski and Nickel50 PFP, Reference Sakamoto, Suzuki, Kobayashi, Gao, Inoue and Tokito23 and the 6T crystal structure. Reference Lorch, Banerjee, Frank, Dieterle, Hinderhofer, Gerlach and Schreiber11 Note that the PEN thin film crystal exhibits less tilted molecules, which agrees with the behavior of the PF6T thin film crystal, and the molecular arrangement in PFP is similar to the one of PF6T. Rigorous fitting algorithms will be required to resolve the crystal structure of PF6T thin films in more detail, but a few conclusions can already be drawn.
(a) XRR profiles of 12 nm thin films of pure PF6T on native silicon oxide (SiO X ) grown at various substrate temperatures. There is a transition from standing-up molecules in the thin film grown at the high substrate temperatures (red) to lying-down molecules in thin films grown at the low substrate temperatures (blue). The thin film grown at room temperature contains both standing-up and lying-down molecules. (b) GIXD spectra of 12 nm thin films of pure PF6T on native silicon oxide (SiO X ) grown at various substrate temperatures. The XRR-peaks of standing-up molecules appear as GIXD peaks of the lying-down molecules and vice versa, which means that the profiles belong to the same thin film crystal structure, which is once oriented with the a-axis perpendicular to the substrate surface (standing-up) and once with the a-axis parallel to the substrate surface (lying-down).

(a1) Calculated GIXD peaks of the PF6T bulk phase and (b1) corresponding crystal structure of the PF6T bulk phase. Reference Sakamoto, Komatsu and Suzuki5,Reference Sakamoto, Komatsu and Suzuki6 (a2) Calculated GIXD peaks of the PF6T thin film phase and (b2) corresponding crystal structure of the PF6T thin film phase. The molecules were painted in different colors to make them more distinguishable, but they are all PF6T molecules. Note that the calculated GIXD profiles (black curves) present peak positions and peak intensities calculated from the crystal structure. Peak widths were not included in the calculations. The measured GIXD profile of the PF6T thin film grown at 300 K is plotted in (a1) and (a2) for comparison (orange curves). It is clear from these plots that there is a thin film phase with a different unit cell and a different molecular orientation. (c) From left to right: PEN bulk crystal, Reference Mattheus, Dros, Baas, Meetsma, Boer and Palstra49 PEN thin film crystal, Reference Schiefer, Huth, Dobrinevski and Nickel50 PFP, Reference Sakamoto, Suzuki, Kobayashi, Gao, Inoue and Tokito23 6T, Reference Lorch, Banerjee, Frank, Dieterle, Hinderhofer, Gerlach and Schreiber11 reprinted from the cif-files.

The lattice spacing in the out-of-plane direction was determined from the XRR profiles in Fig. 2(a) and turned out to be similar to the length of PF6T molecules, which gives rise to the conclusion that PF6T molecules are standing perpendicular to the substrate surface. The length of a PF6T molecule was estimated to be 24.5 Å. Reference Sakamoto, Komatsu and Suzuki5,Reference Sakamoto, Komatsu and Suzuki6 At high substrate temperatures (343 K), the lattice spacing in the out-of-plane direction was 27.0 Å. Taking into account that interference effects between substrate and film scattering may have shifted the Bragg peak toward an unrealistically large q-value, Reference Kowarik, Gerlach, Leitenberger, Hu, Witte, Wöll, Pietsch and Schreiber51 the lattice spacing could be even closer to the molecular length. At room temperature (303 K), the out-of-plane lattice spacing is estimated from XRR to be 28.7 Å, an increase by 1.7 Å compared to the out-of-plane lattice spacing of the film grown at high substrate temperatures. According to previous studies of 6T thin films, Reference Lorch, Banerjee, Frank, Dieterle, Hinderhofer, Gerlach and Schreiber11 the larger out-of-plane lattice spacing can be interpreted as a crystal structure, in which the molecules are less tilted toward the substrate surface. Furthermore, this XRR profile exhibits one broad Bragg peak around q z = 0.94 Å−1, which stems from the (002)-reflection of lying-down molecules. At low substrate temperatures (213 K), the Bragg peaks of the standing molecules disappear and only the broad (002)-peak of the lying-down configuration remains.
The GIXD peaks of films grown at high temperatures in Fig. 2(b) can be assigned to the (002)-, the (011)-, and the (012)-planes. All three peaks belong to the standing-up configuration indicated by the first Miller index being zero. The (002)-reflection at q xy = 0.94 Å−1 of the high temperature GIXD profile is in good agreement with the (002)-reflection at q z = 0.94 Å−1 of the low temperature XRR profile, which means that we have the same unit cell once standing upright at high temperatures (a-axis perpendicular to the substrate surface) and once lying-down at low temperatures (a-axis parallel to the substrate surface). This statement is corroborated by two further peaks appearing in the low temperature GIXD profile, namely, the (200)- and the (300)-reflection of lying-down molecules. The (200)-reflection at q xy = 0.49 Å−1 corresponds to a lattice spacing of 25.6 Å, which is close to the length of PF6T molecules. Furthermore, the profile of the film grown at the low substrate temperature exhibits one broad, but well pronounced peak around 1.8 Å−1, marked by a rhombus in Fig. 2(b), whose origin is not yet clear and further experiments are necessary for assignment. Apart from slightly changing peak positions and intensities, the XRR and GIXD profiles of PF6T grown at room temperature resemble a superposition of the high and the low temperature profiles, signifying that PF6T thin films grown at room temperature consist of molecules in both standing-up and lying-down configurations. As is typical for rod-like organic semiconductors, we observe that the amount of lying-down and standing-up molecules can be changed by varying the substrate temperature during growth. Reference Kowarik, Gerlach, Sellner, Schreiber, Cavalcanti and Konovalov52,Reference Kakudate, Yoshimoto and Saito53 At low substrate temperatures, the lying-down configuration is preferred, whereas at high substrate temperatures the molecules are predominantly standing-up.
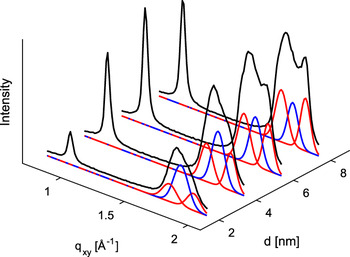
In situ real-time observation of GIXD peaks of pure PF6T grown at 300 K on native silicon oxide gives further information about the evolution of the crystal structure during growth (see Fig. 4). We observe that the broad peak around 1.8 Å−1, marked by a rhombus in Fig. 2(b) and associated with the lying-down configuration at low temperatures, grows faster in the beginning than the (011)- and the (012)-peak of the standing-up crystal structure. Then after a film thickness of roughly 4.0 nm, which is beyond the second monolayer, the (011)-peak and the (012)-peak start to grow faster than the lying-down/low-temperature peak. One explanation could be that PF6T molecules initially arrange in a metastable state and need a certain time to arrange in the more stable configuration. Another explanation could be that the molecules prefer the lying-down/low-temperature configuration within the first two monolayers close to the substrate, which happens when the molecule–substrate interaction is stronger than the molecule–molecule interaction. Later, the influence of the substrate gets screened off as more and more layers add up during growth and molecule–molecule interaction starts to dominate leading to the standing-up/high-temperature configuration.
GIXD peak evolution of pure PF6T grown on native silicon oxide (SiO X ) at 303 K at different stages of growth (i.e., different thicknesses d), measurement (black curve), and fitted Gaussians of the low temperature polymorph (blue curve) and high temperature polymorph (red curve).

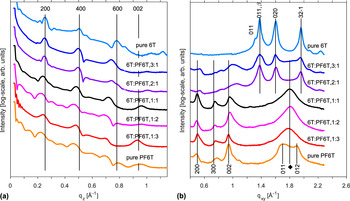
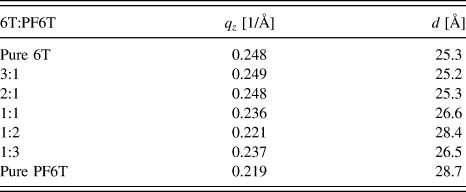
Figure 5 shows XRR and GIXD profiles of pure PF6T and various blends in comparison with the profile of pure 6T. The out-of-plane lattice spacing of standing-up molecules, estimated from the decreasing q z -values of the XRR profiles shown in Fig. 5(a), tends to increase with an increasing amount of PF6T from 25.2 Å to 28.7 Å (see Table I). Simultaneously the lattice spacing of the corresponding (003)-GIXD peak in Fig. 5(b) increases with an increasing amount of PF6T. Reasons for this could be a lower tilt angle, the larger volume filled with fluorine atoms, and interference effects between film and substrate. A lower tilt angle of standing-up molecules is rather unlikely, since the unit cell expands both laterally and vertically and a changing tilt angle would lead to a contraction of the unit cell in at least one direction. Therefore, the other plausible reasons include the presence of the fluorine atoms and the interference effects. The out-of-plane lattice spacing of lying-down molecules increases as well, which can be seen from the (002)-XRR peak in Fig. 5(a). The (300)-GIXD peak in Fig. 5(b), corresponding to the lying-down molecules, shows a decrease of the in-plane lattice spacing. In this case, a lower tilt angle could be a reasonable explanation. The peaks of the 6T:PF6T 1:3 mixture have larger q-values than expected, which can be attributed to the interference effect, leading to a thickness dependent shift of Bragg peaks toward larger q-values. Reference Kowarik, Gerlach, Leitenberger, Hu, Witte, Wöll, Pietsch and Schreiber51
(a) XRR profiles of 12 nm thin films of pure PF6T and 12 nm thin films of 6T:PF6T blends in comparison with 20 nm thin films of pure 6T grown on native silicon oxide (SiO X ) at 300 K. The out-of-plane lattice spacing of 6T, PF6T, and the blends is similar. It increases with increasing amount of PF6T due to the larger volume covered by fluorine, a lower tilt angle of the PF6T molecules, and interferences effects at the interface between thin film and substrate. (b) GIXD profiles of 12 nm thin films of pure PF6T and 12 nm thin films of 6T:PF6T blends in comparison with 20 nm thin films of pure 6T grown on native silicon oxide (SiO X ) at 300 K. The GIXD profiles suggest statistical mixing with segregation of excess molecules.

q z -Values and corresponding lattice spacing d in out-of-plane direction of the various blends in comparison with pure 6T. All films have been grown at 300 K on native silicon oxide (SiO X ).

The comparison of GIXD profiles of pure films and blends enables us to form a first idea of the molecular mixing behavior. Of course, further investigative techniques will be necessary to elucidate the mixing behavior in more detail. Considering the GIXD profiles, a complete phase separation is rather unlikely. The profile of the 1:1 mixture does not resemble a superposition of the profiles of the pure films as it is the case for phase separating systems. New peaks, which are indicative of the existence of a 6T-PF6T co-crystal with a crystal structure different from the ones of pure films, also do not appear. So the scenario seems to be the following. Bragg peaks of 6T are only present, as long as there is an excess of 6T molecules. Then in the GIXD profile of the 1:1 film, there are no 6T peaks visible anymore. We conclude that in films, where 6T is in excess with respect to PF6T, 6T is segregated, while in the mixtures, where 6T is not in excess, both compounds intermix. A statistically mixed phase of 6T and PF6T is conceivable for the intermixing domains. Note that the Bragg peaks of PF6T are broader when PF6T molecules are in the minority indicating that the in-plane size of PF6T-crystallites is getting smaller. The profiles of blends, in which PF6T molecules are in the majority, are similar to the one of the low temperature phase of PF6T. It is likely that the presence of 6T molecules hinders the formation of the high-temperature phase of PF6T.
B. Morphology
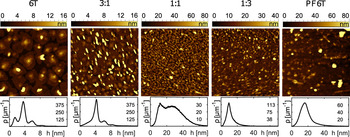
Apart from the crystal structure, the electronic and optical properties of organic devices depend on the morphology of the materials involved. AFM images of pure films and blends each 3 × 3 μm and the corresponding distributions of heights are shown in Fig. 6.
AFM images (3 × 3 μm) of pure films and blends, each 10 nm thin and grown on native silicon oxide (SiO X ) at 300 K. The graphs below show the corresponding distribution ρ of heights h. The histograms are normalized such that the integral over ρ from h = −∞ to h = +∞ is equal to one. The mixed films exhibit a continuous transition from wedding cake like islands of low heights stemming from 6T to more columnar islands of larger heights stemming from PF6T.

The images show that pure 6T thin films exhibit Stranski–Krastanov like growth morphology with islands on top of the filled organic layers. Reference Bauer and Poppa54 The islands are made up of three plateaus similar to a wedding cake. Each step between two plateaus has a height of approximately 24.5 Å, which is comparable to the length of a 6T molecule. It is obvious that each plateau consists of one monolayer of standing-up molecules as is typically observed for rod-like organic semiconductors. The wedding cake structure is characterized by multiple peaks in the height distribution, which are at a distance of 1 monolayer from each other. The shape of PF6T islands is more columnar with no terraces and similar to the Volmer–Weber like growth of islands. Reference Bauer and Poppa54 Although there are a few islands in pure PF6T films reaching a height of more than 20 nm, most of the islands are below 20 nm as the distribution of heights in the lower part of Fig. 6 demonstrates. The height distribution also demonstrates that the growth mode of mixed films changes gradually from Stranski–Krastanov growth for pure 6T closer to Volmer–Weber growth for pure PF6T. The number of peaks in the height distribution changes gradually from multiple peaks, characterizing the wedding cake structure, to fewer and fewer and finally only one broad peak, which is a characteristic feature of columnar islands of different heights. The maximum height of the islands, which was less than 10 nm for pure 6T, is more than 10 nm for the pure PF6T and the height distribution of the 1:1 mixture covers the largest range from 5 nm to 70 nm. Furthermore, mixtures close to the 1:1 mixing ratio exhibit the highest density of islands. There are more than 100 islands per μm2 with a base diameter of 0.1 μm in the 1:1 mixture. For comparison, 6T islands exhibit a mean base diameter of 0.5 μm and there are 3–4 islands per μm2. The base diameter of PF6T islands is 0.2 μm and there are more islands per μm2 than in 6T films, but less than in the 1:1 mixture. It should be mentioned that not only completely filled wetting layers contribute to the signal in X-ray experiments but also islands, which are larger than the coherence length of synchrotron X-rays. Furthermore, note that the zeroes in the scale bars of Fig. 6 mark the lowest point, which has been measured. This level assigned to zero and colored in black refers to the base of the islands and is not necessarily the substrate level. The amount of material inside the islands is less than the amount of material needed for a flat and completely filled 10 nm (nominal thickness) thin film. Hence, there is a wetting layer of varying thickness for each film below the islands. Diffusion processes and the Ehrlich–Schwoebel barrier play an important role for the differences in morphology and growth mode. Reference Bauer and Poppa54–Reference Villain, Pimpinelli, Tang and Wolf65 For further details about the morphology of oligothienyl thin films, the reader is referred to previous studies. Reference Biscarini, Samori, Greco and Zamboni66–Reference Sassella, Campione, Raimondo, Tavazzi, Borghesi, Goletti, Bussetti and Chiaradia68
C. Electronic structure
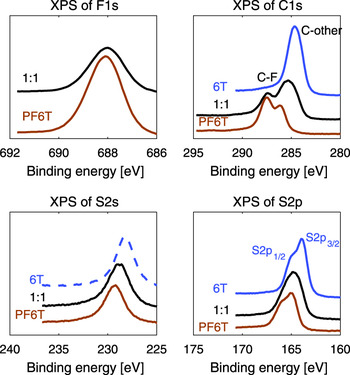
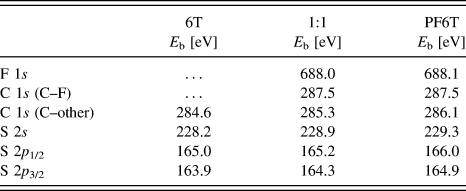
Investigating core-levels via XPS is a suitable technique for chemical analysis and characterization of organic thin films. Sulfur-, carbon-, and fluorine-signals obtained from XPS of pure films and the 1:1 mixture are shown in Fig. 7. The carbon peak essentially splits up into two peaks due to chemical shifts. The peak at a binding energy of 287.5 eV refers to carbon atoms bound to fluorine. It does not appear in the spectrum of pure 6T and has the same energy position for both the pure PF6T film and the mixed film. The second peak refers to carbon atoms, which are bound to hydrogen or sulfur. The S 2p peak comprises two peaks (S 2p 1/2 and S 2p 3/2) stemming from spin-orbital coupling. The binding energies of the S 2s and S 2p peaks are in good agreement with results from sulfur doped graphene Reference Quan, Yu, Chung, Jin, Park, Sung and Piao69 and from previously reported 6T deposited under ultrahigh vacuum conditions and investigated in solid state. Reference Oeter, Ziegler and Göpel70 The deviations from our results are not larger than 0.1 eV. We found that the sulfur peaks and the second carbon peak are shifted when PF6T is present. They move toward higher binding energies with an increasing fraction of PF6T. In the pure PF6T film, their shifting amounts to 1.0–1.1 eV for sulfur and 1.5 eV for carbon relative to the binding energies in the pure 6T film. We speculate that this effect is due to intra-molecular screening of the core-hole and the different local electron densities at the specific carbon or sulfur atoms. For the same reason, the F 1s peak itself and the C–F peak do not shift. For details see Table II. XPS has been performed on poly(3-hexylthiophene) (P3HT) and other thiophenes. For assignment, the binding energy of the C 1s peak has been reported for vapor deposited thin films of P3HT and deviates about 0.2 eV from our value. Reference Salaneck, Inganäs, Thémans, Nilsson, Sjögren, Österholm, Brédas and Svensson71,Reference Shrotriya, Ouyang, Tseng, Li and Yang72 More detailed studies have been carried out for spin coated films of P3HT. Reference Lachkar, Selmani and Sacher73,Reference Manceau, Gaume, Rivaton, Gardette, Monier and Bideux74 The carbon and sulfur peaks are located at energies, which are up to 0.5 eV higher than our values, which is likely due to the influence of the solvent.
A comparison of XPS signals of pure films and a 1:1 blend, each 10 nm thin and grown on thermally oxidized silicon at 300 K revealing without any doubt that the presence of fluorine shifts the core-levels of other elements toward higher binding energies even when they are not directly bound to fluorine. This becomes clear considering that the C 1s peak of carbon atoms directly bounds to fluorine and the fluorine peak itself stays at a constant binding energy, while all other peaks shift with increasing amount of PF6T.

Position of XPS peaks in terms of binding energies E b of pure films and the 1:1 mixture grown at 300 K on thermally oxidized silicon. C–F means carbon atoms bound to fluorine and C–other means carbon atoms bound to other elements.

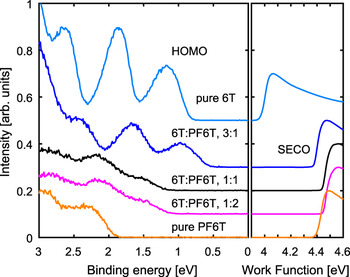
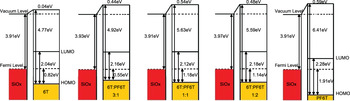
After analyzing the core-levels, we now move on to discuss the region of the highest occupied molecular orbitals (HOMOs) of 6T, PF6T, and blends investigated by UPS. The spectra of pure films and blends with different mixing ratios are presented in Fig. 8. The right-hand side of Fig. 8 shows the secondary electron cutoff (SECO). The SECO positions of the blends and pure PF6T are very similar, but it is ∼0.45 eV lower for pure 6T. Comparing this with the vacuum level of the bare substrate reveals that pure 6T has almost no interface dipole (ID), whereas blends containing PF6T exhibit an ID of 0.51 eV ± 0.08 eV. The left-hand side of Fig. 8 shows the HOMO region in terms of binding energies relative to the Fermi level. We note that the observed photoelectron intensity from the pure PF6T film was ∼40 times smaller than for pure 6T, which may stem from the enhanced roughness of PF6T films. The mixed film spectra can be reproduced from the spectra of the pure films and no new energy states are detected. This suggests that there is no significant orbital hybridization between 6T and PF6T. However, judging from the strong change of binding energies in the mixtures relative to the pure films, we assume that a partial CT between both species is occurring. From the data in Fig. 8 we determined the energy level diagram shown in Fig. 9. The presented HOMO levels were determined from the onset of the first UPS peak in each spectrum. The onsets of the lowest unoccupied molecular orbitals (LUMOs) are derived from optical absorption measurements, which will be discussed in the next section, and are included in these diagrams for completeness. The ionization energies (IEs) of pure 6T are 4.77 eV for upright standing molecules. PF6T has a significantly increased IE of 6.41 eV, which was observed also for other perfluorinated compounds. Reference Medina, Beljonne, Egelhaaf and Gierschner37,Reference Opitz, Wilke, Amsalem, Oehzelt, Blum, Rabe, Mizokuro, Hörmann, Hansson, Moons and Koch75 The IEs of the blends are in between the pure materials. This change in the IE is presumably related to different polarization energies in the different blends. Reference Yoshida, Yamada, Tsutsumi and Sato76 Due to the high IE of PF6T, its LUMO is pinned at the substrate Fermi level, whereas 6T with its lower IE is nearly aligned by the vacuum level, i.e., without ID. In the mixed films, the ID from the PF6T level pinning persists, which pushes the 6T HOMO closer to the Fermi level and reduces the binding energy. This effect is most pronounced in the 3:1 blend, where the binding energy is reduced to 0.55 eV.
UPS data of pure films and several blends, each 20 nm thin and grown on native silicon oxide (SiO X ) at 300 K. The left part of the figure shows that the binding energy of the HOMO level in blends shifts toward higher binding energies with increasing amount of PF6T due to Fermi-level alignment. The strong ID of PF6T persisting in blends, which can be seen from the SECO in the right part of the figure, pushes the HOMO level of 6T toward lower binding energies, which is most pronounced for the 3:1 mixing ratio.

Energy level diagrams of pure films and several blends, each 20 nm thin and grown on native silicon oxide (SiO X ) at 300 K. The HOMO in the mixtures corresponds to the 6T HOMO shifted by the ID and the changed polarization energy. The LUMO level was determined from the onset of absorption peaks (see Fig. 10).

D. Optical properties
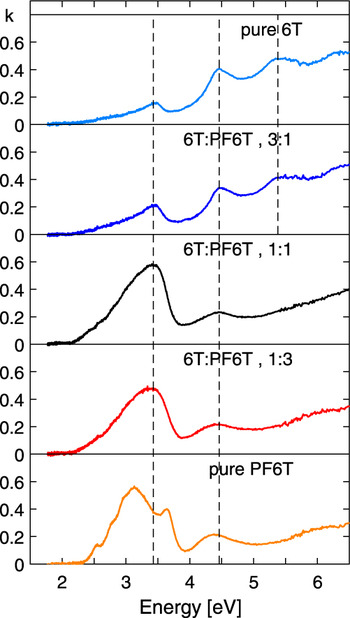
Absorption spectra are of special interest for organic solar cells. The absorption k of pure films and blends has been evaluated from transmission data measured under normal incidence on transparent quartz glass, see Fig. 10. The energy gap between the HOMO and the LUMO was estimated from the onset of the first absorption peak, which increases from 2.04 eV for pure 6T to 2.28 eV for pure PF6T (see Fig. 10). Qualitatively, the absorption spectra of pure films and blends reflect their structural and mixing behavior. Pure 6T and all blends have two absorption maxima within the measured region, which are always at the same energy of 3.43 and 4.46 eV. The third absorption maximum at 5.35 eV is only present in pure 6T and in blends, which contain more 6T than PF6T. This agrees well with the assumption that an excess of PF6T is segregated and hence the third absorption maximum stems solely from pure 6T domains. Pure PF6T exhibits additionally several smaller absorption features around the first maximum, which could stem from interactions between PF6T molecules. The third absorption peak is not present in the spectrum of pure PF6T. The intensity of the first absorption peak is proportional to the absolute value of the first HOMO–LUMO transition dipole moment in the in-plane direction. We observed that as long as 6T molecules are abundant, the first absorption maximum is lower than the second and third one. For the 1:1 mixture and for blends with an excess of PF6T and for pure PF6T, the scenario is reversed. Assuming that the corresponding transition dipole moment of 6T and PF6T is oriented along the long molecular axis, the increased intensity for pure PF6T can be explained by some lying PF6T molecules, as they were seen in the X-ray data. This assumption will be verified in the following.
Measured in-plane absorption k of pure films and blends, each 10 nm thin and grown on glass at 300 K. The first two absorption peaks are at the same energy for all pure and blended thin films. The third absorption peak is only visible for pure 6T and blends containing more 6T than PF6T, which agrees well with the segregation of excess 6T molecules. Pure PF6T exhibits additionally several smaller absorption features around the first maximum. The increased intensity of the first maximum of pure 6T can be explained by some PF6T molecules lying down.

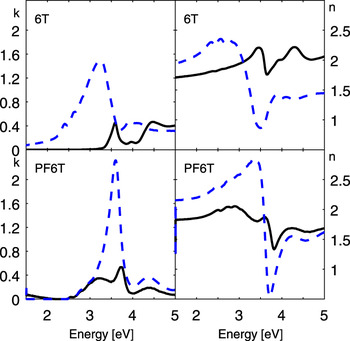
To determine the orientation of the first HOMO–LUMO transition dipole moment, VASE is required. The data were fitted by a layer model consisting of a substrate layer, an oxide layer, and an organic layer. The thickness of the layers was determined with the help of XRR. The roughness was modeled in accordance with the AFM images by introducing an additional layer on top, which contains an effective medium approximation (ema). Absorption k and index of refraction n of the organic film were fitted by an anisotropic model and k and n of the ema-layer were fitted by using the Bruggeman-Model, which was developed for rough interfaces. Reference Bruggeman77 Figure 11 shows the resulting in- and out-of-plane components of absorption k and index of refraction n of 6T and PF6T thin films grown at room temperature. The spectra of n and k are Kramers–Kronig consistent and their in-plane components generally coincide with the previously presented curves from absorption measurements. The in-plane component of k with a maximum value of ∼0.6 for both 6T and PF6T agrees well with the absorption spectra measured in transmission in normal incidence on quartz glass. The data demonstrate that the out-of-plane component is significantly larger than the in-plane absorption for both 6T and PF6T. We already know that the molecules are predominately standing on the substrate surface at room temperature. Therefore, we are able to assign the orientation of the first HOMO–LUMO transition dipole moment of 6T and PF6T to their long molecular axis, which verifies our previous assumption. For comparison, also PEN molecules are standing on the substrate, but their out-of-plane absorption is smaller than the in-plane one, Reference Inoue, Sakamoto, Suzuki, Kobayashi, Gao and Tokito22,Reference Hinderhofer, Heinemeyer, Gerlach, Kowarik, Jacobs, Sakamoto, Suzuki and Schreiber24 which means that their first HOMO–LUMO transition dipole moment is oriented along the short molecular axis of PEN.
In-plane component (solid line) and out-of-plane component (dashed line) of the absorption k (left) and the refractive index n (right) of pure 6T (top) and pure PF6T (bottom), each 10 nm thin and grown on silicon oxide at 300 K. The larger out-of-plane component of 6T and PF6T and the knowledge that the molecules are predominantly in a standing-up configuration at that temperature lead to the conclusion that the first HOMO–LUMO transition dipole moment is oriented along the long molecular axis for both types of molecules.

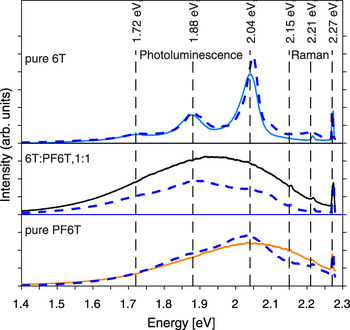
Finally, photoluminescence spectra of pure films and blends were measured (see Fig. 12). The photoluminescence spectrum of pure 6T comprises 3 peaks, a small peak at 1.72 eV and two relatively large peaks at 1.88 and 2.04 eV. With an increasing amount of PF6T, one broad peak covers the entire spectrum. Cooling the samples down to a temperature of 80 K reveals that this broad peak is a superposition of three peaks. Their energy positions do not change significantly due to the peaks of pure 6T. All spectra exhibit two sharp and pronounced Raman peaks at 2.21 and 2.27 eV close to the excitation energy of the laser beam, which is 2.33 eV (corresponding to a wavelength of 532 nm). The corresponding shifts of these peaks in terms of wavenumbers are 973 and 521 cm−1, which is typical for the silicon substrate Reference Popovic, Milosavljevic, Zekic, Romcevic and Daniels78 and explains their origin. Additionally, there is a very small Raman peak at 2.15 eV visible in the spectrum of the 1:1 blend, corresponding to a shift of 1465 cm−1. It originates from the C=C double bond stretching in the thiophene rings. Reference Degli Esposti, Fanti, Muccini, Taliani and Ruani79 Measurements at 80 K show that this peak also appears in the spectrum of pure PF6T. Features indicating a significant degree of CT were not observed in the photoluminescence spectra of blends within the measured range.
Photoluminescence spectra of pure films and 1:1 mixture, each 10 nm thin and grown on native silicon oxide (SiO X ) at 300 K, measured at 300 K (solid lines) and at 80 K (blue dotted lines). The line at 2.15 eV marks the Raman peak from C=C double bond stretching in thiophene rings and the lines at 2.21 and 2.27 eV mark the Raman peaks of the silicon substrate. The photoluminescence peaks are at the same energy but are getting broader when PF6T is present and sharper when the temperature is lower.

IV. SUMMARY AND CONCLUSION
This study has shown that perfluorination of small organic molecules such as 6T and mixing them with their non-fluorinated equivalent holds various possibilities of tuning the features of organic thin films. The comparison of pure films demonstrated that fluorination itself leads to significant changes concerning the crystalline structure, the morphology, and the electronic and optical properties. The investigation of mixed films demonstrated that choosing suitable mixing ratios represents a further possibility of tuning. XRR and GIXD experiments revealed that there is a coexistence of standing-up and lying-down PF6T molecules at room temperature. By varying the substrate temperature during growth, the orientation of PF6T molecules can be changed from lying-down at low temperatures to standing-up at high temperatures. The existence of a polymorphic PF6T thin film crystal structure underlines that the influence of the substrate has to be considered. In situ measurements during growth illuminated this influence further. The behavior of 6T:PF6T blends was examined for various mixing ratios and resulted in a mixed crystal with a segregation of excess 6T molecules. AFM images showed that the morphology changes continuously from terraced 6T islands of low heights into columnar islands of large heights with an increasing amount of PF6T. UPS measurements indicate that a strong ID appeared in PF6T thin films shifting the molecular orbitals to higher binding energies, whereas 6T exhibits almost no ID. Absorption and VASE measurements showed that molecular orientation and mixing behavior directly influence the optical properties of mixed 6T:PF6T thin films. Molecular orientation and mixing behavior are clearly recognizable in the optical spectra.
Supplementary Material
To view supplementary material for this article, please visit https://doi.org/10.1557/jmr.2017.99.
ACKNOWLEDGMENTS
We gratefully acknowledge the financial support of the German Research Foundation (Deutsche Forschungsgemeinschaft, DFG) and we thank the Paul Scherrer Institute for providing excellent facilities at the material science beam line MS-X04SA of the Swiss Light Source. C.L. and G.D. acknowledge financial support from the Carl-Zeiss-Stiftung. In addition, this research has been partly supported by JSPS KAKENHI (No. 24245034), by Grant-in-Aid for JSPS Research Fellow (15J08155) and by Global COE program (G-03, MEXT).