

Introduction
The main aim of this paper was to create an original model of correlations between the country of origin (COO) and the value of the perceived brand name. The theoretical part of the paper involves presentation of a conceptual model of the relations between the COO, elements of the product marketing mix and the value of the perceived brand name. The conceptual model of these correlations was designed and proved for a brand of the leading Slovenian company that produces and processes chicken meat. Since no discussions regarding the correlations are evident in the current scientific literature, either in general or for chicken products in particular, the research presented in the continuation and the results from this work comprise a much needed source of original scientific work. In the continuation, the conceptual model of the relations of the selected brand is evaluated. Based on the results of the extensive quantitative research the following conclusions can be made: the model with suitable adjustments can be generalised to the level of the general model that will be suitable for more detailed research in the field of measuring the impact of the COO on consumer behaviour and their perception of the perceived brand name value.
In the empirical part of the paper, the results of the extensive quantitative research are discussed. In the latter, the source sample consisted of citizens of the EU member states, aged from 18 to 65, who used the product at least once per month and are familiar with the brand, at least with its name. The modelled product belongs to the category of high-volume mass products or, to be more precise, to food products. The central objective of the quantitative research was to examine the basic hypothesis and the research hypotheses to evaluate the conceptual model of relations between the COO and its impact on the perceived brand name value. The mentioned correlations were analysed for pasteurised chicken sausages of the leading Slovenian brands. In the Slovenian market, recognition of both brands together amounted to 96%. The results of the research show the extent to which the product influences the perceived brand name value and how it does it as well as relations among the COO, marketing mix elements and the perceived brand name value.
Influence of the product origin on the consumer buying decision process
In international research, the known origin of a product has proved to be one of the more important factors in product distinction and selection by consumers and by that of the competitiveness, as well. Investigation of an impact that the COO has on consumer behaviour in the buying decision-making process became especially topical in the second half of the twentieth century and has been studied by different authors (Bilkey and Nes, Reference BILKEY and NES1982; Han and Terpstra, Reference HAN and TERPSTRA1988; Papadopoulos and Heslop, Reference PAPADOPOULOS and HESLOP1989; Kaynak et al., Reference KAYNAK, KUCUKEMIROGLU and HYDER2000; Vukasovič, Reference VUKASOVIČ2009a; Vukasovič, Reference VUKASOVIČ2009b; Strašek, Reference STRAŠEK2010). Reasons why the COO influences the buying decision are diverse and involve knowledge of a product group as well as knowledge of a certain country. Modern consumers choose among many products, produced in different countries around the world. Consumers' responses to this fact are different and depend upon their personal nature and opinion as well as other external factors.
Research into the influence the COO has on consumer behaviour are based upon opinion that the consumer's buying decision is influenced by external (e.g. price, brand, packaging, manufacturer) as well as internal (e.g. shape, applicability) properties of a product (Huddleston et al., Reference HUDDLESTON, GOOD and STOEL2001). Information about the COO represents an external product property that sends a message to consumers regarding product quality and value and influences his evaluation of the product, attitude towards the product as well as the buying decision. At the same time this external property, similarly as a brand, is something special, because, based on supplied information, a consumer can draw conclusions about other product properties that are important for product evaluation (Han, Reference HAN1988).
Results determined by some authors (Papadopolous and Heslop, 1989) have proven that product's COO influences consumer's perception of brands and their value. The extent to which this impact is reflected in an individual consumer depends largely on his socio-demographic and psychological characteristics and on a group of products, which a studied brand falls under. Hence companies face a dilemma whether to underline a product origin in their brands and, if so, to what extent. It can be concluded that the perceived image of a country, in which a product is manufactured, is important, because it can be a major reason for the customers' buying decision-making process.
The conceptual model of the relations between the COO and the perceived brand name value
The central aim of this research was to determine the relations between the COO and the perceived brand name value. The objectives carried out in the research were aimed at checking the fundamental thesis that was developed throughout the research hypotheses and to evaluate an original conceptual structural model of the relations between the COO and its impact on the perceived brand name value and, in doing so, to consider the relations between impacts of the marketing mix elements on the perceived brand name value of the selected product. The methodology and the extent of latent variable relations in the model were studied.
fundamental hypothesis
The fundamental thesis of the research was as follows: a chicken product origin has at least equally statistically significant impact on the perceived brand name value as the selected marketing mix elements (promotion, product, distribution and price).
The idea that a product origin, along with increasing cautiousness of consumers' own national and cultural identity, has a statistically significant impact on the perceived brand name value, contributed to formation of the fundamental thesis. It was determined that, in general, an effect of the COO is effective in connection with input variables, such as knowledge of the product, customer's characteristics, country's characteristics, nationality and patriotism. The stated input variables impact a perception of a product's brand name value and customer's buying decision. A positive image of a product origin in customer's eyes influences his buying decision and raises the perceived value of a brand. Broadly, a customer is in favour of products from countries with the positive image, and averse to products manufactured in countries with an unfavourable image.
In the continuation work, hypotheses that can be tested in practice were used to test the basic aims of the research. These hypotheses express relations among the variables and are empirically tested by the methods of multivariate statistical analysis. It has to be emphasised that the main aim of the hypotheses that are presented in the continuation was not to confirm the facts that are already established, but to determine suitability of the instruments used in the interviews, to evaluate sample representativeness and to test the conceptual model presented in the paper. The hypothesis H1A, which is based upon the fundamental thesis of the research, presumes a positive correlation between the domestic COO and the perceived brand name value of the selected product in consumers.
It was determined that the COO impacts customer's evaluation of products and their brands (Vukasovič, Reference VUKASOVIČ2009b). In the brand and product evaluation process a customer clings to all the available information. This information is first selected, then the available information regarding the product is processed and finally the buying decision regarding the product of the selected brand follows. The results of the research on customers' behaviour show that customers are often prejudiced against products of foreign countries. Namely, customers often reject imported products, because they are concerned for the domestic economic prosperity (Bilkey and Ness, 1982; Shimp and Sharma, Reference SHIMP and SHARMA1987). Brands and products produced in their own country are evaluated better as products, manufactured in foreign countries (Han and Terpstra, Reference HAN and TERPSTRA1988; Good and Huddleston, Reference GOOD and HUDDLESTON1995). It was assumed that in our case there also exists a positive correlation between the domestic COO and the perceived brand name value. The hypothesis H1A was formed based upon the stated correlations.
In the research a hypothesis H1B was also checked. This hypothesis, regarding the COO and the perceived brand name value, presumes that the perceived value of the studied chicken product from domestic production is significantly higher than the perceived value of the same brand, but from foreign origin (comparison with the product of the same brand, but produced in a foreign country).
Other hypotheses that refer to a connection among elements of the product marketing mix and their impact on the perceived brand name value were checked besides the mentioned hypotheses regarding the COO. In the continuation a hypothesis was formed for each element of the marketing mix of the product, all of them relating to a context of the COO and to the selected product brand. Hypothesis H2 refers to the more favourable a ratio between a price and quality of a chicken product, the higher the perceived value of the selected product brand.
Erevelles et al. (Reference EREVELLES, ABHIK and VARGO1999) and Sweeney et al. (Reference SWEENEY, SOUTAR and JOHNSON1999) determined that the higher perceived price leads to higher perceived product quality. Results of the research performed by other authors (Dodds et al., Reference DODDS, MONROE and GREWAL1991; Grewal et al., Reference GREWAL, MONROE and KRISHNAN1998; Sweeney et al., Reference SWEENEY, SOUTAR and JOHNSON1999) also show that the price directly influences the perceived value. In the buying decision process, price information is a significant indicator of product quality, reflecting its value as well as its brand value. Products that have high price positioning are perceived as products of higher quality (Blattberg and Winniewski, Reference BLATTBERG and WINNIEWSKI1989; Dodds et al., Reference DODDS, MONROE and GREWAL1991; Kamakura and Russell, Reference KAMAKURA and RUSSELL1993; Milgrom and Roberts, Reference MILGROM and ROBERTS1986).
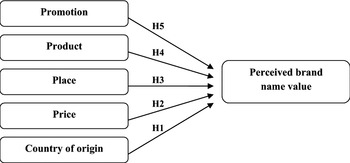
In the replacement process each time the product is purchased and used it represents certain financial and non-financial cost for consumer. In studying relations between the perceived price and the perceived value the majority of the authors (Monroe, Reference MONROE1990; Teas and Agarwal, Reference TEAS and AGARWAL2000) determined that price influences the perceived value in two directions: either product quality or financial sacrifices. If the price is too low, it can send a message that a product is not good quality, while on the other hand, if the price is too high, it can represent expenses that are too costly for consumer. In both cases the impact of such a price on the perceived value of a brand can be unfavourable. In the case when price and quality are balanced, it was presumed that this fact positively influenced the perceived value of a product brand. Based on the latter, the hypothesis H2 was formed. Ratio between price and product quality as well as their impact on the perceived brand value were determined by accurately selected questions stated in the questionnaire. In the context of the conceptual model, shown in Figure 1, together with the COO and the product price, an impact of quality distribution (deliverability) on the perceived value of the brand was also checked.
Hypothesis 3 (H3) was constructed to state that there exists a positive correlation between quality distribution of the chicken product and the perceived value of a brand. The term ‘quality distribution’ is defined as regular (daily) product availability from retailers. In the buying decision process, the consumer can, at anytime, decide to buy the selected product because, if distribution is good, the product is readily available. Numerous researches show that a regular presence of a product on retailer's shelves impacts customers' satisfaction. In different types of retail stores this can save time for the consumers seeking out a selected product (Ferris et al., Reference FERRIS, OLIVER and DE KLUYVER1989; Smith, Reference SMITH1992; Yoo et al., Reference YOO, DONTHU and LEE2000). Quality distribution or regular presence on the shelves can be seen as product promotion, which can positively influence the perceived brand name value. In the case when product is poorly distributed or is not widely available to customers respectively, this can increase customer dissatisfaction. If product unavailability is systematically repeated, this will have a negative midterm and long-term impact on the perceived value of product brand.
Hypothesis 4 (H4) states that good taste and other good properties of the chicken product have a positive impact on the perceived value of the product brand. The basic instrument of the marketing mix is a product that represents a tangible market presence, together with quality, shape and other properties which constitutes a brand in recognised packaging (Kotler, Reference KOTLER1998). Through trying out products, customers come across different brands (Keller, Reference KELLER1998). A prerequisite for successful marketing is to offer a product that totally meets customer's needs and desires. In this case, the impact of product's properties on the perceived brand name value of the selected product has been determined. By the term 'product properties’ the properties that directly relate to the product were denoted: its appearance, taste, shape, practicability and quality of raw materials. In the context of the presented model the impact of the product properties on the perceived value of its brand was investigated by the hypothesis H4.
Hypothesis 5 (H5) states that quality promotion has a positive impact on the perceived brand name value. Results of research performed by authors who studied correlations between promotion and the perceived brand name value, show a positive impact of promotion on the perceived brand name value (Boulding et al., Reference BOULDING, LEE and STAELIN1994; Yoo et al., Reference YOO, DONTHU and LEE2000; Johnson, Reference JOHNSON1984; Maxwell, Reference MAXWELL1989; Simon and Sullivan, Reference SIMON and SULLIVAN1993; Aaker and Jacobson, Reference AAKER and JACOBSON1994). Promotion influences the perceived brand name value by strong positive, unique associations that establish brand in the customer's memory (Keller, Reference KELLER1998). Promotion relates to important external information that customers receive in connection with the selected product and that signals the product quality. A direct correlation between promotion and the perceived value of a product's brand was checked.
conceptual model
Based on the literature, within the scope of product and the marketing mix development, the COO and the perceived value of a product's brand, together with the research – expert work consideration in the management of the selected product brand for a chicken product, the conceptual model of the relations, schematically shown on the Figure 1, was designed.
The schematic drawing of the hypothesis and the conceptual model.

Testing and verifying the correlation model
questionnaire and sample
Data for quantitative research were collected by a structural questionnaire. The questionnaire, which was used in interviews, was selected regarding the method of implementation. The respondents were interviewed by a personal interview in the field. Prior to carrying out the main survey, the questionnaire was tested by a smaller sample (N=50) and modified accordingly. By doing so, this avoided potential errors in measurements and allowed the formation of a clear and comprehensible questionnaire. The questions were selected by the Likert scale. Respondents were asked to select one of the seven answers that specified their level of agreement to statements, where score 1 signalled strong disagreement with the statement and a score 7 indicated strong agreement with the statement.
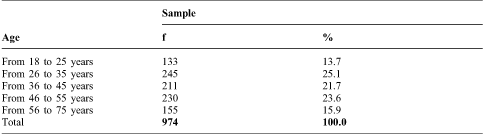
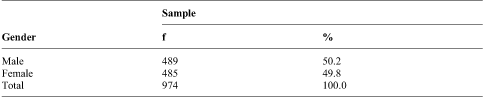
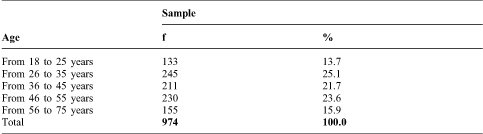
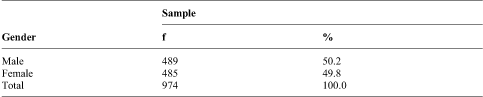
A stratified sample of the quantitative research, N=974, represented the inhabitants of the EU member state (Slovenia), aged 18 to 65, and who use the tested chicken product at least once a month and were familiar with the brand name. The sample was stratified by place of residence, gender and age. Regarding the selection method, the sample was classified as a three-stage, proportional and stratified sample. In the first sampling stage streets were selected randomly, based on the register of spatial units at The Surveying and Mapping Authority. The selected streets represented sampling points of the first level, where sample representativeness regarding relaying and type of a built-up area was assured. Based on the sampling points of the first level households, sampling points of the second level were selected by a method for random selection called the ‘random route method’. In selecting the final respondents (the third level) a quota regarding gender and age, based on the data obtained from the population register was considered. Each sample was representative regarding age, gender, region and type of built-up area. The elimination criteria were additionally used for all the selected respondents of the third level. Those respondents not familiar with the brand were eliminated, so that the final sample was consisted only of the respondents, familiar with the brand name and using the tested product at least one per month. The additional criteria were used, because the key survey questions were related to product's brands. At the 95% reliability level the standard error of the N = 974 sample was +/- 2,1 percentage points at the most. In the Tables 1and 2 the sample composition regarding age and gender is represented.
The structural distribution of the sample by age.
The structural distribution of the sample by gender.
research methods
The key data properties are expressed by descriptive statistics. In the case of interval data, parametric statistics were used; average, standard deviation and variance. The linear relationships between the selected variables were determined by a correlation coefficient. The majority of the presented hypotheses H1A, H2, H3, H4, H5 were tested by the structural models and the statistical programme LISREL. T-tests were used to determine whether the correlations between the latent variables were significant or if the latter held for the studied population and not only for the studied sample respectively (when the absolute values were| t| > 1,65) and various tests were used to determine the extent to which the model suited the data: RMSEA (root mean square error of approximation), NFI (normed fix index), CN (critical N), RMR (root mean square residual), GFI (goodness of fit index) were also used. The hypothesis H1B was tested by t-test for one sample (one sample t-test). This test was used to determine whether the sample averages were statistically significantly different (two-way test) or significantly larger respectively (one-way test) from the population value three. Namely, the population value three represented the middle of the 1 to 5 scale that was used to measure the questions relating to the hypothesis H1B. In the case when the statistical significance of the t-test was smaller than 0.05 (one-way test) or 0.025 (two-way test) respectively it was possible to make conclusions (with alpha risk =5%) for the population.
Exploratory factor analysis was used to determine whether certain common factors existed that could be used to explain how the COO and the selected elements of the product marketing mix influenced the perceived value of product brand. The aim of the analysis was to determine whether the correlations between the studied variables could be explained by a smaller amount of indirectly studied variables or factors. In the factor model, presumptions (a normal distribution of variables, Bartlett test of sphericity and Kaiser-Meyer-Olkin measure of sampling adequacy) were tested first. Since it was determined that all presumptions were met, in the next step, the exploratory factor analysis by a method of principal axes (PAF – Principal Axis Factoring) was used. The suitable number of factors was checked by a screen diagram, while disturbing indicators were excluded by the use of the communalities. Whether the factors explained a sufficiently large proportion of the latent variables was checked. A pattern matrix was used to determine which indicators matched individual latent variables. The principal axis method was used for determining more indicators (latent variables) that all had relatively similar explanatory value (explained variance). The Oblimin rotation showed that the indicators were pure enough, meaning that a certain indicator was not important for two latent variables. Reliability of the indicators or the latent variables respectively was tested by the Cronbach Alpha test. It should be noted that more indicators in an individual variable and/or higher a correlation among the indicators mean higher value of the reliability coefficient Cronbach's alpha.
For the conceptual model, correlations and the hypotheses H1A, H2, H3, H4 and H5 were tested by a linear structural equation modelling. By doing so, the conformity of the theoretical conceptual model with the empirical data was tested.
structure model testing by the Linear Structural Equation Modelling
The conceptually formed structural model of the correlations between the COO and the perceived brand name value was evaluated by the statistical program LISREL used for the linear structural equation modelling. Mutual relations of several factors were tested in the same time. In this manner, the quantitative methods were used to determine how strong and the manner in which (indirect and direct correlation) individual factors in the model of the perceived brand name value are connected among them. Identification of factors having an impact on the perceived brand name value and how strong these impacts were was conducted.
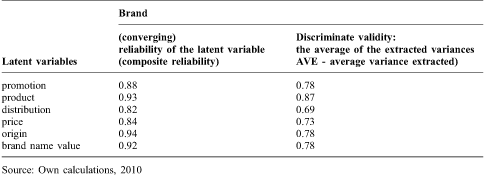
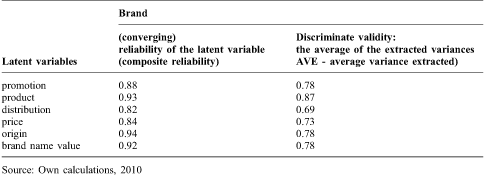
In the conceptual model the following latent variables were identified as independent (exogenous) variables: good advertisements (promotion), good product (product), wide assortment on retail shelves (distribution), good price (price) and importance of the COO (origin). The value of the brand was identified as a dependent (endogen) variable. The reliability of the latent variables was tested by the structural modelling, using the Fornell-Larcker (Fornell and Larcker, Reference FORNELL and LARCKER1981) rule that together with the composite or the converging reliability of latent variables respectively measures a discriminatory validity of latent variables by using average variance extracted (AVE). In the continuation the calculations for the both statistical analyses are presented (Table 3), but it must be emphasized that the converging reliability of the latent variable is larger than 0.6 and the average of the eliminated variances is larger than 0.5. The estimated statistics were larger than the recommended values, so it was concluded that the measuring instrument used for measuring the latent variables was reliable, convergent and discriminatory valid.
Reliability and discriminate validity of the latent variables for the tested product.
Source: Own calculations, 2010
Based on the calculations presented in the Table 3 it was concluded that the structural model was reliable regarding the presented statistical criteria (in the case of multiple measuring) and valid (regarding the theory or regarding which indicators measure the selected latent variables, respectively).
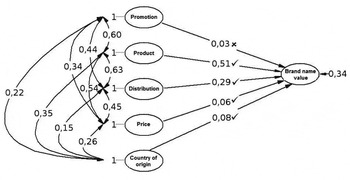
In the continuation relationships in the structural model for the product of the selected brand are presented, where latent variables are presented by ellipses. The correlation strength is presented by arrows between the ellipses. An exception is the arrow on the far right end with a value of 0.34, which represents the unexplained variance of the variables of the perceived brand name value. This is a part of the variance of the perceived brand name value, which cannot be explained by the variables on the left side of the picture. The independent latent variables; promotion, product, distribution, price and origin, explain 66% of the variability of the perceived value of the brand.
Beside by evaluation with the explained variance, the structural models could be evaluated with respect of some other statistical criteria (RMSEA, NFI, CN, RMR, GFI). There are many evaluation criteria, but it is hard to say which one the most suitable. Therefore in the continuation the selected criteria were presented, where based on the all presented criteria, it is possible to determine that the model fits the data relatively well. That is to say: RMSEA=0.077 (if <0.080, the model is relatively good), NFI=0.97 (if it is close to 1, then the model fits the data), CN=186 (this value should be above, 200 to fit well, but it is relatively close to, 200), std. RMR=0.039 (it should be below 0.050 to fit well), GFI=0.93 (it should be above 0.90 to fit well).
Because the presented structural model for the tested brand on the Figure 2 fit the data well, a content of the structural model or relations between the latent variables can also be analysed. The left side of Figure 2 shows that the elements of the marketing mix are very connected among themselves (promotion, product, distribution and price). The smallest connection strength is 0.34. Among all the mentioned elements of the marketing mix, the connection with the origin is the strongest for the product (0.35) and the price (0.26) and slightly less strong for promotion (0.22) and distribution (0.15).
The right side of Figure 2 shows that product (0.51) and distribution (0.29) had the largest impact on the perceived value of a brand. The other marketing elements had a slightly smaller impact, where the COO had a slightly larger impact (0.08) than price (0.06) and promotion (0.03). The relatively small impact of promotion on the perceived brand name value was understandable, because the tested brand was already well-established, mature and respected. In established and mature brands, as in this case, promotion has a positive impact on sales. However, it was assumed that the latter cannot have a significant influence on the value of the brand itself, which is already relatively high.
The structural model of the relations for the tested brand. Criteria of the model's reliability: RMSEA=0,077, NFI=0,97, CN=186, std. RMR=0,039, GFI=0,93 Source: own calculations, 2010

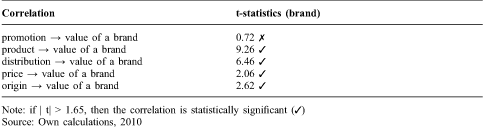
Based on the presented results for the studied brand it can be determined that, although the COO does not have the strongest impact on the perceived value of the brand, it is still not negligible and is even slightly stronger than the impact of price and promotion. It is important to mention that all the relationships in the structural model for the brand were statistically significant at | t| > 1.65, only the correlation between promotion and the perceived brand name value was not significant (H5) (Table 4).
Statistical calculations of the t-test for the tested brand.
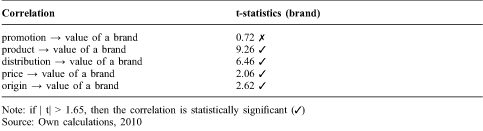
Note: if | t| > 1.65, then the correlation is statistically significant (✓)
Source: Own calculations, 2010
the results of the main hypothesis testing and the hypothesis researches
Based on the results presented in the structural model of the relations for the studied brand it was determined that the COO significantly influences the perceived brand name value. In the studied brand, the impact of the COO on brand name value was weaker than the impact of product and distribution. In spite of that, the impact of the brand's origin on the perceived value of this brand was stronger that the impact of price and promotion. Based on this stated fact, the main hypothesis of the research was confirmed, because the impact of the COO on the perceived brand name value was at least equal in significance to the impact of the selected elements of the product marketing mix.
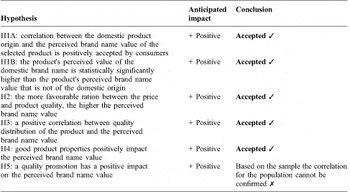
Based on the research results, it was determined that relationships exist in the structure model between the latent variables, which are significant at| t| > 1.65. Therefore the assumed hypotheses, analysed in the continuation as stated in the Table 5, were confirmed.
Hypothesis testing.
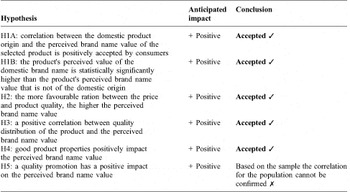
The performed statistical analyses confirmed the hypotheses H1A, H1B, H2, H3 and H4. The hypothesis H5 cannot be confirmed as conclusions for population based on the sample could not be made. All conclusions are based upon the presented structural model from Figure 1 and the statistical significance of the t-test, which had a value of | t| >1.65. This figure demonstrates more than 95% certainty of the conclusions made for population based on the sample.
Topics and recommendations for the future researches
The results of the survey make an important contribution to the understanding of relationships among the marketing elements, the COO and the perceived brand name value. There remain many open topics and recommendations required for future research, so here only the most obvious ones will be emphasised.
A handicap of the performed research is that the study included only one food product, namely a chicken product, therefore the results cannot be generally applied to all food products. In future it would be interesting to study relations among the marketing of product, the COO and the perceived brand name value by including larger number of products of a similar source or type and to determine whether the generally accepted rules of the perceived value hold for all products.
The survey was limited to studying correlations between the selected elements of product marketing. Only the simplified 4P concept was chosen: product, promotion, distribution and price. In the future the other marketing elements of products, e.g. quality, packaging, should be included in researching. This would help in studying relationships between the broader marketing and the perceived value of the product brand and to determine whether generally accepted rules for the correlations between product marketing and the perceived brand name value hold.
The selected brand that was studied in our research is produced in three different countries (Croatia and Bosnia and Herzegovina, as well as Slovakia) with the identical form and packaging and is based on the same technology. In the survey, consumer preference for the products of the same brand, manufactured in the homeland and in the foreign countries, were analysed. In future, product preference for all the three countries, where the product is supplied from, should be checked. This would enable generalisation of results on the entire market in the region.
In spite of limitations in the research, the survey conducted helped the perceived brand name value to be understood more deeply and to enlighten the relations among the COO, the marketing mix elements of products and the perceived value of the product's brand.
Conclusions
The issues studied in the survey were based upon determination of the relations among the COO, the marketing mix elements of the chicken product and the perceived brand name value of the chicken product. More and more companies, mainly in the more developed economies, recognise the importance that product value and product brand have for customers. This is why it is important to determine, as precisely as possible, values of their products and brands. This can create an important competitive advantage over other companies that are not familiar with values that their products and brands have for consumers.
In the research a statistical program for modelling by linear structural equations was used to evaluate the theoretically and conceptually formed structural model of the relations between the COO and the perceived brand name value. It was determined that the COO has at least equally statistically significant influence on the perceived brand name value of the product than the selected marketing mix elements of the product. Based on the presented results the assumption that the COO is a variable, which in the process of forming a strategy of brand management should not be overlooked by the management, can be confirmed. It is recommended that, in brand management, the COO is equally carefully considered as forming and development of new products, planning of marketing routes (distributions), promotion and price forming. The specificity of mass consumables should be considered at the same time.