



I. INTRODUCTION
Synthetic calcium phosphate ceramics (CaP) are widely used for the treatment of large bone defects because of their chemical similarity to the mineral part of bone (Döbelin et al., Reference Döbelin, Luginbühl and Bohner2010). Besides the various compositions of apatite [hydroxyapatite (HA), carbonate apatite, chloroapatite, and fluorapatite], which is the crystalline phase of bone mineral, a large number of other CaP phases exist in the CaO–P2O5 system (Welch and Gutt, Reference Welch and Gutt1961; Elliott, Reference Elliott1994). The chemical variation among these CaP phases is mostly found in the Ca:P molar ratio and the presence or absence of H+, OH−, or H2O groups. However, the physico-chemical properties of the different phases such as thermodynamic (Chow, Reference Chow, Chow and Eanes2001; Raynaud et al., Reference Raynaud, Champion, Bernache-Assollant and Thomas2002a) and kinetic (Dorozhkin, Reference Dorozhkin2002) characteristics, or the reactivity with H2O (Dorozhkin, Reference Dorozhkin2011), can differ vastly. Some of these properties are of particular interest for medical application of CaP materials, for example as a substitute for bone grafts (Bohner et al., Reference Bohner, Galea and Doebelin2012), because they determine the biocompatibility and resorption characteristics of a CaP device after implantation in the human body. Despite the minute chemical variations, major differences in crystal structure topologies are usually evident, which in turn means that CaP phases can be relatively easily identified by their crystal structure. For that reason powder X-ray diffraction (XRD) is one of the most common techniques to identify and quantify CaP phases or mixtures thereof.
Crystalline phases are identified from XRD patterns by comparing the angle of diffraction peaks with reference positions stored in a database. However, much more information on the crystal structures and phase quantities can be obtained by analysing the pattern with Rietveld refinement (Rietveld, Reference Rietveld1969; Dinnebier and Billinge, Reference Dinnebier and Billinge2008; Madsen and Scarlett, Reference Madsen, Scarlett, Dinnebier and Billinge2008), a process iteratively matching the calculated diffraction pattern of a set of crystal structure models to a measured pattern. This technique allows obtaining precise phase quantities, unit-cell dimensions, and crystallite sizes, and sometimes also atomic coordinates, ionic substitutions, stress and strain, and thermal vibration parameters. Rietveld refinement marks the current state-of-the-art of powder XRD data processing. However, as many complex analytical techniques, it requires skilled personnel, well-calibrated equipment, and very careful sample preparation. In practical use, the operators processing XRD data with Rietveld refinement are faced with two major problems: (1) Owing to the iterative data processing, a common problem is to determine the quality of a refinement and to recognize whether a refinement has converged or allows further optimization. If a refinement is considered complete even though more information could be extracted from the data, then the dataset is underprocessed. (2) On the other hand, refining more parameters than the data quality permits may lead to arbitrary results or unstable refinements. In that case, the data are overprocessed. The progress and convergence of a Rietveld refinement employing a strategy with a reasonable number of free parameters on datasets obtained from highly crystalline phases can usually be followed by goodness-of-fit parameters and the straightening difference curve. However, in case of problematic samples with a large number of phases, severe peak broadening, texture, an amorphous signal in the background, or fluorescence, even experienced users may struggle to determine a robust refinement strategy and thus find themselves in doubt of the validity of the results.
While experienced users often learned to spot and avoid data over- and underprocessing, less experienced users would greatly benefit from a complementary technique to verify their refinement results. However, several other techniques may provide similar results, but the differences are important enough to render direct comparisons impossible. Solid-state vibrational [Fourier transform infrared spectroscopy (FTIR), Raman] and absorption spectroscopies (NMR) provide short-range order information, but no long-range structural order. Phase quantifications in the presence of X-ray amorphous or nanocrystalline phases can therefore differ vastly from powder XRD results. Electron backscatter diffraction/selected area electron diffraction (EBSD/SAED) and single-crystal XRD do not interact with large sample volumes and cannot be used to quantify phases in multi-phase powder samples. Neutron diffraction is often not accessible for small institutions or independent laboratories. And last but not least none of the chemical analyses [X-ray fluorescence (XRF), energy-dispersive X-ray spectroscopy (EDX), inductive coupled plasma (ICP), AAS, and others] provide structural information and can be used to identify polymorphs.
XRD has become one of the standard tools in the field of CaP biomaterials research because of its ready availability and its potential to discriminate CaP phases even in complex mixtures. The majority of publications in this field of research feature phase identifications from peak positions. However, in the past decade the number of publications using Rietveld refinement for quantitative phase analysis has been constantly increasing. Several groups specifically addressed the accuracy of Rietveld refinement for CaP phase analysis and compared it to reference mixtures and conventional quantification methods. A significant step towards higher accuracy in HA and β-tricalcium phosphate (β-TCP) phase quantification in biphasic samples was already achieved by the use of a digital diffractometer instead of a powder camera, as shown by Toth et al. (Reference Toth, Hirthe, Hubbart, Brantley and Lynch1991), who improved the quantification based on reference intensity ratio (RIR) calibration curves from a 20 wt% range to a 3 wt% range by a change of instrument. Keller (Reference Keller1995) determined the HA and β-TCP phase content of commercially used binary mixtures by RIR quantification (single-peak analysis) and Rietveld refinement. The calibration curve for RIR quantification was established beforehand for the two strongest peaks HA 211 and β-TCP 20–10. HA phase quantities determined by Rietveld refinement were systematically higher by 2 ± 1 wt% than the results determined by RIR quantification. The author pointed out that single-peak-based analyses are inherently sensitive to insufficiently ground samples and textured sample surfaces, whereas the full-pattern-based approach of Rietveld refinement reduces the weighting of individual peak errors and allows for modelling of texture. In a similar study Raynaud et al. (Reference Raynaud, Champion, Bernache-Assolant and Laval2001) prepared reference mixtures to establish a calibration for phase quantification by RIRs for biphasic mixtures in the systems β-TCP–HA and HA–CaO. They determined a maximum absolute uncertainty for β-TCP and HA phase quantities of 3.5 wt% for mixtures of 50:50 wt%. Uncertainties for other mixtures were generally lower, reaching 0.5 wt% for nominal β-TCP and HA fractions of 5 wt%, respectively. Rietveld refinement was performed for comparison, and a systematic overinterpretation of β-TCP up to 6 wt% was observed in several compositions. Better agreement between reference mixtures and Rietveld refinements was observed by Reid and Hendry (Reference Reid and Hendry2006). In a series of reference samples containing three CaP phases (α-TCP, β-TCP, and HA) a maximum difference between nominal and refined phase quantities of 1.4 wt% was determined.
Biphasic materials containing stoichiometric HA and β-TCP can either be mixed from pure components, or prepared by thermal treatment of Ca-deficient HA (CDHA, Ca10−x (HPO4) x (PO4)6−x (OH)2−x ). Mixing two components gives full control over the bulk phase composition, but it bears the risk of inhomogeneous blending leading to a residual risk for phase fluctuations among individually sampled specimens. On the other hand, thermal treatment of CDHA is a simple but effective way to obtain materials with a homogeneous HA and β-TCP phase distribution, though the material usually reveals its precise phase composition only after the calcination because of the extraordinary sensitivity to variations of the bulk molar Ca:P ratio. The process of CDHA decomposition above a critical temperature has been described many times in the past (Riboud, Reference Riboud1973; Ishikawa et al., Reference Ishikawa, Ducheyne and Radin1993; Raynaud et al., Reference Raynaud, Champion, Bernache-Assolant and Laval2001; Reference Raynaud, Champion, Bernache-Assollant and Thomas2002a; Reference Raynaud, Champion and Bernache-Assollant2002b; Wilson et al., Reference Wilson, Elliott, Dowker and Rodriguez-Lorenzo2005; Nilen and Richter, Reference Nilen and Richter2008; Tõnsuaadu et al., Reference Tõnsuaadu, Gross, Plusuma and Veiderma2012). The onset of the separation was reported to occur at 700 °C (Nilen and Richter, Reference Nilen and Richter2008), 800 (Jackson et al., Reference Jackson, Barralet and Wright2004), 850 (Tõnsuaadu et al., Reference Tõnsuaadu, Gross, Plusuma and Veiderma2012), and 900 °C (Wilson et al., Reference Wilson, Elliott, Dowker and Rodriguez-Lorenzo2005). According to Tõnsuaadu et al. (Reference Tõnsuaadu, Gross, Plusuma and Veiderma2012), dehydroxylation of HA begins at 850–900 °C, the precise temperature depending on the humidity of the atmosphere. Gopal and Calvo (Reference Gopal and Calvo1972) presented evidence that the naturally occurring mineral whitlockite transforms into the structure of β-TCP upon heating at or above 900 °C. The β-TCP phase formed by decomposition of CDHA at 900 °C or above is therefore expected to exhibit space group R3c of the ideal β-TCP structure for β-Ca3(PO4)2, both in absence (Dickens et al., Reference Dickens, Schroeder and Brown1974) and presence of Mg contamination (Schroeder et al., Reference Schroeder, Dickens and Brown1977).
As Rietveld refinement becomes more widely accepted and used by research groups with less expertise in XRD in general and Rietveld refinement in particular than the studies described above, the question of how accurate and precise refinement results of such groups are arises. Interlaboratory studies (ILS, round robin) are a common strategy to validate results from analytical procedures lacking a complementary method for verification. In the present study, we report the results of an ILS for phase quantification of CaP powders by powder XRD and Rietveld refinement, in which 12 laboratories from six European countries participated and contributed datasets from 26 different instruments. The ILS and statistical data evaluation were conducted strictly according to ASTM E691 – 13 (2013).
II. REFERENCE MATERIAL
A. Description
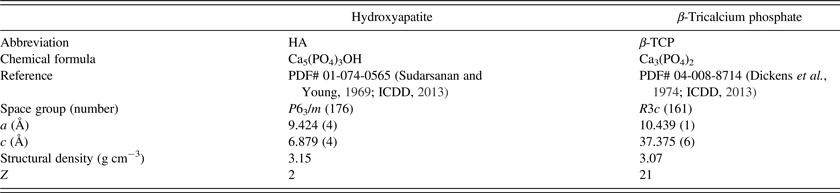
The reference sample contained two high-temperature phases commonly used in bone graft substitutes: HA [Ca5(PO4)3OH] and β-TCP [β-Ca3(PO4)2] (Table I). HA impurities in β-TCP samples and vice versa are realistic and common scenarios, which are caused by minor mismatches of the molar Ca:P ratio, and therefore particularly addressed in international standards specifying the phase purity of CaP bone graft substitutes (ASTM F1185 – 03, 2003; ASTM F1088 – 04, 2004; ISO 13779-3, 2008; ASTM F2024 – 10, 2010; ISO 13175-3, 2012). Based on published information on the thermal stability of CDHA and its decomposition into stoichiometric HA and β-TCP at elevated temperatures, it was decided to prepare a reference material by thermal treatment of a CDHA precursor at 900 °C. This procedure was seen as a compromise between inducing separation into stoichiometric phases, recrystallization, annealing, and a moderate amount of grain growth, without increasing the risk for HA dehydroxylation and excessive grain growth. Larger grains and sintering of agglomerates would have made intense milling a necessity for XRD sample preparation and thus made the samples prone to the formation of amorphous fractions, or microabsorption effects biasing the result of phase quantifications. On the other hand, the as-obtained reference material was essentially free of preferred orientation, microabsorption effects, micro strain, amorphous content, and nanocrystalline particles.
Crystallographic information for the HA and β-TCP structure models disclosed to the participants at the beginning of the study.
B. Preparation and characterization
Approximately 200 g of a commercial Ph. Eur. grade CDHA powder (Calipharm T 118 BP, Item No. 12714-330, Batch B00217A, Brenntag Schweizerhall AG, Switzerland) were annealed by thermal treatment for 12 h at 900 °C in a sinter furnace (CDF 15/1B, Carbolite, Hope Valley, England), which initiated decomposition into stoichiometric β-TCP and HA. Since the two primary phases were not mixed from pure materials but formed by thermal decomposition of a homogeneous single-phase precursor, a precise true value for the phase composition was not known at the time of powder preparation. However, the preparation route had the advantage of very homogeneous phase distribution, as the two phases formed in situ homogeneously throughout the bulk of the material, and particle separation or incomplete homogenization could be expected to be negligible.
Scanning electron microscopy (SEM) images showed agglomerates of several micrometres in diameter (Figure 1). Despite considerable fusion caused by the thermal treatment, it was still evident that the agglomerates were formed by sintered primary particles of less than 1 μm in diameter. The agglomerates were of irregular shape and their primary particles were randomly oriented. The micrographs suggested that no tendency for preferred orientation was to be expected from this material. The crystallite size, which can only be smaller or equal to the primary particle size, was well below the critical size of approximately 5 μm that is required for non-spotty diffraction patterns (McCusker et al., Reference McCusker, Von Dreele, Cox, Louer and Scardi1999). In this size range microabsorption effects are largely irrelevant, particularly among phases with similar linear absorption coefficients. A moderate amount of diffraction peak broadening because of small crystallite size was expected, though.
(Color online) Example refinement showing the overall complexity of the diffraction pattern. The enlarged section from 25° to 35° 2θ shows the contributions of β-TCP and HA in the range of strongest intensity, featuring the 100% β-TCP (0 2 10) peak at 31.02° 2θ and the 100% HA (2 1 1) peak at 31.77° 2θ. SEM image inlays show the particle and agglomerate morphology of the reference powder.

The particle size distribution measured by laser diffraction (Beckman Coulter LS 13 320, Krefeld, Germany) after ultrasonication in ethanol confirmed the results observed on SEM images. The mean particle size by number was 204 nm and the median was 181 nm. A low number (but large volume) of particles between 1 and 20 μm was observed. Based on SEM images, this signal was interpreted as agglomerates not completely disintegrated by ultrasonication. These chunks of randomly oriented primary particles were unlikely to cause spottiness, orientation effects, or phase inhomogeneities in XRD patterns because of the random arrangement of primary particles within the agglomerates.
Trace elements were identified and quantified by ICP–mass spectroscopy (ICP–MS; Perkin Elmer ELAN 6000, USA) on supernatant samples diluted 1:100 in 2% HNO3 solution (HNO3, 70% purified by distillation, No 225711, Sigma Aldrich, Switzerland), calibrated using a global standard (No IV-ICPMS-71A, Inorganic ventures, USA). The main elements Ca and P were quantified in a second series using 1:10 000 dilution and standards for Ca (No 19051, Sigma Aldrich, Switzerland) and P (No 38338, Sigma Aldrich, Switzerland, 38338). Results of the analysis are shown in Table II. The strongest contamination was found to be Mg (1353.8 ppm), which is an impurity commonly observed in CaP phases. The compatibility of Mg with the HA lattice is relatively low (Neuman and Mulryan, Reference Neuman and Mulryan1971), while at the same time it is high with the β-TCP lattice (Schroeder et al., Reference Schroeder, Dickens and Brown1977; Enderle et al., Reference Enderle, Gotz-Neunhoeffer, Gobbels, Muller and Greil2005). The Mg impurity could therefore be expected to mainly accumulate in the β-TCP phase and substitute up to 2.05% of all Ca atoms. According to Enderle et al. (Reference Enderle, Gotz-Neunhoeffer, Gobbels, Muller and Greil2005) this amount of substitution was expected to lead to shrinkage of the β-TCP unit cell by 0.22% (a-axis) and 0.11 % (c-axis), respectively. The bulk molar Ca:P ratio calculated from the elemental analysis was 1.657 (±0.061). Calculating an expected phase ratio and propagating the standard deviation to phase quantities resulted in a standard deviation of 34 wt% for β-TCP, and 41 wt% for HA phase content. Chemical quantification of Ca and P was therefore not precise enough to verify the phase content determined by XRD because of the extraordinary sensitivity of the β-TCP:HA phase ratio for the bulk molar Ca:P ratio.
Results of the trace element analysis. All values are given in ppm. Values below 2.0 ppm were omitted.

III. PROTOCOL AND PARTICIPANTS
To obtain comparable results, the participants were instructed (i) not to apply any mechanical treatment such as milling or sieving to the reference powder prior to data collection, and (ii) not to use any sample preparation or instrument setting specifically optimized for the ILS. Statistical results were supposed to represent standard measurement conditions rather than best-case scenarios. Five datasets from independently prepared samples were requested. The main phases β-TCP and HA were disclosed prior to data collection, and structural models for both phases (Sudarsanan and Young, Reference Sudarsanan and Young1969; Dickens et al., Reference Dickens, Schroeder and Brown1974) were suggested, but not required to use. This information was provided for the participants’ convenience and to allow those less familiar with the CaP phase system to focus on the refinement procedure rather than on phase identification. But all participants were free and encouraged to use whatever structure model they preferred, and to employ whatever refinement strategy they considered appropriate. They were asked to report values for phase quantities, unit-cell dimensions, and crystallite sizes determined by Rietveld refinement from all five datasets. Anonymous codes were assigned to each set of results, using capital letters A to L for the laboratory, and Roman numerals I to IV for instruments, as many laboratories provided datasets from more than one instrument.
IV. STATISTICAL ANALYSIS
The statistical evaluation of all refined parameters was conducted according to ASTM E691 – 13 (2013). In a first step, average values and standard deviations were calculated for each configuration from the five individual reported values. In accordance with ASTM E691 – 13, these results were called the “cell average”
 $\bar x$
, and “cell standard deviation” s, with the term “cell” being equivalent to “instrument” in this study. The average calculated from all cell averages
 $\bar x$
was called the “average of cell averages”
 $\overline{\overline x} $
, and the standard deviation of all
 $\bar x$
scattered around was called the “standard deviation of cell averages”
 ${s_{\bar x}}$
. The latter were calculated from laboratory instrument datasets only. The datasets submitted by laboratories K and L using synchrotron radiation were ignored to obtain precision statements relevant for laboratory instruments. Calculations of repeatability standard deviation s
r
and reproducibility standard deviation s
R
, as well as 95% repeatability and reproducibility limits r and R were performed according to ASTM E691 – 13 (2013) and ASTM E177 – 13 (2013). In addition to the statistical parameters specified in ASTM E691 – 13, we also present the average standard deviation
 $\bar s$
, which is the mean value of all cell standard deviations s.
To interpret the cell averages
 $\bar x$
and cell standard deviations s for each instrument configuration in the context of all contributed datasets, two consistency values were calculated: (1) the between-laboratory data consistency h; and (2) the within-laboratory data consistency k. Equations for both values can be found in ASTM E691 – 13. h consistency values express the ratio of the cell deviation
 $\bar x - \overline{\overline x} $
to the standard deviation of the cell averages
 ${s_{\bar x}}$
. The meaning of a consistent h value is to be read as “a cell average
 $\bar x$
does not deviate from
 $\overline{\overline x} $
more than expected”. Limits for consistency at the 0.5% significance level are tabulated in ASTM E691 – 13. k consistency values express the cell standard deviation s relative to the repeatability standard deviation s
r
. The meaning of a consistent k value is to be read as “the data in one cell does not scatter more than expected”. All equations and tabulated limits for k consistency at the 0.5% significance level are given in ASTM E691 – 13.
V. RESULTS
An example refinement of a dataset measured on a PANalytical CubiX3 diffractometer (PANalytical, The Netherlands) using graphite-monochromated CuKα radiation, and refined with BGMN (Bergmann et al., Reference Bergmann, Friedel and Kleeberg1998), is shown in Figure 1. The enlarged section shows the individual contributions of β-TCP and HA. The strong peaks of both phases were relatively well separated and only moderate peak broadening due to small crystallites was observed. Hence no excessive peak overlap was encountered.
Not all participants provided all requested parameters: (1) Laboratory K did not report refined unit-cell dimensions. Owing to the variable wavelength of synchrotron radiation, this participant refined the wavelength instead. (2) Laboratories B and K did not report crystallite sizes, because they refined the instrument resolution function instead. (3) Several laboratories only provided isotropic crystallite sizes for HA, whereas the majority of participants refined anisotropic HA crystallite sizes.
Some reported cell averages
 $\bar x$
or cell standard deviations s of the various refined parameters were clearly different from the majority of the reported values. However, none of these presumable outliers could be related to clerical, sampling, or procedural errors. Therefore, all values were used for the statistical calculations, and none were flagged as outliers. This decision was in accordance with the procedure laid out in ASTM E691 – 13 (2013). Repeatability standard deviation s
r
, reproducibility standard deviation s
R
, as well as 95% repeatability and reproducibility limits r and R are shown in Table III for all refined parameters.
Precision statistics of all refined parameters.
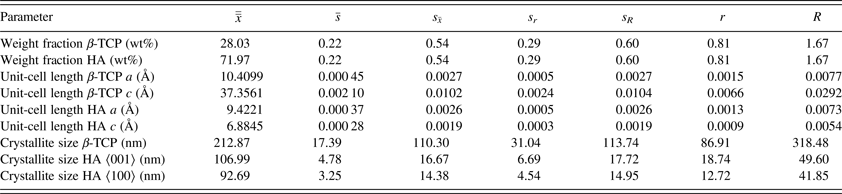
 $\overline{\overline x} $
, is the average of cell averages;
 $\bar s$
, the average cell standard deviation;
 ${s_{\bar x}}$
, the standard deviation of cell averages; s
r
, the repeatability standard deviation; s
R
, the reproducibility standard deviation; r, the 95% repeatability limit; and R, the 95% reproducibility limit.
A. Phase quantities
All participants refined two phases, β-TCP and HA, and normalized the sum to 100 wt%. No other phases were identified. Cell standard deviations s ranged from 0.05 to 0.83 wt% with a mean value of 0.22 and a median at 0.17 wt% (Figure 2). A t-test showed that many configurations reported phase quantities with a significant (p < 0.05) or highly significant (p < 0.01) systematic offset of
 $\bar x$
from
 $\overline{\overline x} $
. The 95% reproducibility limit R was 1.67 wt% (Table III). Between-laboratory consistency h of all instrument configurations was below the critical value h
critical = ±2.60. Only configuration A:IV approached, but did not exceed, the limit. However, the excessively high cell standard deviation s observed with configurations B:I and I:I resulted in within-laboratory consistency k exceeding the critical value k
critical = 1.88 (Figure 3).
Cell average values
 $\bar x$
and standard deviations s of refined HA phase quantities. Horizontal lines mark the average of cell averages
 $\overline{\overline x} $
(solid line) and standard deviations of cell averages
 ${s_{\bar x}}$
(dotted lines). Cell average values significantly different from the average of cell averages are labelled with *(p < 0.05) or **(p < 0.01).

Within-laboratory consistency k and between-laboratory consistency h statistics for refined HA phase quantity. Owing to normalization of the phase quantities, β-TCP consistency k was identical and h was inverse to the corresponding HA consistency parameters.

B. Unit-cell dimensions
Refined unit-cell parameters for HA and β-TCP are shown in Figure 4. Interestingly, the standard deviation of cell averages
 ${s_{\bar x}}$
of the β-TCP c-axis was 1.01 × 10⁻³ nm and hence clearly greater than
 ${s_{\bar x}}$
of all other axes, which ranged from 1.9 ×10⁻⁴ to 2.7 × 10⁻⁴ nm (Table III). Again, many configurations reported mean values
 $\bar x$
significantly (p < 0.05) or highly significantly (p < 0.01) different from the global average
 $\overline{\overline x} $
. The origin of the excessive offset obtained from configurations D:I and F:I could not be identified. In case of configuration K:I; however, the unit-cell dimensions were not refined because of correlations with the refined wavelength of the synchrotron radiation.
Cell average values
 $\bar x$
and standard deviations s of refined unit-cell dimensions. Horizontal lines mark the average of cell averages
 $\overline{\overline x} $
(solid line) and standard deviations of cell averages
 ${s_{\bar x}}$
(dotted lines). Cell average values significantly different from the average of cell averages are labelled with *(p < 0.05) or **(p < 0.01).

Configuration D:I exceeded the critical value for between-laboratory consistency for all unit-cell dimensions (Figure 5), whereas F:I unit-cell dimensions were consistent. Within-laboratory consistency was exceeded by a small margin by configurations C:I, C:II, I:II, and J:II, and by a large margin by the synchrotron configuration K:I for reasons mentioned above.
Within-laboratory consistency k and between-laboratory consistency h statistics for refined unit-cell dimensions.

C. Crystallite sizes
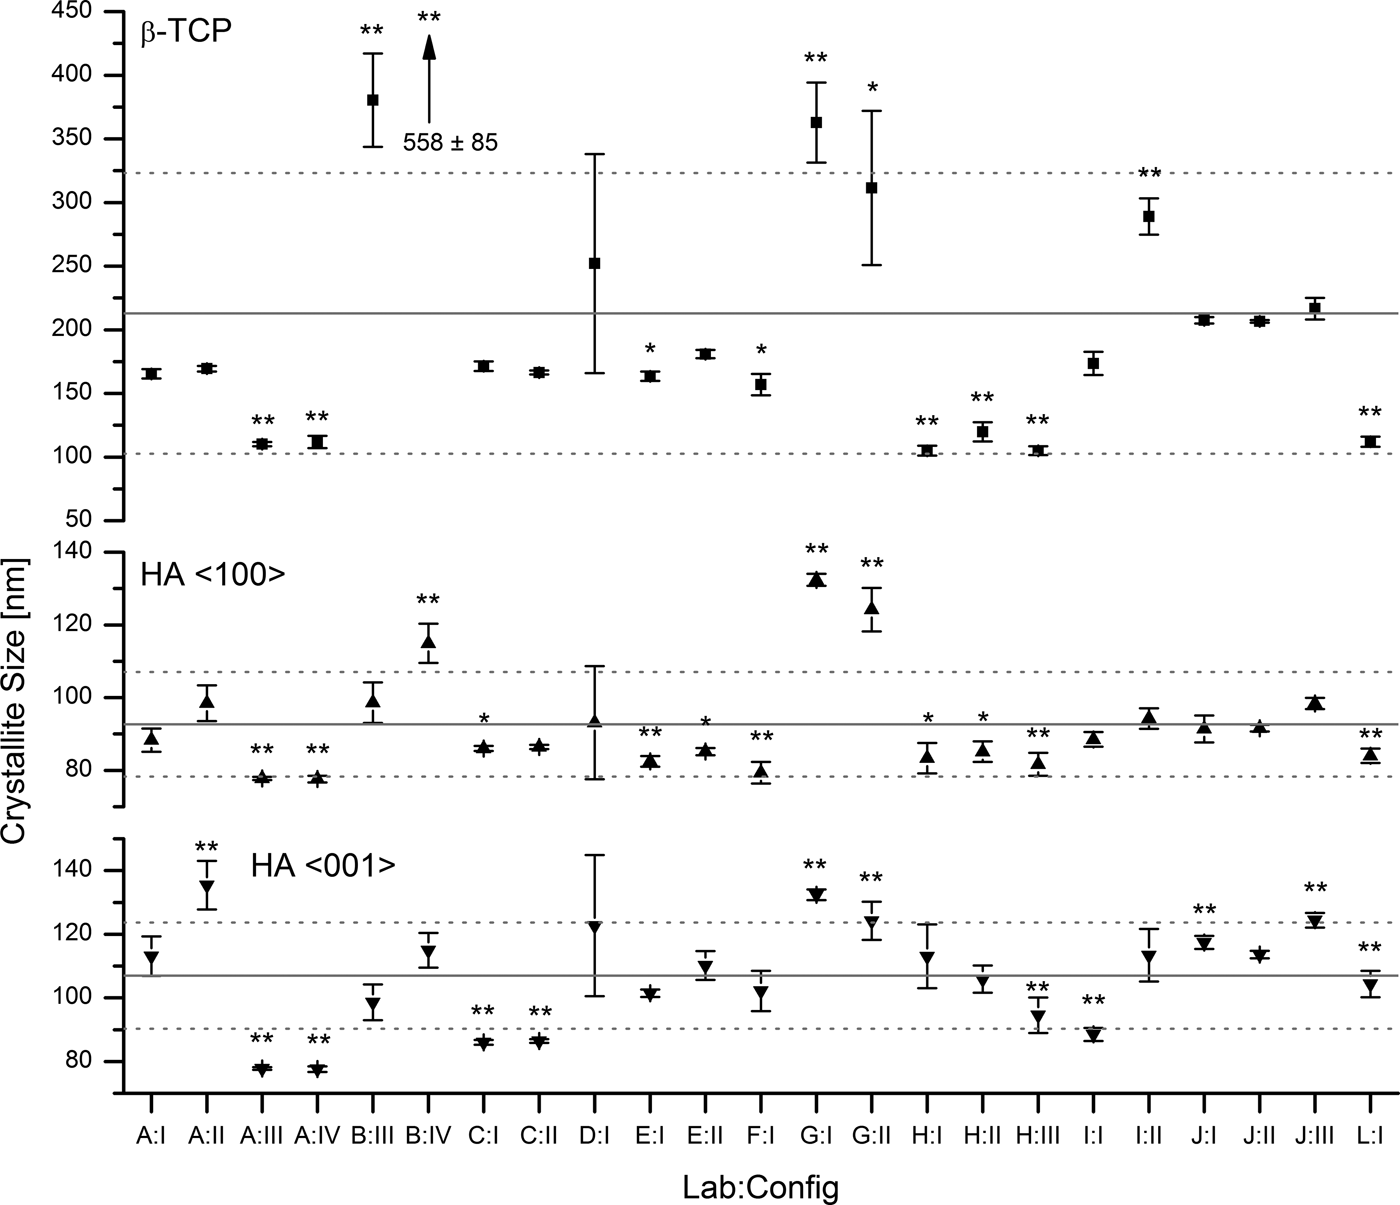
Three configurations out of 26 did not report refined crystallite sizes. Out of the other 23 configurations, 14 refined anisotropic and 9 refined isotropic HA crystallite sizes. For β-TCP only isotropic crystallite sizes were reported. Mean refined values are shown in Figure 6. The most prominent feature of this illustration is the excessively high scattering of refined β-TCP sizes reported by laboratories B, D, and G. The standard deviation of cell averages
 ${s_{\bar x}}$
was one order of magnitude greater than
 ${s_{\bar x}}$
of HA crystallite sizes in directions 〈100〉 and 〈001〉.
Refined crystallite sizes for β-TCP (isotropic, top), HA 〈100〉 (middle), and HA 〈001〉 (bottom). Horizontal lines mark the average of cell averages
 $\overline{\overline x} $
and standard deviations of cell averages
 ${s_{\bar x}}$
calculated from laboratory instruments A to J. No results were reported from configurations B:I, B:II, and K:I. Cell average values significantly different from the average of cell averages are labelled with *(p < 0.05) or **(p < 0.01).
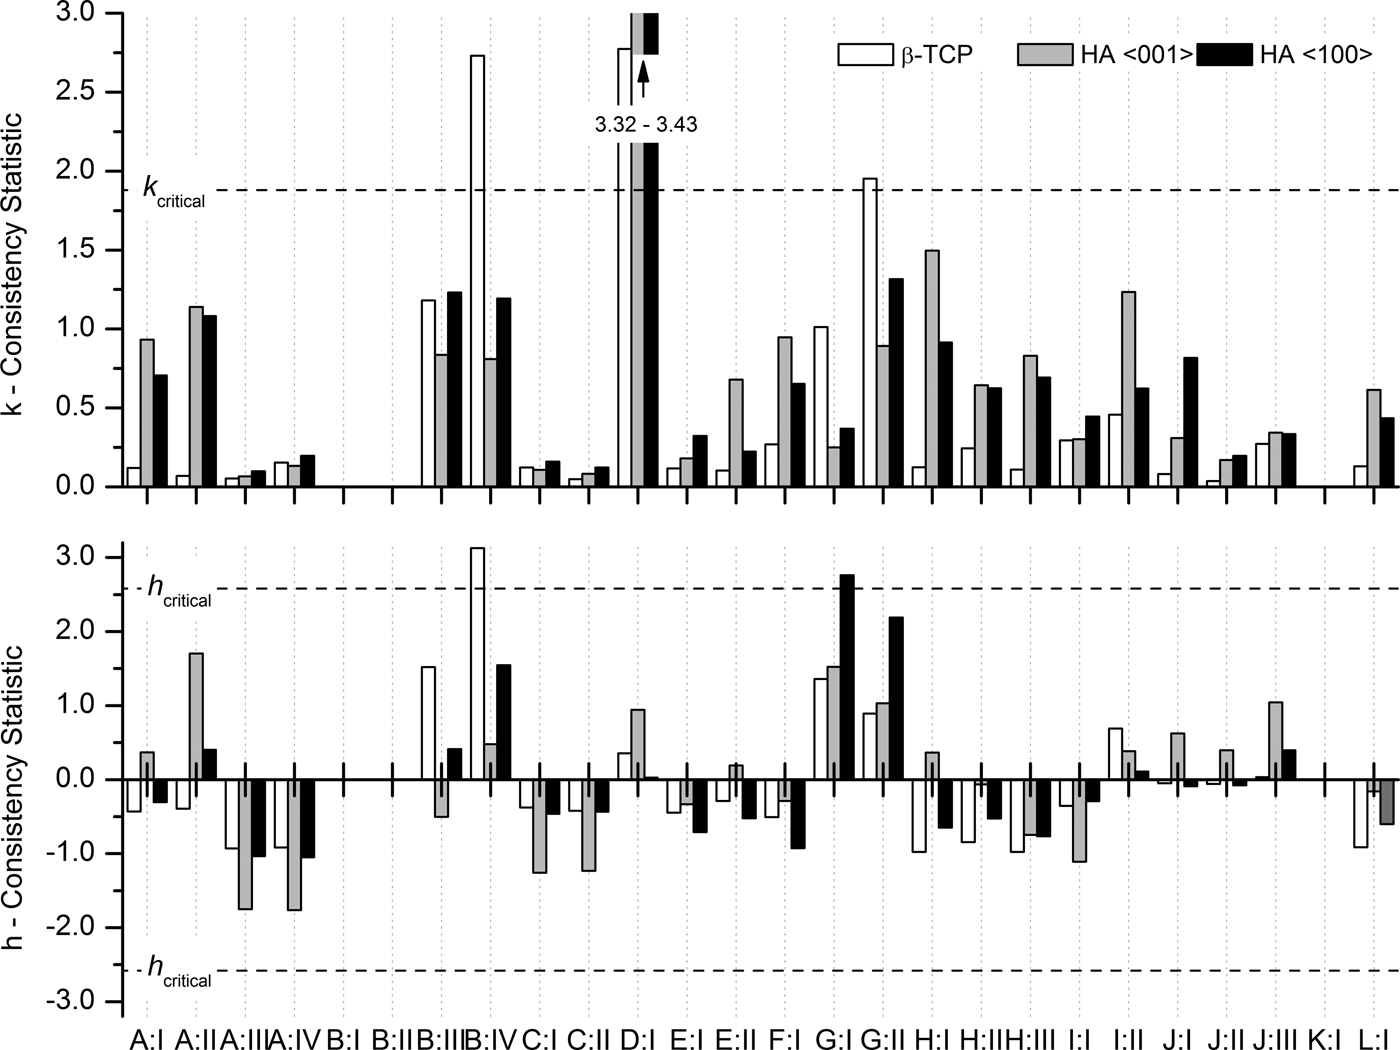
h consistency values for refined crystallite sizes expose two inconsistent results (Figure 7): Laboratory B:IV reported inconsistent β-TCP sizes, and laboratory G:I reported inconsistent sizes for HA in direction 〈100〉. All other laboratories reported crystallite sizes consistent with the average values. Within-laboratory consistency values k exceeded the critical limit for the following configurations: B:IV, D:I, and G:II. All other configurations reported consistent k values for refined crystallite sizes.
Within-laboratory consistency k and between-laboratory consistency h statistics for refined crystallite sizes.
VI. DISCUSSION
Most national and international standards specifying XRD and Rietveld refinement for the characterization of CaP biomaterials aim at identification and quantification of the crystalline phases. The precision estimate of refined phase quantities is therefore seen as the most relevant outcome of this study. The cell averages of the phase quantities
 $\bar x$
(Figure 2) reached a repeatability standard deviation s
r
= 0.29 wt%. However, the same figure also illustrates that 11 out of 26 datasets differed significantly from the average of cell averages
 $\overline{\overline x} $
. It has to be assumed that these datasets are systematically biased and increasing the number of repetitions would not suffice to eliminate the offset from the true phase quantities. Phase quantifications by XRD and Rietveld refinement clearly exhibit a substantial risk for systematic bias of data measured and processed under repeatability conditions. When measured and processed under reproducibility conditions, the standard deviation of phase quantities s
R
= 0.60 wt% was 2.07 times greater than the repeatability standard deviation s
r
. This ratio between repeatability and reproducibility conditions was remarkably similar to the results published by Stutzman (Reference Stutzman2005), who conducted an ILS on phase quantification of hydraulic cements. Even though Stutzman's reference sample was a more complex mixture of nine phases and the standard deviations were generally higher, the ratio between reproducibility and repeatability standard deviation was 1.84 and thus close to the value observed in this study.
Refined unit-cell dimensions
 $\overline{\overline x} $
(Table III) of the HA phase showed less than 0.1 % deviation from the reference structure (Table I). On the other hand, the refined dimensions of β-TCP were 0.24% (a-axis) and 0.13% (c-axis) shorter than the reference values. This correlates well with the shrinkage expected for 2.05% Mg substitution (Enderle et al., Reference Enderle, Gotz-Neunhoeffer, Gobbels, Muller and Greil2005) and confirms the previously mentioned assumption that Mg contamination (Table II) preferentially accumulates in the β-TCP phase. The shrinkage also explains a moderate shift of β-TCP diffraction peaks towards higher 2θ values (Figure 1). A statistical evaluation of refined unit-cell parameters exposed that the standard deviation of cell averages
 ${s_{\bar x}}$
was a constant fraction of the refined averages of cell averages
 $\overline{\overline x} $
(Table III). In other words, long cell dimensions resulted in greater standard deviations than short dimensions. The ratio
 ${s_{\bar x}}/\overline{\overline x} $
for all four refined axes was in the range from 0.026 to 0.028%. Lower absolute precision for larger unit-cell dimensions is not surprising, considering that large d values generate diffraction peaks at low 2θ angles. Datasets measured at constant sampling intervals in 2θ feature lower angular resolution at large d values because of the non-linear relation of d and 2θ. Low-angle resolution is further impaired by increased peak asymmetry and full width at half maximum (FWHM) towards low 2θ angles observed with most instruments.
Crystallite sizes were clearly the most critical parameters refined in this study, as numerous factors contribute to systematic errors of the results: a very precise mathematical description of the instrument resolution function is required to accurately deconvolute the crystallite size broadening effect from the instrument broadening. For software based on the fundamental parameters approach, the fundamental parameters must precisely describe the optical elements of the instrument, including all misalignments. At the level of refinement strategy, surface roughness, sample transparency, and micro strain may be misinterpreted as crystallite size-related peak broadening to a certain degree. And last but not least the complexity of the diffraction pattern and the phase abundance determine whether the peak shape of a specific phase is defined well enough to allow anisotropic, isotropic, or no refinement of the crystallite size. Refining crystallite sizes despite insufficient data quality may lead to unstable refinements and random results.
The striking difference in data scattering between β-TCP and HA crystallite sizes (Table III, Figure 6) raised the question whether β-TCP crystallite sizes submitted by laboratories B, D, and G should be regarded as outliers and consequently be excluded from the precision estimate, as ASTM E 691–13 (2013) recommends for erroneous data. However, careful examination of the raw and refined data did not expose any clerical, sampling, or procedural errors. The inaccurate results seemed rather to be related to raw data quality (signal-to-noise ratio, peak resolution, and step size) resulting in more peak overlap and less defined β-TCP peak shapes, and to the refinement strategy. As the choice of the refinement strategy is an integral part of Rietveld refinement, excluding the datasets in question from the statistical evaluation would have excessively sanitized the precision of crystallite sizes in an unjustified manner. Hence none of the reported crystallite size data were eliminated from the precision estimate.
Precipitated HA crystals often grow in anisotropic shapes relative to the crystallographic c-axis (Neira et al., Reference Neira, Kolen'ko, Lebedev, Van Tendeloo, Gupta, Guitián and Yoshimura2009), which results in different amounts of peak broadening for direction 〈001〉 compared with all other crystallographic directions. Relative phase quantities are calculated from all phases’ scale factors, unit-cell volumes, and the total masses of the unit-cell contents after convergence of the refinement (Dinnebier and Billinge, Reference Dinnebier and Billinge2008). These parameters are predominantly sensitive to accurate fits of peak positions and integrated intensities, but less so to the shape of peaks. One might thus be tempted to assume that poor fits of anisotropic HA peaks widths would not bias phase quantifications, provided the integrated intensities were refined accurately. But this would ignore the fact that anisotropic crystal shapes often introduce preferred orientation effects which can be reduced, but not entirely eliminated, by careful sample preparation. Quite often refinement of anisotropic peak broadening for directions 〈100〉 and 〈001〉 as well as preferred orientation is therefore necessary to obtain accurate fits of HA 00l peaks, hence accurate calculations of integrated peak intensities, and ultimately accurate phase quantities. However, in our reference material moderate heat treatment and sintering effects during the preparation resulted in almost spherical HA particles. This explains why anisotropic refinements of HA crystallite sizes resulted in similar dimensions for directions 〈100〉 and 〈001〉 and why some participants could refine the size isotropically without obtaining substantially worse fits. Several mean values
 $\bar x$
were significantly different from the global mean value
 $\overline{\overline x} $
(Figure 6). In case of anisotropic refinement, the differences were not random but correlated (R
2 = 0.77). In other words, in most datasets with a significant bias both dimensions were either smaller or greater than the global average
 $\overline{\overline x} $
. This systematic offset was likely to be caused by one of the calibration issues discussed above.
The reproducibility of β-TCP crystallite size was one order of magnitude greater than reproducibilities reached for HA. This was mainly related to the fact that five configurations reported excessive standard deviations. All other datasets reached standard deviations comparable to HA crystallite sizes (Figure 6). Examination of the diffraction contributions of β-TCP and HA did not reveal any inherent sample-related factors impairing the approximation of the β-TCP peak shape. The strongest peaks were not significantly overlapped, neither by neighbouring β-TCP peaks, nor by those of the HA phase (Figure 1), and all instrument alignment and calibration related effects would have affected both phases to the same extent. However, the lower phase content of β-TCP, which was the primary reason for the lower intensity of the strongest peaks compared with HA, resulted in a lower signal-to-noise ratio and counting noise covering the tails of the peaks. Even with maximum peak intensities far stronger than the counting noise, separate refinement of crystallite size and micro strain may become impossible if the peak tails, which manifest the Lorentzian characteristics of the broadening effect to a large degree, are dominated by noise. Whether or not refinement of micro strain played a role in unreliable crystallite sizes was not known, as no further details on the refinement strategy were reported by the participants. Those participants who reported inconsistent β-TCP crystallite sizes were therefore advised to revise their refinement strategy and/or improve their counting statistics.
VII. CONCLUSION
The ILS on quantification of HA and β-TCP bioceramics by powder XRD and Rietveld refinement, conducted according to ASTM E691–13, provided detailed statistical data on the repeatability and reproducibility of the results reported by a number of independent laboratories. The group of participants comprised operators of various levels of experience using a mix of different instruments and software, and employing their established data collection and evaluation techniques. The study thus provided results not obtained under best-case conditions, but under realistic conditions taking into account variable skills, time constraints, and optimizations of instrument configurations.
The precision and accuracy of refined phase quantities generally depends on the context, namely on the number of phases in the sample, these phases’ pattern complexity, particle and crystallite size and shape, chemical composition, and many more parameters. Nevertheless were our results consistent with previous studies in that the multilaboratory reproducibility parameters of phase quantifications were roughly two times greater than the within-laboratory repeatability parameters. Based on the ratio between repeated and reproduced phase quantifications, laboratories may prefer to multiply their standard deviation with factor 2 to report reproducibility standard deviations s R rather than repeatability standard deviations. In a conservative approach, the reproducibility standard deviations may further be multiplied by factor 2.8 (with reference to ASTM E691 – 13 (2013) and/or ASTM E177 – 13 (2013)) to obtain 95% reproducibility intervals R. In our study, the latter approach resulted in R = ±1.67 wt%.
Our ILS also revealed that the data quality of several configurations was insufficient to refine crystallite sizes of the minor phase β-TCP. The problem manifested itself in excessively high standard deviations, which could be easily spotted without comparing the results with other more robust refinements. Laboratories experiencing inconsistent crystallite sizes from repeated data collections and refinements are therefore advised to revise their sample preparation, data collection settings, and refinement strategy, until refined crystallite sizes are consistent.
The statistical information presented in this study may be considered for reporting and validation by laboratories determining phase quantities of HA and β-TCP ceramics by powder XRD, as suggested by several national and international standards. Laboratories working in other chemical systems may also benefit from the relation between within-laboratory repeatabilities and multilaboratory reproducibilities in general.
ACKNOWLEDGEMENTS
The author acknowledges the support of all anonymous contributors to this ILS. Without their efforts and data contributions this study would not have been realized. Benjamin Andreatta of RMS Foundation, Switzerland, is acknowledged for his support with ICP-MS analyses.



