



1. Introduction
The natural convection in particle-laden flows has been widely studied. This is because they are commonly encountered in many engineering, environmental and medical applications at different scales that range from fabrication or solidification processing of composites (Fisher Reference Fisher1981; Mackie Reference Mackie2000), indoor pollutant transport (Dehbi et al. Reference Dehbi, Kalilainen, Lind and Auvinen2017), radioactive aerosol particles in nuclear containment (Bosshard et al. Reference Bosshard, Dehbi, Deville, Leriche and Soldati2014) to microfluidic devices for DNA amplification (Krishnan, Ugaz & Burns Reference Krishnan, Ugaz and & Burns2002; Allen, Kenward & Dorfman Reference Allen, Kenward and Dorfman2009). Moreover, the convection in a solvent with dispersed nanoscale particles has been investigated in several studies since the presence of nanoparticles can cause the enhancement of heat transfer by improving the thermal conductivity of mixtures in engineering applications (e.g. heat exchanger, electronic cooling, solar energy, etc.) (Kim, Kang & Choi Reference Kim, Kang and Choi2004; Chang, Mills & Hernandez Reference Chang, Mills and Hernandez2008; Nield & Kuznetsov Reference Nield and Kuznetsov2010; Abu-Nada Reference Abu-Nada2011). Herein, we explore the behaviour of suspensions in a flow confined between horizontal plates known as Rayleigh–Bénard convection (RBC) to understand how flow transitions are affected by suspended particles where the mixing occurs at very low Reynolds numbers. Rayleigh–Bénard convection of pure Newtonian fluids has been studied extensively since it is an excellent model to explore both heat transfer and thermally induced turbulence (Bodenschatz, Pesch & Ahlers Reference Bodenschatz, Pesch and Ahlers2000; Ahlers, Grossmann & Lohse Reference Ahlers, Grossmann and Lohse2009). The stationary state of a horizontal fluid layer becomes unstable at a critical value of Rayleigh number (Rac = 1707.8) to the perturbations of critical wavenumber kc = 3.12 (Schlüter, Lortz & Busse Reference Schlüter, Lortz and Busse1965; Bodenschatz, Pesch & Ahlers Reference Bodenschatz, Pesch and Ahlers2000). At Rayleigh number Ra, slightly larger than Rac, an array of straight convection rolls forms when the lateral extension of the fluid system is large (Schlüter, Lortz & Busse Reference Schlüter, Lortz and Busse1965; Bodenschatz, Pesch & Ahlers Reference Bodenschatz, Pesch and Ahlers2000). Surprisingly, there has been little work on instability and mixing in suspensions of micron-sized particles (hydraulic diameter >1 μm) where complex phenomena might occur due to the existence of inertial particles in the flow.
At low Reynolds numbers, the mixing occurs through molecular diffusion (Hinch Reference Hinch, Chaté, Villermaux and Chomas2003). Several studies explored the suspensions of non-colloidal and non-Brownian particles in shear flows that undergo a self-diffusion phenomenon, known as ‘shear-induced diffusion’ (Eckstein, Bailey & Shapiro Reference Eckstein, Bailey and Shapiro1977; Leighton & Acrivos Reference Leighton and Acrivos1987; Phillips, Armstrong & Brown Reference Phillips, Armstrong and Brown1992; Sierou & Brady Reference Sierou and Brady2004). In this case, the particles in the suspensions migrate from regions with a higher shear rate to a lower shear rate at a low particle Reynolds number (Leighton & Acrivos Reference Leighton and Acrivos1987; Phillips, Armstrong & Brown Reference Phillips, Armstrong and Brown1992). The shear-induced particle diffusion plays a significant role in the behaviour of concentrated, non-colloidal suspensions. It is also responsible for non-Newtonian rheological behaviours of the flow (Denn & Morris Reference Denn and Morris2014). The particle migration for various geometries has been examined in detail by many researchers (Nott & Brady Reference Nott and Brady1994; Lyon & Leal Reference Lyon and Leal1998a,Reference Lyon and Lealb; Morris & Brady Reference Morris and Brady1998; Subia et al. Reference Subia, Ingber, Mondy, Altobelli and Graham1998; Morris & Boulay Reference Morris and Boulay1999; Fang et al. Reference Fang, Mammoli, Brady, Ingber, Mondy and Graham2002; Miller & Morris Reference Miller and Morris2006; Dbouk et al. Reference Dbouk, Lemaire, Lobry and Moukalled2013; Mirbod Reference Mirbod2016; Chun et al. Reference Chun, Pakr, Jung and Won2019; Kang & Mirbod Reference Kang and Mirbod2020).
By contrast, heat transfer phenomena in suspensions of micron-sized rigid particles under the shear-induced diffusion have been attempted in a few studies. For example, Ahuja (Reference Ahuja1975a,Reference Ahujab) experimentally demonstrated the augmentation of the heat transfer in a laminar Poiseuille flow (the Reynolds number Re > 1) with polystyrene suspensions. The author showed that the effective thermal conductivity of flowing suspensions is three times higher than the conductivity of stationary suspensions. Sohn & Chen (Reference Sohn and Chen1981) measured the effective thermal conductivity  $({k_s})$ of neutrally buoyant solid–fluid mixtures in a rotating Couette flow apparatus. They observed a significant improvement in the effective conductivity
 $({k_s})$ and determined the dependence of
 ${k_s}$ on the particle Péclet number
 $(P{e_p} = \dot{\gamma }d_p^{\; 2}/{\alpha _f})$. They also proposed a power-law relationship
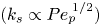 $({k_s} \propto Pe_p^{\; 1/2})$ for high Péclet numbers
 $(300 \lt P{e_p} \lt 2000)$. For this expression,
 $\dot{\gamma }$ is the local shear rate, dp is the particle diameter and
 ${\alpha _f}$ is the thermal diffusivity of the fluid. Chung & Leal (Reference Chung and Leal1982) verified the theoretical prediction that was previously obtained by Leal (Reference Leal1973) for a dilute sheared suspension at a low particle Péclet number where
 ${k_s}$ depends on the particle volume fraction and the local Péclet number. They found a reasonable agreement with the prediction, even for suspensions with a moderate volume fraction
 $( \le \,0.25)$ and a higher Péclet number
 $(Pe\sim \textit{O}(1))$. Later, Shin & Lee (Reference Shin and Lee2000) examined the effects of the shear rate
 $( \le \,900\;{\textrm{s}^{ - 1}})$, particle size (25–300 μm) and particle volume concentration
 $( \le \,10\,\%)$ on
 ${k_s}$. It was revealed that
 ${k_s}$ increases with the shear rate. This increase depends on the size of the dispersed particles. They also proposed a new correlation for the shear-rate-dependent thermal conductivity of suspensions, which is strongly affected by the particle size and volume concentration during shear flow. The effect of the shear-induced diffusion on the heat transfer in sheared suspensions of non-Brownian particles at low Reynolds number was elucidated further by Metzger, Rahli & Yin (Reference Metzger, Rahli and Yin2013). They examined the influence of the particle size, particle volume fraction and the applied shear by the experiments and simulations; further, they obtained the effective thermal diffusivity of the suspensions
 $({\alpha _s})$. They found that
 ${\alpha _s}$ is proportional to the thermal Péclet number
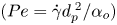 $(Pe = \dot{\gamma }d_p^{\; 2}/{\alpha _o})$ and the particle volume fraction (ϕ), where
 ${\alpha _o}$ is the thermal diffusivity of the suspensions at rest. From this, they suggested a simple correlation
 $({\alpha _s}/{\alpha _o} = 1 + 0.046\phi Pe)$ based on the experimental and numerical data. Recently, Dbouk (Reference Dbouk2018) employed this correlation in numerical modelling and a simulation for a laminar forced-convection flow of non-colloidal suspensions to examine the conjugate heat transfer in a rectangular channel. On the other hand, a suspension modelling in a buoyancy-driven thermal convection has been considered lately by Dbouk & Bahrani (Reference Dbouk and Bahrani2021). The authors developed transient mathematical formulations for thermal convection in immersed granular beds of non-colloidal particles and studied the destabilization of the beds observed in a recent experiment (Morize, Herbert & Sauret Reference Morize, Herbert and Sauret2017). Nevertheless, to the best of our knowledge, there are no studies that are focused on the flow behaviour and transition in RBC of non-colloidal, non-Brownian suspensions that are affected by the shear-induced diffusion.
This study deals with RBC of a suspension of neutrally buoyant, non-colloidal, rigid, spherical particles. We employ the effective diffusivity of suspensions  $({\alpha _s})$ proposed by Metzger, Rahli & Yin (Reference Metzger, Rahli and Yin2013) that considers the heat transfer across the suspensions. This work focuses on understanding the effect of the particles undergoing shear-induced diffusion on the thermal convection at low Reynolds numbers. Both linear stability analysis and numerical simulation are performed for concentrated suspensions. We predict the critical states of the buoyancy-driven instability and determine the nature of the bifurcation. In addition, this study presents the flow and particle concentration structures of the thermal convection. This investigation also analyses the dynamics of the particles that are interacting with the convective flow and the heat transfer rate.
This paper is organized as follows. In § 2, we formulate the physical problem and governing equations together with control parameters. The linear stability analysis is presented in § 3. Section 4 describes the numerical methods of the simulation and presents obtained results. The discussion of the results is provided in § 5. The conclusions of this work are given in § 6.
2. Problem formulation
We consider neutrally buoyant, non-colloidal, rigid monodisperse spherical particles that are suspended in a viscous fluid. The suspensions are confined in the gap of width d between the differently heated horizontal parallel plates (figure 1). We assume that the suspension flow is uniform in a horizontal (spanwise) direction and perform two-dimensional (2-D) analyses in a vertical plane. A temperature difference ΔT is imposed between the top and bottom walls and it is assumed to be small enough for the validity of the Boussinesq approximation.
Schematic diagram of the horizontal suspensions layer heated from the bottom.

2.1. Governing equations
We model suspensions as a continuum characterized by particle volume fraction field  $\phi $. The dimensional conservation equations of mass, momentum and energy for the flow of suspensions are in the Boussinesq approximation given by
 \begin{gather}\boldsymbol{\nabla }\boldsymbol{\cdot }\boldsymbol{u} = \textrm{0,}\end{gather}
 \begin{gather}\; {\rho _o}\left[ {\frac{{\partial \boldsymbol{u}}}{{\partial t}} + \boldsymbol{\nabla }\boldsymbol{\cdot }(\boldsymbol{uu})} \right] ={-} \boldsymbol{\nabla }p + \boldsymbol{\nabla }\boldsymbol{\cdot }(2{\eta _s}(\phi )\boldsymbol{S}) - {\rho _o}\beta \theta \boldsymbol{g},\end{gather}
 \begin{gather}\; {\rho _o}{C_p}\left[ {\frac{{\partial \theta }}{{\partial t}} + \boldsymbol{\nabla }\boldsymbol{\cdot }(\boldsymbol{u}\theta )} \right] = \boldsymbol{\nabla }\boldsymbol{\cdot }({k_s}\boldsymbol{\nabla }\theta ).\end{gather}
Here, u, p and  ${\rho _o}$ are the velocity vector (u, v), pressure and the density of the suspensions, respectively,
 $\boldsymbol{S} = (\boldsymbol{\nabla }\boldsymbol{u}\; + \boldsymbol{\nabla }{\boldsymbol{u}^\textrm{T}})\textrm{/}2$ is the strain rate tensor, g is the gravitational acceleration
 $(0, - g)$,
 $\theta $ denotes the temperature deviation from a reference temperature
 ${T_o}$ (i.e.
 $\theta = T - {T_o}$),
 $\beta $ is the volumetric thermal expansion coefficient, and
 ${C_p}$ and
 ${k_s}$ are the specific heat and thermal conductivity of suspensions, respectively. The last term in the momentum equation (2.2) represents the Archimedean buoyancy force acting on the suspensions under the assumption of the Boussinesq approximation and
 $\rho (\theta ) = {\rho _o}(1 - \beta \theta )$ where
 ${\rho _o} = \rho ({T_o})$. We assume particles have the same thermal expansion coefficient
 $(\beta )$ with the suspending fluid resulting in the neutrally buoyant suspension and neglect the dissipation. The viscosity of the concentrated suspensions
 ${\eta _s}(\phi )$ depends on the particle volume fraction
 $\phi $, and it can be described by using Krieger's empirical correlation (Krieger Reference Krieger1972),
 ${\eta _s}(\phi )\; = \; {\eta _f}{(1 - \phi /{\phi _m})^{ - 1.82}}$. Here,
 ${\eta _f}$ is the viscosity of the suspending fluid, ϕm = 0.68 is the maximum volume fraction (Krieger Reference Krieger1972; Phillips, Armstrong & Brown Reference Phillips, Armstrong and Brown1992), and
 ${\rho _o}{C_p} = (1 - \phi ){({\rho _o}{C_p})_f}\; + \; \phi {({\rho _o}{C_p})_p}$. We assume that the volumetric specific heat
 ${\rho _o}{C_p}$ for the fluid and particles is the same, i.e.
 ${({\rho _o}{C_p})_f} = {({\rho _o}{C_p})_p}$ (Ardekani et al. Reference Ardekani, Abouali, Picano and Brandt2018; Dbouk Reference Dbouk2018), then the energy equation (2.3) is simplified to
 \begin{equation}\frac{{\partial \theta }}{{\partial t}} + \boldsymbol{\nabla }\boldsymbol{\cdot }(\boldsymbol{u}\theta ) = \boldsymbol{\nabla }\boldsymbol{\cdot }({\alpha _s}\boldsymbol{\nabla }\theta ),\end{equation}
where  ${\alpha _s}$ denotes the effective thermal diffusivity of the suspensions. To consider the impact of the shear-induced particle diffusion on the transport of heat across the suspensions, we employ a simple correlation for the thermal diffusivity
 ${\alpha _s}\textrm{/}{\alpha _o} = 1 + c\phi \,Pe$ with c = 0.046 proposed by Metzger, Rahli & Yin (Reference Metzger, Rahli and Yin2013). This correlation is valid up to a moderate Péclet number (Pe ≤ 100) and for a low to a moderate particle volume fraction (ϕ ≤ 0.4) (Metzger, Rahli & Yin Reference Metzger, Rahli and Yin2013). We also assume that the increase in the thermal diffusivity is isotropic, although the correlation was determined only in the shear-gradient direction. Then, we compute the effective thermal diffusivity
 $({\alpha _s})$ using the local particle volume fraction and thermal Péclet number (i.e. local shear rate
 $\dot{\gamma }$). The local Pe remains in the range of Pe < 0.5 for all computations.
2.2. Conservation equation for suspensions
A constitutive model, namely the diffusive flux model (DFM) (Leighton & Acrivos Reference Leighton and Acrivos1987; Phillips, Armstrong & Brown Reference Phillips, Armstrong and Brown1992), is employed to describe the dynamics of particles in suspension. The dimensional conservation equation for non-colloidal particles can be expressed as (Phillips, Armstrong & Brown Reference Phillips, Armstrong and Brown1992)
 \begin{equation}\frac{{\partial \phi }}{{\partial t}} + \boldsymbol{u}\boldsymbol{\cdot }\boldsymbol{\nabla }\phi ={-} \boldsymbol{\nabla }\boldsymbol{\cdot }({\boldsymbol{N}_c} + {\boldsymbol{N}_\eta }),\end{equation}
where Nc and Nη are the particle fluxes that are caused by the spatial variation in the collision frequency and the suspension viscosity, respectively, given by  ${\boldsymbol{N}_c} ={-} {K_c}{a^2}\phi \boldsymbol{\nabla }(\dot{\gamma }\phi )$ and
 ${\boldsymbol{N}_\eta } ={-} {K_\eta }{a^2}\dot{\gamma }{\phi ^2}\boldsymbol{\nabla }(\textrm{ln}\,\eta_{s})$ (Phillips, Armstrong & Brown Reference Phillips, Armstrong and Brown1992; Subia et al. Reference Subia, Ingber, Mondy, Altobelli and Graham1998). Here, a is the radius of particles and
 $\dot{\gamma }$ is the shear rate given by
 $\dot{\gamma } = \sqrt {2\boldsymbol{S}:\boldsymbol{S}} $. The diffusion coefficient Kc and Kη are the empirical constants that are determined by the experiments. Throughout this study, Kc = 0.41 and Kη = 0.62 (Kc/Kη = 0.66) are employed (Phillips, Armstrong & Brown Reference Phillips, Armstrong and Brown1992).
2.3. Control parameters and boundary conditions
The gap width d is chosen as the characteristic length scale. We also adopt the temperature scale as ΔT, the velocity scale and the time scale as  ${\nu _o}\textrm{/}d$ and
 ${d^2}\textrm{/}{\nu _o}$, respectively where
 ${\nu _o} = {\eta _f}/{\rho _o}$. Therefore, the physical dimensionless control parameters are the Rayleigh number
 $Ra = \beta g\Delta T{d^3}/{\nu _o}{\alpha _o}$, the Prandtl number
 $Pr = {\nu _o}/{\alpha _o}$, the bulk particle volume fraction
 ${\phi _b}$, and the particle size ratio
 $\mathrm{\epsilon } = a/d$. In fact, the thermal diffusivity of the suspensions
 ${\alpha _o}$ depends on the particle volume fraction and the conductivities of both particles and the suspending fluid (Shin & Lee Reference Shin and Lee2000; Dbouk Reference Dbouk2018). However, since we assume that the thermal conductivity for both fluid and particles is the same, the diffusivity
 ${\alpha _o}$ is constant. Throughout this work, to focus on the impact of the particles in RBC, we vary the Rayleigh number (Ra) for different bulk particle volume fraction
 $({\phi _b})$ ranging from 0 to 0.3. The particle size is practically related to the effective thermal diffusivity of suspension
 $({\alpha _s})$ which defines the local diffusivity by reflecting the local thermal Péclet number. We expect that the particle size affects the heat transfer; however, the dimensionless particle radius
 $\mathrm{\epsilon }$ is fixed at 0.02 in this study to focus to the effect of
 $\phi_b$ on the convection and the heat transfer. We also maintain Pr = 7, i.e. the suspending fluid is water at a room temperature.
The boundary conditions are given by
 \begin{equation}\left.
\begin{gathered} {\boldsymbol{u}\; = \; 0,\quad
\theta \; ={+} 0.5\Delta T,\quad ({\boldsymbol{N}_c} +
{\boldsymbol{N}_\eta })\boldsymbol{\cdot
}{\boldsymbol{e}_y} = 0,\quad at\;y\; = \; 0,}\\
{\boldsymbol{u}\; = \; 0,\; \quad \theta \; ={-} 0.5\Delta
T,\quad ({\boldsymbol{N}_c} + {\boldsymbol{N}_\eta
})\boldsymbol{\cdot }{\boldsymbol{e}_y} = 0,\quad at\;y\; =
\; d,}\\ {\; \boldsymbol{u}(x,y) = \boldsymbol{u}(x +
L,y),}\\ {\; \theta (x,y) = \theta (x + L,y),}\\ {\; \phi
(x,y) = \phi (x + L,y).} \end{gathered}
\right\}\end{equation}
The no-slip condition is imposed at the bottom (y = 0) and top (y = d) of the walls, in which both walls are kept at constant temperatures. The total flux of the particles is zero at the walls, and the flow, temperature and particle volume fraction are all assumed to be periodic in the x-direction.
3. Linear stability analysis
3.1. Linearized equations
When a small temperature difference is imposed on the system, the conductive state  $(\tilde{\boldsymbol{u}}\; = \; 0)$ is established in the suspensions layer, where
 $\tilde{\boldsymbol{u}}$ is the flow velocity non-dimensionalized by the velocity scale as
 ${\eta _f}/d{\rho _o}$. The temperature and concentration of this base state can be determined as
 \begin{equation}\tilde{\theta } = 0.5 - \tilde{y},\quad \tilde{\phi } = {\varPhi _b}.\end{equation}
Here,  ${\varPhi _b}$ is the particle volume fraction normalized by the maximum value ϕm = 0.68, i.e.
 ${\varPhi _b} = {\phi _b}/{\phi _m}$ and the tildes mean non-dimensionalized quantities by the aforementioned scales.
We superimpose infinitesimal perturbations of the velocity  $\boldsymbol{\tilde{u}^{\prime}} = (\tilde{u}^{\prime},\tilde{v}^{\prime})$, the pressure
 $\tilde{p}^{\prime}$, the temperature
 $\tilde{\theta }^{\prime}$ and the concentration
 $\tilde{\phi }^{\prime}$ on the base state to conduct the linear stability analysis, which allows the determination of critical states. The governing equations (2.1), (2.2), (2.4) and (2.5) are linearized around the base state, then the perturbations are developed into normal modes of complex growth rate s and wavenumber k (Drazin & Reid, Reference Drazin and Reid2004) as
 \begin{equation}(\tilde{u}^{\prime},\tilde{v}^{\prime},\tilde{p}^{\prime},\tilde{\theta }^{\prime},\tilde{\phi }^{\prime}) = (\hat{u},\hat{v},\hat{p},\hat{\theta },\hat{\phi })\,\textrm{exp}(st + \textrm{i}kx).\end{equation}
Here, the hatted quantities denote the complex amplitude of the perturbations. The temporal behaviour of the perturbations is dictated by  $s = \sigma + \textrm{i}\omega $, where
 $\sigma $ is the growth rate of the perturbations and
 $\omega $ is the frequency of the mode. The linearized governing equations are then given by
 \begin{gather}{\textrm{i}}k\hat{u} + \frac{{\partial \hat{v}}}{{\partial \tilde{y}}} = 0,\end{gather}
 \begin{gather}s\hat{u} ={-} \textrm{i}k\hat{p} + {\eta _r}({\varPhi _b})\left( {\frac{{{\textrm{d}^2}}}{{\textrm{d}{{\tilde{y}}^2}}} - {k^2}} \right)\hat{u},\end{gather}
 \begin{gather}s\hat{v} ={-} \frac{{\textrm{d}\hat{p}}}{{\textrm{d}\tilde{y}}} + {\eta _r}({\varPhi _b})\left( {\frac{{{\textrm{d}^2}}}{{\textrm{d}{{\tilde{y}}^2}}} - {k^2}} \right)\hat{v} + \frac{{Ra}}{{Pr}}\hat{\theta },\end{gather}
 \begin{gather}s\hat{\theta } + \hat{v}\frac{{\textrm{d}\varTheta }}{{\textrm{d}\tilde{y}}} = \frac{1}{{Pr}}\left( {\frac{{{\textrm{d}^2}}}{{\textrm{d}{{\tilde{y}}^2}}} - {k^2}} \right)\hat{\theta } - 4c{\phi _m}{\varPhi _b}{\mathrm{\epsilon }^2}\left( {\frac{{\textrm{d}\hat{u}}}{{\textrm{d}\tilde{y}}} + \textrm{i}k\hat{v}} \right),\end{gather}
 \begin{gather}s\hat{\phi } = {K_c}{\mathrm{\epsilon }^2}{\phi _m}\varPhi _b^2\left( {\frac{{{\partial^2}}}{{\partial {{\tilde{y}}^2}}} - {k^2}} \right)\left( {\frac{{\textrm{d}\hat{u}}}{{\partial \tilde{y}}} + \textrm{i}k\hat{v}} \right).\end{gather}
The relative viscosity  ${\eta _r}$ in (3.3b) and (3.3c) related to the normalized volume fraction as
 ${\eta _r}({\varPhi _b}) = {\eta _s}({\varPhi _b})/{\eta _f} = {(1 - {\varPhi _b})^{ - 1.82}}$. Because of the absence of fluid motion and the concentration gradient in the base state, the perturbation of the particle flux
 ${\boldsymbol{N}_\eta }$ is a third-order; thus, the linear dynamics of the present suspension system is independent of the particle flux associated with the particle collision frequency.
The solution of (3.3a–e) is subject to the linearized boundary condition defined as
 \begin{equation}\hat{u} = \hat{v} = \hat{\theta } = \frac{{{\textrm{d}^2}\hat{u}}}{{\textrm{d}{{\tilde{y}}^2}}} = 0\quad \textrm{at}\;\tilde{y} = 0,1.\end{equation}
The condition on the second derivative of  $\hat{u}$ has been derived from the zero-particle flux condition at the walls.
We solve the eigenvalue problem formed by (3.3) and (3.4) using the Chebyshev spectral method. The complex amplitudes  $(\hat{u},\hat{v},\hat{p},\hat{\theta },\hat{\phi })$ are formally expanded into Chebyshev polynomials. Equations (3.3a–e) were evaluated at the set of Chebyshev–Gauss–Lobatto collocation points, which gives a generalized eigenvalue problem in a matrix form where this eigenvalue problem is solved by the generalized Schur decomposition (QZ decomposition). The highest degree L of the considered Chebyshev polynomials is fixed at L = 60. We find that a further increase in L has no effect on the results of the stability analysis.
3.2. Critical states
The eigenvalue problem has been solved for a given set of parameters  $(Pr,Ra,\mathrm{\epsilon },{\phi _b},{K_c})$, among which
 $(\mathrm{\epsilon },{K_c})$ are fixed throughout the present investigation as mentioned earlier. The eigenvalues and eigenvectors of (3.3a–e) are computed for various wavenumber k, Rayleigh number Ra, Prandtl number Pr and bulk volume fraction
 ${\phi _b}$. It is observed that at any Ra there exist neutrally stable modes, i.e. modes with
 $\sigma = 0$, as known in stability analyses of fluidized beds (Buyevich & Kapbasov Reference Buyevich, Kapbasov and Cheremisinoff1996). However, by increasing Ra for a given
 $(k,{\phi _b})$, the growth rate of the most unstable mode remains zero until a certain value of the Rayleigh number,
 $R{a_m}$. Once Ra exceeds
 $R{a_m}$, the growth rate
 $\sigma $ starts increasing from zero. We determined this threshold value
 $R{a_m}$ by extrapolating the behaviour of
 $\sigma $ at
 $Ra \gt R{a_m}$ (see the Appendix). A set of
 $R{a_m}$ for different values of k at fixed values of
 $(Pr,{\phi _b})$ provides the marginal stability curves
 $R{a_m} = R{a_m}(k)$ (figure 2a). We found that the marginal curves are independent of Pr and the marginally stable modes are stationary
 $(\omega = 0)$ like the classical RBC (Drazin & Reid Reference Drazin and Reid2004). Indeed, by rescaling the time and velocities in (3.3), it is possible to derive (3.3) into a set of equations where Pr is involved only in the coefficients of the complex growth rate s; therefore, the marginally stable stationary modes (s = 0) are independent of the Prandtl number.
(a) Marginal stability curves and (b) the variation of the critical Rayleigh number  $(R{a_c})$ for the particle size ratio
 $\mathrm{\epsilon } = 0.02$. Note that these results do not depend on the Prandtl number.

Note that the minimum value of the marginal stability curve provides the critical parameters  $({k_c},R{a_c})$ for a given set of
 $(\mathrm{\epsilon },{\phi _b},{K_c})$, while the critical conditions do not depend on Pr because of the independence of marginal conditions from Pr. We present the variation in the critical Rayleigh numbers versus the bulk volume fraction of the suspensions
 ${\phi _b}$ in figure 2(b). It can be observed that the suspended particles stabilize the flow. Although
 $R{a_c}$ grows gradually by increasing
 ${\phi _b}$ from the critical value
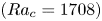 $(R{a_c} = 1708)$ for a pure Newtonian fluid, the critical wavenumber
 $({k_c})$ remains constant at 3.12 (i.e.
 ${\lambda _c} = 2\mathrm{\pi }/{k_c} \cong 2d$), which is the value for pure fluids (Schlüter, Lortz & Busse Reference Schlüter, Lortz and Busse1965).
3.3. Energy analysis
We have evaluated an evolution equation, which governs the density of the kinetic energy 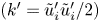 $(k^{\prime} = {\tilde{u}^{\prime}_i}{\tilde{u}^{\prime}_i}/2)$ of the perturbation flow, in order to get insights into the instability mechanism. The equations can be derived from the linearized momentum equations, given by
 \begin{equation}\frac{{\textrm{d}{{\langle k^{\prime}\rangle }_V}}}{{\textrm{d}t}} = \underbrace{{\frac{{Ra}}{{Pr}}{{\langle \tilde{v}^{\prime}\tilde{\theta }^{\prime}\rangle }_V}}}_{{{B_{k^{\prime}}}}} + {\varepsilon _{k^{\prime}}},\end{equation}
where the angle brackets  ${\langle \;\rangle _V}$ represent the averaging operation over the whole domain. The terms on the right-hand side of (3.5) represent the contributions to the perturbation flow energy of the different mechanisms,
 ${B_{k^{\prime}}}$ is the power density generated by the gravitational buoyancy that is analogous to the one in the classical Rayleigh–Bénard convection and
 ${\varepsilon _{k^{\prime}}} ={-} {\langle {\eta _r}({\varPhi _b}){[\partial {\tilde{u}^{\prime}_i}/\partial {\tilde{x}_j}]^2}\rangle _V}$ is the contribution of the viscous energy dissipation. Figure 3 shows the variations of the terms with
 ${\phi _b}$. The kinetic energy of the perturbation is created by the buoyancy, and it is balanced by the dissipation term as demonstrated in the classical Rayleigh–Bénard instability. This result suggests that the current instability could be regarded as the Rayleigh–Bénard instability of a single-phase flow in which the viscosity is modified due to the existence of the suspended particles. In fact, we may omit the variation of thermal diffusivity, since the rate of the variation involves a small coefficient,
 $4c{\phi _m}{\varPhi _b}{\mathrm{\epsilon }^2} \sim {10^{ - 5}}$. Then, one can cast (3.3b)–(3.3d) as
 \begin{equation}\left.
\begin{gathered} {{s^\ast }\hat{u} ={-}
\textrm{i}k{{\hat{p}}^\ast } + \left(
{\dfrac{{{\textrm{d}^2}}}{{\textrm{d}{{\tilde{y}}^2}}} -
{k^2}} \right)\hat{u},}\\ {{s^\ast }\hat{v} ={-}
\dfrac{{\textrm{d}{{\hat{p}}^\ast
}}}{{\textrm{d}\tilde{y}}} + \left(
{\dfrac{{{\textrm{d}^2}}}{{\textrm{d}{{\tilde{y}}^2}}} -
{k^2}} \right)\hat{v} + \dfrac{{R{a^\ast }}}{{P{r^\ast
}}}{{\hat{\theta }}^\ast },}\\ {{s^\ast }{{\hat{\theta
}}^\ast } + \hat{v}\dfrac{{\textrm{d}\varTheta
}}{{\textrm{d}\tilde{y}}} = \dfrac{1}{{P{r^\ast }}}\left(
{\dfrac{{{\textrm{d}^2}}}{{\textrm{d}{{\tilde{y}}^2}}} -
{k^2}} \right){{\hat{\theta }}^\ast }.} \end{gathered}
\right\}\end{equation}
Herein, the complex growth rate, the perturbation pressure and the perturbation temperature have been rescaled as  ${s^\ast } = s/{\eta _r}$,
 ${p^\ast } = p/{\eta _r}$, and
 ${\hat{\theta }^\ast } = {\eta _r}\hat{\theta }$, while the modified Rayleigh and Prandtl numbers have been defined as
 $R{a^\ast } = Ra/{\eta _r}({\varPhi _b})$ and
 $P{r^\ast } = {\eta _r}\,Pr$, respectively. It should be noted that the equation set (3.6) is identical to the governing equations of the classical Rayleigh–Bénard instability. Once the Ra rescales to
 $R{a^\ast }$, all the marginal curves in figure 2(a) merge into a single curve, which is identical to the marginal curve of Rayleigh–Bénard instability. The critical Rayleigh number can then be given by
 $Ra_c^\ast\, =\, R{a_{RB,c}}\;( = \,1708)$, which implies that
 \begin{equation}R{a_c} = R{a_{RB,c}} \cdot {\eta _r}({\varPhi _b}) = \frac{{1708}}{{{{(1 - {\phi _b}/{\phi _m})}^{1.82}}}}.\end{equation}
Comparisons of (3.7) with the linear stability analysis results show perfect agreements as represented in figure 2(b). These results confirm that the thermal instability in suspension can be assimilated as the Rayleigh–Bénard instability in a pure fluid with an effective viscosity of  ${\eta _f}{\eta _r}({\varPhi _b})$. It should be emphasized that this exact analogy would not hold when the local thermal Péclet number becomes significant. In fact, for large thermal Péclet numbers, the variation of the effective thermal diffusivity
 ${\alpha _s}$ is no longer negligible (e.g. Sohn & Chen Reference Sohn and Chen1981); therefore, the last term in (3.3d) cannot be ignored. The third equation of (3.6) should then be completed by a term representing the effect of thermal diffusivity variation due to the flow shear.
Variation of the different power density terms of the critical states that are normalized by doubling the perturbation kinetic energy  $2{\langle k^{\prime}\rangle _V}$ for various
 ${\phi _b}$.

4. Numerical simulation
4.1. Numerical methods
The governing equations (2.1), (2.2), (2.4), and (2.5) were discretized using a finite volume method in the Cartesian grid system. A second-order central difference scheme is used for the spatial discretization of the derivatives except for the convective term  $(\boldsymbol{u}\boldsymbol{\cdot }\boldsymbol{\nabla }\phi )$ of the conservation equation for the particles (i.e. (2.5)) where we employed the QUICK (quadratic upstream interpolation for convective kinematics) scheme for the discretization. A hybrid scheme is used for the time advancement, the nonlinear terms are explicitly advanced by a third-order Runge–Kutta scheme, and the other terms are implicitly advanced by the Crank–Nicolson method (Kang & Yang Reference Kang and Yang2011, Reference Kang and Yang2012; Kang & Mirbod Reference Kang and Mirbod2020). A fractional-step method was applied for the time integration, then the Poisson equation resulting from the second stage of the fractional-step method is solved by a fast Fourier transform (FFT) (Kim & Moin Reference Kim and Moin1985). The number of grid points is
 $256(x) \times 128(y)$, the length of the domain is L = 8d (
 ${\cong} \,4{\lambda _c}$) and the grid cells are uniform in both directions. Hereafter, all quantities were normalized by the characteristic variables (d,
 ${\nu _o}/d$,
 ${d^2}/{\nu _o}$ and ΔT) described in § 2.3, and the tilde in the dimensionless variables is omitted for the sake of convenience.
4.2. Onset of the instability
In the classical Rayleigh–Bénard system, convection rolls develop from a quiescent conduction state through a supercritical bifurcation when the Rayleigh number Ra is larger than the critical value  $(Ra \ge R{a_c})$). To characterize the critical states of the flow, we use the Landau equation, which describes the evolution of the flow perturbation in its weakly nonlinear regime, and it can be determined as (Landau & Lifshitz Reference Landau and Lifshitz1976; Guckenheimer & Holmes Reference Guckenheimer and Holmes1983; Kang et al. Reference Kang, Meyer, Mutabazi and Yoshikawa2017, Reference Kang, Meyer, Yoshikawa and Mutabazi2019a,Reference Kang, Meyer, Yoshikawa and Mutabazib)
 \begin{equation}\frac{{\textrm{d}A}}{{\textrm{d}t}} = \sigma (1 + \textrm{i}{c_1})A - l(1 + \textrm{i}{c_2})|A{|^2}A + \cdots .\end{equation}
Here,  $\sigma $ is the linear growth rate of the perturbation and l is the Landau constant, where the sign of l indicates the nature of the bifurcation (i.e. supercritical versus subcritical). The constant
 ${c_1}$ and
 ${c_2}$ are the linear and nonlinear dispersion coefficients. They both can be determined from the linear stability analysis (Kang et al. Reference Kang, Meyer, Mutabazi and Yoshikawa2017, Reference Kang, Meyer, Yoshikawa and Mutabazi2019a,Reference Kang, Meyer, Yoshikawa and Mutabazib). In this study, the coefficients are zero (i.e.
 ${c_1} = {c_2} = 0$) because the critical modes are stationary
 $(\omega = 0)$ as found in the linear stability analysis. We have also introduced the norm of the normal velocity component at the middle of the gap to define the amplitude of the perturbation
 $|A|$ that can be stated as
 \begin{equation}|A|= \frac{1}{L}\int_0^L {|v(x,y = 0.5)|\,\textrm{d}x} .\end{equation}
A time history of the amplitude  $|A|$ for Ra = 2290 and
 ${\phi _b} = 0.1$ is displayed with a semilogarithmic scale in figure 4(a). As can be observed, there is a sharp drop at the initial stage since a random noise of
 $O({10^{ - 5}})$ is provided in the flow field. However, an instability is triggered after the decay, and the amplitude of the perturbation grows exponentially. This yields a growth rate
 $(\sigma )$ for the most unstable mode defined from the slope of the linear portion of the curve. By further increasing the time, the nonlinearity occurs at t ≈ 1800 and the amplitude is slowly saturated to a constant value. The growth rates computed for several values of Ra for
 ${\phi _b} = 0.1$ are presented in figure 4(b). Then, the threshold
 $R{a_c}$ can be determined from the
 $(\sigma ,Ra)$ curve using linear extrapolation. We found the critical Rayleigh number
 $(R{a_c})$ is 2281.74 for
 ${\phi _b} = 0.1$. This agrees well with the value
 $(R{a_c} = 2280.5)$ predicted by the linear stability analysis in § 3. In the same manner, the critical values of Ra have been obtained for various
 ${\phi _b}$ ranging from 0 to 0.3 and reported with those computed by the linear stability analysis in figure 5 that shows a good agreement. As predicted by the linear stability analysis and explained in § 3,
 $R{a_c}$ increases as the suspensions become denser (i.e. as
 ${\phi _b}$ rises).
(a) The temporal evolution of the amplitude of the perturbation for Ra = 2290 (Ra* = 1714.38) and  ${\phi _b} = 0.1$. (b) The growth rates of the perturbations close to Rac. We used a linear fitting curve to determine the threshold value. The amplitude
 $|A|$ was normalized by
 ${\nu _o}\textrm{/}d$.

Critical Rayleigh numbers  $(R{a_c})$ versus the bulk particle volume fraction
 $({\phi _b})$. The black long-dashed line indicates
 $R{a_c} = 1708$ for a pure Newtonian fluid (i.e.
 ${\phi _b} = 0$).

4.3. Nature of the instability
In (4.1), the sign of the Landau constant l determines the type of transition. The bifurcation is supercritical (non-hysteretic) if l is positive  $(l \gt 0)$, while a negative value of l
 $(l \lt 0)$ indicates a subcritical (hysteretic) transition (Kang et al. Reference Kang, Meyer, Mutabazi and Yoshikawa2017, Reference Kang, Meyer, Yoshikawa and Mutabazi2019a,Reference Kang, Meyer, Yoshikawa and Mutabazib). The sign of l can be identified practically from the behaviour of the instantaneous growth rate
 $\textrm{d}\,\textrm{ln}\,|A|/\textrm{d}t$ as a function of
 $|A{|^2}$ at a vanishing
 $|A{|^2}$. The plot of
 $\textrm{d}\,\textrm{ln}\,|A|/\textrm{d}t$ versus
 $|A{|^2}$ at the threshold
 $R{a_c}$ is depicted in figure 6. The intersection with the vertical axis provides the linear growth rate
 $(\sigma )$ of the amplitude
 $|A|$, where the slope at the origin (i.e.
 $|A{|^2} = 0$) determines the nonlinear bifurcation characteristics. Figure 6(a) reveals a supercritical bifurcation for the convection in a pure fluid
 $({\phi _b} = 0)$, whereas the transition from the conduction state in suspensions
 $({\phi _b} \gt 0)$ occurs through a subcritical bifurcation
 $(l \lt 0)$ as shown in figure 6(b). Higher-order terms are then required in the Landau model to describe the saturation of the transition for the flow of suspensions
 $({\phi _b} \gt 0)$ in more detail. We found that the transition in the suspension layer is subcritical for all examined volume fractions
 ${\phi _b} \gt 0$. The subcritical bifurcation has also been observed in the thermal convection for non-Newtonian fluids (Benouared, Mamou & Messaoudene Reference Benouared, Mamou and Messaoudene2014, Jenny, Plaut & Briard Reference Jenny, Plaut and Briard2015). Therefore, we could infer that the non-Newtonian behaviour in viscous stresses arising from the dependence of effective viscosity on
 $\phi $ causes the change in the transition nature. Indeed, the subcriticality observed in the present investigation seems to be produced by the spatial variation of viscosity due to heterogeneous distribution of particles as discussed in § 5.
The derivative of the amplitude logarithm plotted against the square of the amplitude; (a) for Ra = 1720 and  ${\phi _b} = 0$ and (b) for Ra = 2290 (Ra* = 1714.38) and
 ${\phi _b} = 0.1$. The time derivative and amplitude were non-dimensionalized using the characteristic variables as
 ${\nu _o}/d$,
 ${d^2}/{\nu _o}$, respectively.

4.4. Flow and concentration profiles
The flow, temperature and concentration fields at Ra larger than  $R{a_c}$ are presented in figure 7. Counter-rotating convection rolls are driven by the buoyancy and they are formed between the two plates (figure 7a). These rolls cause a wavy distribution in the temperature (figure 7b). Moreover, they lead to an interesting formation of particles in the concentration field. As demonstrated in figure 7(c), the particles are accumulated in the core of the vortices and the ring-shaped structures with a higher volume fraction are established. Figure 7(d) shows the contour of the local shear rate
 $(\dot{\gamma })$ with the velocity vectors. The vortices can cause a strong shear near the top and bottom walls; however, the shear is weak in the core of the vortices as demonstrated in the Rayleigh–Bénard convection for a pure fluid. This causes a gradient in the shear rate, then the particles can migrate toward the core of the convection rolls where the local shear rate is low. However, the shear is strong at the centre of the vortices, and eventually the particles accumulate more in its surroundings, which leads to the ring-shaped structures that are illustrated in figure 7(c).
Contours of the (a) vorticity  $({\omega _z})$, (b) temperature
 $(\theta )$, (c) particle volume fraction
 $(\phi )$ and (d) the local shear rate
 $(\dot{\gamma })$ for Ra = 3230 (Ra* = 1713.54) and
 ${\phi _b} = 0.2$. For clarity, the velocity vectors were plotted for every four and eight grid points in the x- and y-directions, respectively. The vorticity and shear rate were non-dimensionalized by
 ${\nu _o}/{d^2}$, and the temperature was normalized by ΔT.

To support the above conjecture, we show the profiles of several variables in figure 8. In figure 8(a), the location with v = 0 indicates the centre of the convection rolls. The distinct local minima of  $\phi $ are observed at the centre, in which two peaks appear along both sides (figure 8b). These verify the ring-shape accumulation of the particles in the rolls as shown in figure 7(c). Moreover, the sharp minima of
 $\phi $ are between the two vortices where the normal velocity is either a maximum or minimum value. As displayed in figure 8(c), the shear rate (
 $\dot{\gamma }$) is maximum at the centre of the vortices. Consequently, the gradient of the shear generates particle fluxes away from the centre towards the surroundings. On the other hand, strong convective particle fluxes are created between two vortices (figure 8d). These fluxes limit the stack of particles that are induced by the shear at the border between the convection cells; moreover, they accelerate the particles accumulation at the core of the rolls.
Profiles of (a) the normal velocity component (v), (b) the particle volume fraction  $(\phi )$, (c) the local shear rate
 $(\dot{\gamma })$ and (d) the vertical particle flux
 $(v\phi )$ along the x-direction at the middle of the gap (y = 0.5) for Ra = 3230 (Ra* = 1713.54) and
 ${\phi _b} = 0.2$. The velocity and shear rate were normalized by
 ${\nu _o}/d$ and
 ${\nu _o}/{d^2}$, respectively.

The characteristics of the particle migration and the accumulation stated above, when the convection rolls arise, have been observed for various suspensions  $({\phi _b} \gt 0.1)$. It turns out that the particles migrate more to the core of the vortices for higher concentrations (figure 9). In addition, for a higher
 ${\phi _b}$, the ring-shaped structures can be observed more clearly (figure 9a,b) and the peaks of the volume fraction are sharper (figure 9c).
Concentration fields at (a) Ra = 2290 (Ra* = 1714.38) for  ${\phi _b} = 0.1$, and at (b) Ra = 4940 (Ra* = 1713.04) for
 ${\phi _b} = 0.3$. (c) The profiles of
 $\phi $ along the x-direction at the middle of the gap (y = 0.5) for
 ${\phi _\textrm{b}}$= 0.1 (Ra = 2290),
 ${\phi _\textrm{b}}$= 0.2 (Ra = 3230), and
 ${\phi _\textrm{b}}$= 0.3 (Ra = 4940). The profiles were shifted to fit the phase.

By further increasing the Rayleigh number (Ra), a transition to another mode occurs. The suspension consists of the counter-rotating vortices of the smaller lateral extension resulting in five pairs of cells where the vortices become more intensified (figure 10a). This is the same as the classical RBC that the increasing Ra induces a long-wavelength modulation in the horizontal direction leading to the Eckhaus instability of vortices (Tuckerman & Barkley Reference Tuckerman and Barkley1990; Kang et al. Reference Kang, Meyer, Yoshikawa and Mutabazi2019a); as a result, the number of rolls jumps due to the readjustment of vortices in the fixed domain. Moreover, the waviness in the temperature distribution becomes stronger due to the intensified vortices (figure 10b). It also causes a striking change in the concentration field of the particles. As presented in figure 10(c), more particles are piled up in the core of the vortices. Particularly, the ring-shaped structure in which particles are accumulated in the surroundings of the centre of the rolls is not clearly detected any longer. This effect might be triggered by the shear. The intensified vortices with a reduced size increase the local shear and its gradient (figure 10d). Hence, the particle flux induced by the shear increases and then more particles can migrate towards the core of the vortices.
Contours of the (a) vorticity  $({\omega _z})$, (b) temperature
 $(\theta )$, (c) particle volume fraction
 $(\phi )$, and (d) the local shear rate
 $(\dot{\gamma })$ for Ra = 5000 (Ra* = 2652.55) and
 ${\phi _b} = 0.2$. For clarity, the velocity vectors were plotted for every four and eight grid points in the x- and y-directions, respectively. The vorticity and shear rate were non-dimensionalized by
 ${\nu _o}/{d^2}$, and the temperature was normalized by ΔT.

On the other hand, the local concentration of the particles in the core of the rolls decays by rising Ra as presented in figure 11. It can be precisely verified with the distribution of the particle volume fraction  $(\phi )$ in figure 12(a), where the value of
 $\phi $ at the core decreases by increasing Ra. To obtain a better understanding of this behaviour, the profiles of the local shear rate
 $(\dot{\gamma })$ along the centerline of the gap are plotted in figure 12(b). The profiles reveal a different feature from what is presented in figure 8(c). The local shear rates near the boundary between the two counter-rotating vortices are larger than those of the core. As stated above, this enhances the migration of the particles toward the core of the vortices. In the core region, the small local maxima at the centre of the rolls are detected with an increase in Ra as presented in the subplot of figure 12(b). Although the peak is small, the gradient in the shear leads to the shear-induced migration toward its surroundings. For this reason, fewer particles are accumulated in the core of the vortices as Ra rises.
Contours of the particle volume fraction  $(\phi )$ for
 ${\phi _b} = 0.2$; (a) Ra = 6000 (Ra* = 3183.05) and (b) Ra = 12 000 (Ra* = 6366.11).

Profiles of (a) the particle volume fraction  $(\phi )$ and (b) the local shear rate
 $(\dot{\gamma })$ normalized by
 ${\nu _o}/{d^2}$ along the x-direction at the middle of the gap (y = 0.5) for the various Ra values and
 ${\phi _b} = 0.2$. Here, Ra* = 4774.58 for Ra = 9000.

4.5. Heat transfer rate
To evaluate the heat transfer caused by the convective flow, the conserved heat current  $({j^{th}})$ yielded by averaging the energy equation (2.4) in the x-direction has been estimated as follows (Kang et al. Reference Kang, Meyer, Mutabazi and Yoshikawa2017):
 \begin{equation}{j^{th}} = \frac{1}{L}\int_0^L {\left( {v\theta - {\alpha_s}\frac{{\partial \theta }}{{\partial y}}} \right)\textrm{d}x} .\end{equation}
Figure 13 shows the profiles of the heat current density  $({j^{th}})$ for
 ${\phi _b} = 0.1$. As can be confirmed,
 ${j^{th}}$ has a constant value across the gap and it increases with the growth of Ra. Then, the Nusselt number (Nu), defined as the ratio of the total heat transfer of the convective flow to the conductive state, can be determined as (Yoshikawa et al. Reference Yoshikawa, Fogaing, Crumeyrolle and Mutabazi2013; Kang et al. Reference Kang, Meyer, Mutabazi and Yoshikawa2017)
 \begin{equation}Nu = {j^{\; th}}/j_{cond}^{\; th}\quad \textrm{where}\;j_{cond}^{\; th} = \rho {C_p}{\alpha _o}\Delta T/d.\end{equation}
Profiles of the heat current  $({j^{th}})$ normalized by
 ${\nu _o}\Delta T/d$ for
 ${\phi _b} = 0.1$. Here, Ra* = 2245.92 for Ra = 3000, Ra* = 4491.84 for Ra = 6000, and Ra* = 6737.76 for Ra = 9000.

Figure 14(a) illustrates the variation of the Nusselt number with Ra for several  ${\phi _b}$ values. Above the onset of the instability, the heat transfer rate significantly increases due to the vortices that are generated inside the layer. The Nu increases suddenly at the critical Ra for
 ${\phi _b} \gt 0$, since the bifurcation is subcritical (Benouared, Mamou & Messaoudene Reference Benouared, Mamou and Messaoudene2014; Jenny, Plaut & Briard Reference Jenny, Plaut and Briard2015; Kang et al. Reference Kang, Meyer, Mutabazi and Yoshikawa2017). For larger Ra, the Nusselt number grows steadily with Ra. We found a power-law increase of the Nusselt number (Nu) with Ra, namely,
 $Nu\sim R{a^b}$ for relatively large values of Ra where the scaling exponent b decreases with
 ${\phi _b}$. On the other hand, the slope of the increasing Nu decays as the suspension volume fraction
 ${\phi _b}$ increases. This is clearly noticed in the plot of Nu versus
 $Ra - R{a_c}$ as shown in figure 14(b). At the threshold
 $R{a_c}$, the Nusselt numbers for higher
 ${\phi _b}$ are larger; however, Nu grows slowly by increasing Ra for higher concentrations. In figure 14(c), we also plot the variations of Nu versus the modified Rayleigh number (
 $R{a^\ast }$) defined, in § 3, as
 $R{a^\ast } = Ra/{\eta _r}({\varPhi _b})$. This figure reveals that the dynamics of suspensions play a critical role in the resulting heat transfer in suspensions, although the instability occurs at
 $R{a^\ast } = 1708$.
Variations of the Nusselt number (Nu) for various  ${\phi _b}$ values: (a) Nu vs. Ra, (b) Nu vs.
 $(Ra - R{a_c})$ and (c) Nu vs.
 $R{a^\ast }$. The solid lines represent the behaviour of
 ${\sim} \,R{a^b}$. The inset presents the log–log plot.

5. Discussion
The critical Rayleigh number  $(R{a_c})$, in which the convection rolls are formed in the gap, were predicted by both the linear stability analysis and numerical simulation. It turns out that suspensions are more stable for higher particle volume fractions. To get a better understanding on the stabilization mechanism, we have further evaluated the variation rate of the kinetic energy in the flow of suspensions using the numerical simulation.
The dimensional transport equation for the kinetic energy  $(k = {u_i}{u_i}/2)$ derived from the momentum equation (2.2) is expressed as
 \begin{equation}\frac{{\textrm{D}k}}{{\textrm{D}t}}
= \underbrace{{ - \frac{1}{\rho }\frac{{\partial (p u_i)
}}{{\partial {x_i}}}}}_{{{\varPi _k}}} +
\underbrace{{\frac{1}{\rho }\frac{\partial }{{\partial
{x_j}}}(2{\eta _s}(\phi
){S_{ij}}{u_i})}}_{{{D_k}}}\underbrace{{ - \frac{1}{\rho
}\left[ {2{\eta_s}(\phi ){S_{ij}}\left( {\frac{{\partial
{u_i}}}{{\partial {x_j}}}} \right)}
\right]}}_{{{\varepsilon _k}}}\underbrace{{ - \beta \theta
{g_i}{u_i}}}_{{{B_k}}},\end{equation}
where  $\textrm{D}/\textrm{D}t = \partial /\partial t + {u_j}\partial /\partial {x_j}$ and
 ${S_{ij}} = (\partial {u_i}/\partial {x_j} + \partial {u_j}/\partial {x_i})/2$. This equation consists of the pressure work
 $({\varPi _k})$, viscous diffusion
 $({D_k})$, dissipation
 $({\varepsilon _k})$ and the buoyant production
 $({B_k})$ terms.
The distributions for all the terms of the transport equation above the threshold  $R{a_c}$ are illustrated in figure 15 where they were averaged in the horizontal (x) direction. The profiles are symmetric with respect to the centerline (y = 0.5) because of the counter-rotating vortex cells with a mirror-symmetrical structure. The kinetic energy is mainly generated by the buoyancy
 $({B_k})$ in the middle of the gap and it is dissipated near the walls. The dissipation term
 $({\varepsilon _k})$ is balanced by the viscous diffusion
 $({D_k})$ near both walls. The pressure work
 $({\varPi _k})$ and viscous diffusion
 $({D_k})$ terms are cancelled out when they are integrated over the whole fluid volume. Then, the dissipation
 $({\varepsilon _k})$ and buoyant production
 $({B_k})$ terms only remain in (5.1); thus, the dynamic equilibrium in the flow can be described by the balance between the buoyant production and the energy dissipation as
 \begin{equation}\frac{{\textrm{D}{{\langle k\rangle }_V}}}{{\textrm{D}t}} = {\langle \beta \theta gv\rangle _V} + {\langle {\varepsilon _k}\rangle _V},\quad \textrm{where}\;{\langle X\rangle _V} = \frac{1}{{Ld}}\int_0^d {\int_0^L {X\,\textrm{d}x\,\textrm{d}y} .}\end{equation}
This expression explains that the energy is produced by the buoyancy in the suspensions, while the thermal convection occurs when the buoyancy force overcomes the viscous dissipative force. By increasing  ${\phi _b}$, the dissipative force is intensified due to the increase in the effective viscosity of suspensions, while the buoyancy force
 $(\rho \beta \theta g)$ acting on the suspensions is uniform. Consequently, the particles stabilize the suspension flow, leading to a higher critical Rayleigh number
 $(R{a_c})$ as the concentration increases.
Profiles of each term for the kinetic energy balance equation that was averaged along the x-direction; (a) Ra = 2290 (Ra* = 1714.38) for  ${\phi _b} = 0.1$ and (b) Ra = 3230 (Ra* = 1713.54) for
 ${\phi _b} = 0.2$. The values were normalized by
 $\nu _o^{\; 3}/{d^4}$.

In addition, in § 4.3, the type of transition for the suspensions was determined by the Landau constant (l), as displayed in figure 6. It was revealed that the transition in the flow of the suspensions is subcritical while it is supercritical for a pure Newtonian fluid. The subcritical nature of the transition in suspensions can be explained by considering both flow and concentration profiles. When the velocity perturbation grows in the flow of suspensions, the gradient in the shear rate leads to the particle migrations by the shear-induced diffusion, resulting in particle-concentrated and particle-free zones, as presented in figures 7 and 10. In particle-free zones, the effective viscosity is lower than that of the homogeneous suspension. Consequently, the stabilizing viscous force becomes weak and the local value of Rayleigh number turns out to be higher than that computed by the bulk concentration  ${\phi _b}$. Once convection develops, the local Rayleigh number in particle-free zones remains larger than the critical Rayleigh number Rac, although Ra decreases below Rac. Indeed, the particle-free zones are coincident with the zones where the thermal buoyancy drives fluid by ascending and descending motions as shown in figures 7 and 10. An experimental analysis of suspensions in the RBC system would further validate this statement.
We have further examined the total heat current  $({j^{th}})$ to obtain the Nusselt numbers. It has been shown that the heat current is constant across the gap. Meanwhile, the total heat current
 $({j^{th}})$ of (4.3) can be divided into two contributions, convective
 $j_{conv}^{\; th}\;( = \; v\theta )$ and diffusive
 $j_{diff}^{\; th}\;( ={-} {\alpha _s}\partial \theta /\partial y)$ transports. The distributions of each term are illustrated in figure 16. It can be observed that above the threshold
 $R{a_c}$ the heat is mostly transferred by the molecular diffusion (figure 16a). However, the convective term
 $(j_{conv}^{\; th})$ becomes a dominant contributor for the heat transfer, and this particularly occurs in the middle of the gap as Ra grows (figure 16b). This is due to the strengthening convection rolls. In addition, the convective flow generated by the buoyancy is intensified by increasing Ra; therefore, it strengthens the convective heat flux.
Distributions of the total heat current  $({j^{th}})$ and its components for
 ${\phi _b} = 0.2$; (a) Ra = 3230 (Ra* = 1713.54) and (b) Ra = 8000 (Ra* = 4244.07). The values were normalized by
 ${\nu _o}\Delta T/d$.

The Nusselt numbers (Nu) for various Ra values that are larger than Rac were computed in figure 14 to estimate and understand the performance of the heat transfer in suspensions. The most remarkable conclusion is that the heat transfer rate is enhanced above the threshold  $R{a_c}$, where it is higher for higher particle concentrations, while the rate of increase in Nu gradually decays as more particles are added into the fluid. This effect can be also interpreted by the convective flow. As stated earlier, the sharp increase in Nu at the critical Ra results from the subcritical convection because the convective flow does not decay, even though Ra approaches the critical point. However, the intensity of the convective flow above
 $R{a_c}$ decreases as the volume fraction of the suspension increases because the higher viscosity of the suspensions enhances the viscous dissipation of the momentum in the flow. Moreover, temperatures are more homogenized with a higher effective thermal diffusion leading to less buoyancy and thus less convection. Subsequently, as shown in figure 14(b), the heat transfer rates for higher concentrations increase gradually with Ra at a moderately high Ra. To support this, the saturated values of amplitude
 $|A|$, defined in (3.6), are plotted against
 $Ra - R{a_c}$ in figure 17. The value of
 $|A|$ represents the intensity of the convective flow that is established by the convection rolls. As illustrated in the plot, the variations of
 $|A|$ are consistent with those of Nu displayed in figure 14(b). This then provides evidence for the role of convective flow.
Variations of the saturated amplitude  $|A|$ normalized by
 ${\nu _o}/d$ against
 $Ra - R{a_c}$ for the various
 ${\phi _b}$.

The results of our numerical simulation have indicated that the observed dependence of the heat transfer on particle concentration is closely related to the migration of particles. In fact, the particle migration can affect not only the conductive heat transfer through the heterogeneous distribution of thermal diffusivity αs but also the convective heat transfer through the modification of convection flow produced due to non-uniform viscosity of suspensions.
In the classical RB convection, a variety of flow patterns are observed for  $Ra \gt R{a_c}$, depending not only on the distance from the criticality in Ra but also on the Prandtl number (Krishnamurti Reference Krishnamurti1973). The heat transfer also depends on Prandtl (Grossmann & Lohse Reference Grossmann and Lohse2000). As our results show, the nonlinear behaviour of thermal convection in suspensions is distinct from the RB convection even at small particle volume fraction. The effective viscosity and thermal diffusivity of suspensions are not enough to predict flows from the analogy with the RB convection. Thorough investigations are thus necessary to elucidate the effects of the Prandtl number on suspension thermal convection.
6. Conclusion
Rayleigh–Bénard convection for the flow of non-colloidal, non-Brownian suspensions has been numerically studied by both linear stability analysis and numerical simulation based on a mathematical model. We employed a constitutive model known as DFM to describe the dynamics of suspended particles and solved it with conservation equations for the suspension flow. A simple correlation for the effective thermal diffusivity of suspensions, which is linear with respect to the thermal Péclet number  $(Pe)$ and the particle volume fraction (ϕ), has been employed to account for the shear-induced thermal diffusion in suspensions. The impact of the particles on the stability, flow and heat transfer have been investigated in detail for a wide range of bulk volume fractions
 ${\phi _b} \in [0-30\%]$.
To predict the critical states of the instability, we employed the linear stability analysis for the bulk particle volume fraction  $({\phi _b})$ up to 30%, given particle size
 $(\epsilon )$ and Prandtl number (Pr). The critical Rayleigh number
 $(R{a_c})$, at which the transition from conductive to convective states occurs, increases with
 ${\phi _b}$. In contrast, the critical wavenumber
 $({k_c})$ remains constant and is identical to the value for a pure Newtonian fluid
 $({k_c} = 3.12)$. We showed that the current instability analysis could be regarded as the Rayleigh–Bénard instability of a single-phase flow in which the viscosity is modified due to the suspended particles where the critical Rayleigh number for the suspension is given by
 $R{a_c} = R{a_{RB,c}} \cdot \; {\eta _r}({\phi _b}) = 1708/{(1 - {\phi _b}/{\phi _m})^{1.82}}$. We performed numerical simulation to confirm the results of the linear stability analysis and to determine the nature of flow transition. To obtain the critical values of Ra from numerical simulations, we used the Landau model and we found that the results are consistent with those of the linear stability analysis. The type of bifurcation has also been identified by the Landau model and it was found that the transition arises through a subcritical bifurcation for the flow of the suspensions. This marked contrast to the Rayleigh–Bénard instability in pure Newtonian fluids was explained from the shear-induced particle migration and resulting low viscosity zones in suspensions.
We also examined the flow, temperature and concentration fields above the  $R{a_c}$. At the onset of the instability, counter-rotating convection rolls are built and the particles are accumulated in the core of the rolls that form the ring-shaped structures in the particle concentration field caused by the shear-induced particle migration. These ring-shaped structures can be observed more clearly for higher
 ${\phi _b}$. As Ra increases, more vortices are developed with a decreased wavelength, resulting in more particles staying in the core of the vortices. Although the ring-shaped feature, in the concentration field, is not distinctly found, the shear-induced migration toward the surroundings of the vortex centre still appears as Ra further increases. We then computed the variation of Nusselt number (Nu) with Ra for different
 ${\phi _b}$, to estimate the heat transfer in the suspensions. The heat transfer rate is substantially enhanced by the convection rolls, and it rises steadily with Ra. This effect decreases with particle volume fraction since the convective flow decays for higher concentrations.
To get insights into the instability mechanism due to the existence of the particles, we further examined an evolution equation of flow kinetic energy. The dissipative force is intensified by increasing  ${\phi _b}$ because the effective viscosity of suspensions increases. The buoyancy force
 $(\rho \beta \theta g)$ on suspensions should then increase to overcome the viscous energy dissipation. Consequently, the critical Rayleigh number Rac becomes larger for higher concentrations. This might raise the question of the robustness of the continuum models such as DFM in the instability analysis as it involves several constants and the constitutive laws that were defined from experimental measurements and computational analysis. Further studies with physical models that capture both the flow and particle dynamics properly are needed to confirm the nature of the role played by the mechanisms identified in this work.
The interests in heat transport of suspensions, such as in thermal systems of spacecraft (Mulligan, Colvin & Bryant Reference Mulligan, Colvin and Bryant1996), solar plant (Flamant et al. Reference Flamant, Gauthier, Benoit, Sans, Garcia, Boissière, Ansart and Hemati2013), and electronic devices for cooling (Dbouk Reference Dbouk2019), make it natural to extend the stability study to suspension flow systems where the present results might serve as a new method to control the suspension flows and their pattern formation in engineering systems. The stability analysis carried out in this study could also be useful in determining the adequacy of a constitutive rheological model such as DFM in describing the free convection phenomenon. Experimental investigations on suspension thermal convection are highly desirable. For example, the impact of the subcritical instability on heat transfer, determined in the present study, needs to be validated.
Funding
This work has been supported in part by the National Science Foundation award no. 1854376 and partially by the Army Research Office award no. W911NF-18-1-0356 to C.K. and P.M. We also acknowledge the University of Illinois at Chicago to support C.K. for funding.
Declaration of interests
The authors report no conflict of interest.
Appendix. Determination of the instability thresholds
In the three-dimensional (3-D) space  $(k,Ra,\sigma )$, the growth rate
 $\sigma = \sigma (k,Ra)$ emerges from the plane
 $\sigma = 0$ when Ra is large (figure 18a) where the emergence is sharp and
 $\sigma $ increases linearly with Ra. The instability threshold
 $R{a_m}$ for a given wavenumber k can thus be estimated by linear extrapolation (figure 18b). This determination method is beneficial to perform comparisons with experiments and a numerical simulation where the instability thresholds are often determined by the extrapolation of the observed growth rate behaviour.
Behaviour of the growth rates of the most unstable modes. (a) Growth rate surface  $\sigma = \sigma (k,Ra)$. (b) Determination of the instability threshold
 $R{a_m}$ by extrapolation. The parameters are for
 $Pr = 7$,
 ${\phi _b} = 0.03$,
 $\mathrm{\epsilon } = 0.02$ and
 ${K_c} = 0.41$. The wavenumber is fixed at
 $k = 3.12$ in (b).



